$XRP All Tie High After Shallow Pullback?CRYPTOCAP:XRP had a fantastic week smashing all resistances. I am looking for a shallow pull back to test the High Volume Node support at $2.7 at the .236 Fibonacci retracement before continuing to challenge the all time high.
Wave (3) of a motif wave appears complete adding confluence to a shallow retracement for wave (4).
Daily RSI is extremely overbought.
Safe trading
Fibonacci

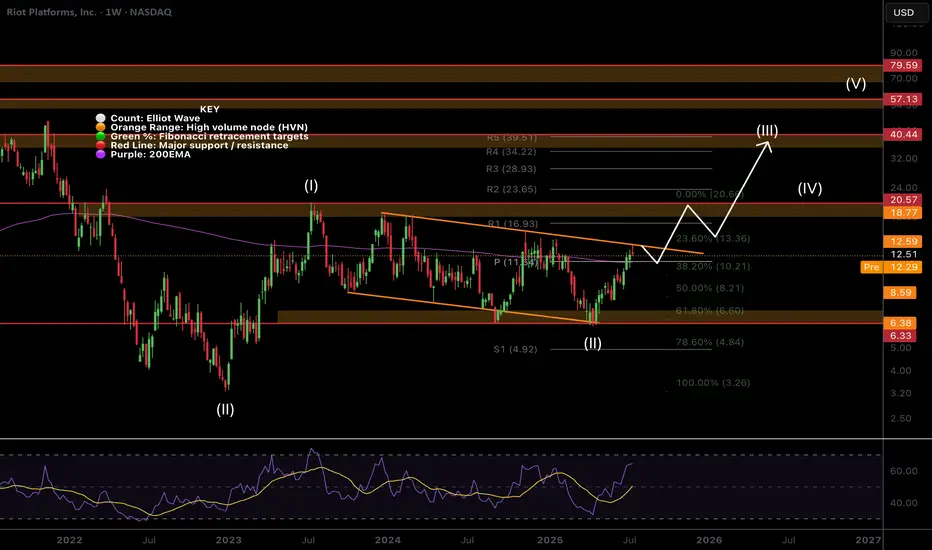
$RIOT Hit The Target Whats Next?NASDAQ:RIOT hit the descending orange resistance were I took partial take profits on my trade this week and it was immediately rejected as expected.
Price is now above the weekly pivot so that is the next support. This level also matches the weekly 200EMA.
Wave (II) hit the 'alt-coin' golden pocket of 0.618-0.786 Fibonacci retracement at the High Volume Node (HVN) support and descending support line which kicked off wave (III).
A breakout above the descending resistance line bring up the the next target of the HVN and previous swing high at $18-20 and $40 following a breakout above that.
Safe trading
$MARA Hits the Weekly PivotNASDAQ:MARA path has been grinding higher clearing the High Volume Node (HVN) resistance where it is sat as support.
The weekly pivot rejected price perfectly so far but if the count is correct and Bitcoin doesn't dump I expect this continue strongly towards the descending orange line resistance as my partial take profit target.
Once that line is broken i am looking at terminal bull market targets of $80 but will of course take profit at key areas along the way.
Wave 2 swung below the descending support and recovered at 0.5 Fibonacci retracement potentially kicking off wave 3.
Safe trading

$HUT Clear for Further Upside?NASDAQ:HUT is having a great time clearing resistances, the weekly 200EMA and the weekly Pivot point did not prove challenging.
It is currently sitting in a High Volume Node (HVN) where price is likely to reject and retest the weekly pivot as support before continuing upwards towards $32 and beyond in wave 3.
Wave 2 tested the 'alt-coin' golden pocket between 0.618-0.782 Fibonacci retracement giving me confidence in the count.
Safe trading

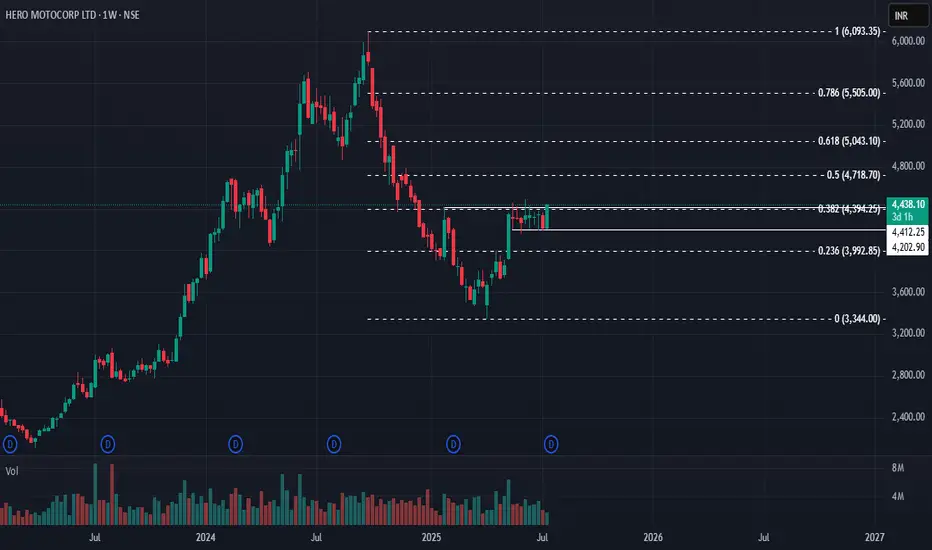
Hero MotoCorp: Reversal in Sight? 🚀 Hero MotoCorp: Reversal in Sight? 🚀
📉 CMP: ₹4438
🔒 Stop Loss: ₹4090
🎯 Targets: ₹5030 | ₹5700
🔍 Why Hero MotoCorp Looks Promising?
✅ Rounding Bottom Breakout: Weekly close above ₹4412 confirms this bullish reversal pattern
✅ Box Breakout: 8-week consolidation range of ₹4454–₹4202 broken above ₹4460, signalling strength
✅ Flag & Pole Setup: Larger range of ₹3354–₹4454 forms a flag-pole structure with breakout above ₹4460
💡 Strategic Insight:
📈 Confirmation Level: A weekly close above ₹4500 will further confirm reversal for long-term upside
🔒 Strict SL: Maintain stop loss at ₹4190 to manage downside risks effectively
📍 Outlook: Multiple technical setups indicate potential for a long-term bullish reversal with targets up to ₹5700.
📉 Disclaimer: Not SEBI-registered. Please do your own research or consult a financial advisor before investing.
#HeroMotoCorp #AutoSector #TechnicalAnalysis #BreakoutTrade #ReversalPattern #SwingTrading #StockMarketIndia #InvestmentOpportunity
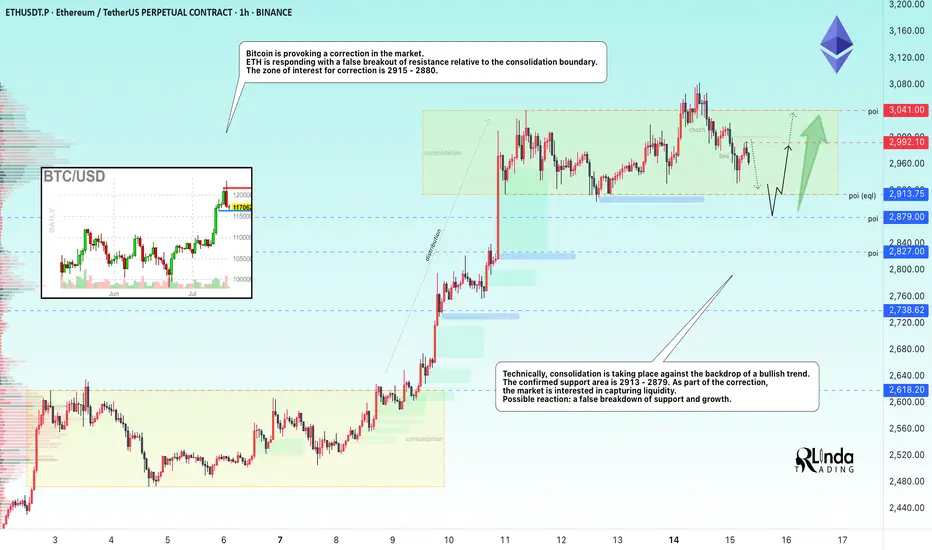
ETHEREUM → Correction to 2900 before growth BINANCE:ETHUSDT is entering a correction after a strong breakout of resistance. At the same time, Bitcoin is falling from 123K to 116K, triggering a pullback across the entire market...
On D1, ETH is facing strong resistance and is not yet ready to break it (it lacks strength after the rally). The most likely scenario after a false breakout is a correction to support. But the main focus is on Bitcoin — will there be a correction or a reversal of the local trend? If the flagship continues its decline, the cryptocurrency market will humbly follow suit.
ETH has a nearest zone of interest at 2913, where liquidity capture could attract buyers, but I do not rule out the possibility that the correction could go much deeper before further growth, for example to 2879-2827 (support on D1).
Resistance levels: 2992, 3041
Support levels: 2913.7, 2879, 2827
Technically, consolidation against a bullish trend. Confirmed support area 2913 - 2879. As part of the correction, the market is interested in capturing liquidity. If, against the backdrop of the current correction, the bulls manage to hold their ground above the specified support, ETH may still surprise us with its growth :)
Best regards, R. Linda!
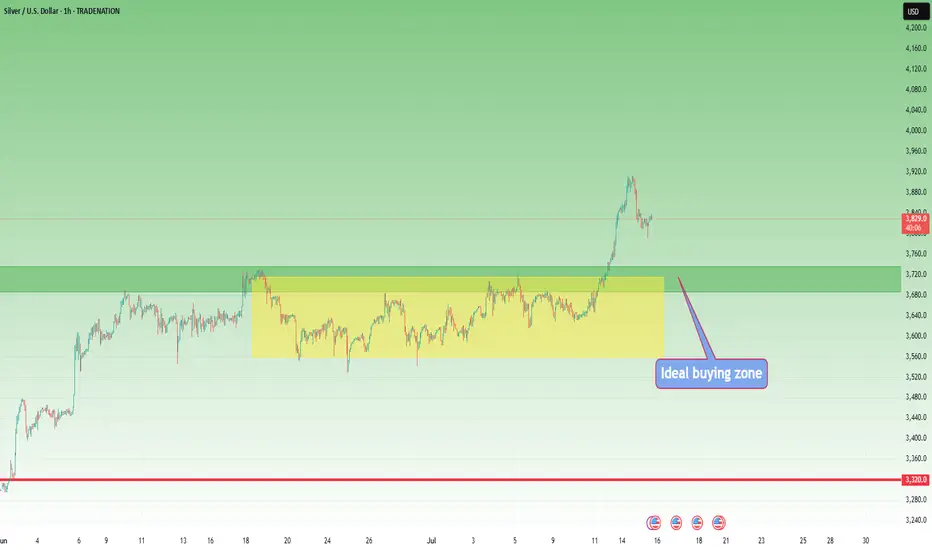
Silver Update (XAGUSD): Eyeing the Next Move After the $39 SurgeAs mentioned in my Friday analysis, Silver ( TRADENATION:EURUSD XAGUSD) was preparing for an important breakout — and indeed, the market delivered. The clean break through resistance triggered a strong acceleration, pushing the metal up to $39, pretty close to the psychological $40 level.
Now, we’re seeing a healthy correction after this steep rise, and this could turn into a buying opportunity for the bulls.
📌 Key support zone:
The ideal area to watch is between $37.20 and $37.50 — this is the sweet spot where bulls might step back in.
But be aware:
👉 After strong breakouts, the broken resistance doesn’t always get retested — sometimes the price rebounds from higher levels.
🎯 Plan of Action:
• Monitor price action under $38
• Watch for reaction patterns and structure shifts
• Don’t force entries — let the market confirm
Silver remains strong as long as the structure holds, and this pullback might just be the market catching its breath before another leg up. 🚀
Disclosure: I am part of TradeNation's Influencer program and receive a monthly fee for using their TradingView charts in my analyses and educational articles.
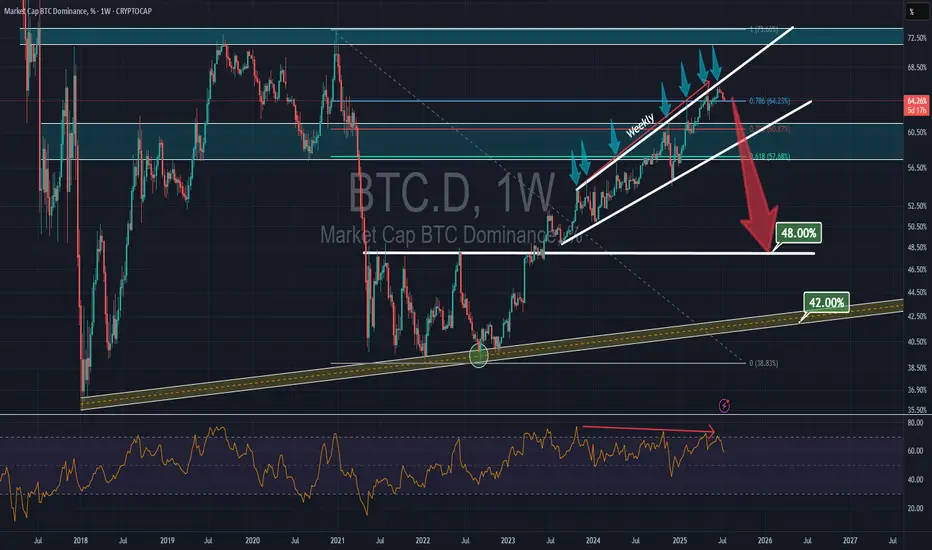
Bitcoin DOMINANCE dropssssBTC dominance has been within a rising channel since October 2023, showing a significant bearish divergence on the weekly RSI. After the seventh rejection from the channel's top, it may drop to the major support at 48%.
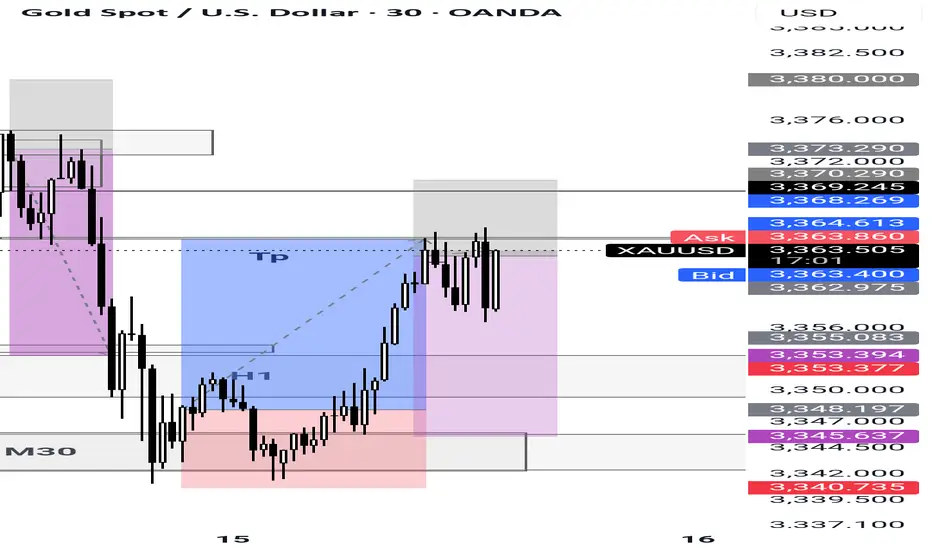
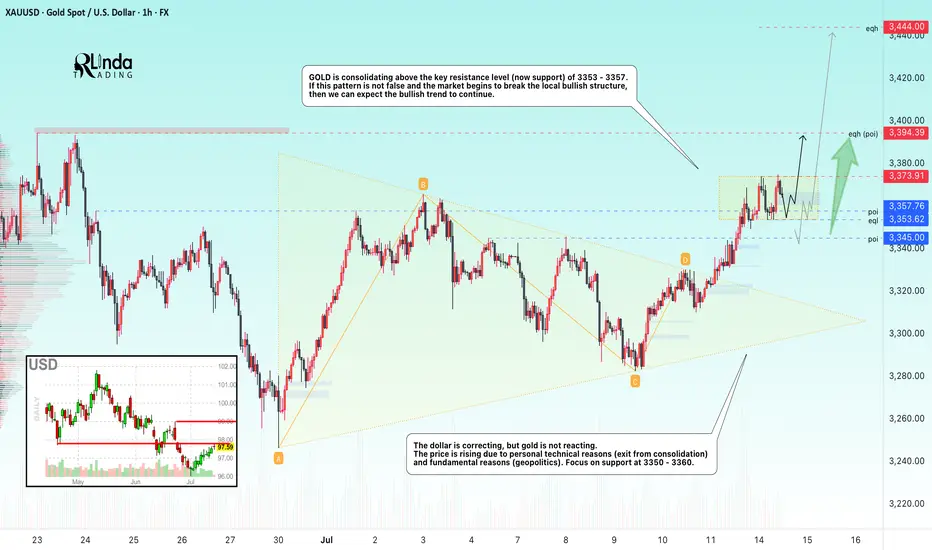
GOLD → Consolidation. Long squeeze before growth to 3400FX:XAUUSD has broken through resistance at 3353-3357 since the session opened, and bulls are currently trying to keep the market in the buying zone. Should we expect a long squeeze before growth?
Gold is in local consolidation after breaking through a key level. The price is still in the consolidation phase formed during a week-and-a-half correction. The price reached a three-week high of $3,374 on Monday but fell after the EU's conciliatory statements. Investors are awaiting US inflation data and Chinese GDP figures as they assess the prospects for a Fed rate cut. Heightened geopolitical and trade tensions are keeping demand for safe-haven assets high.
Technically, gold has entered a local buying zone, but there is a fairly complex resistance zone above it, and consolidation is needed to break through it. Such patterns could include a retest of support and a liquidity grab before growth.
Resistance levels: 3373, 3394
Support levels: 3357, 3353, 3345
There is a possibility of a retest of eql 3353 in a long squeeze format and a return to resistance at 3373 for a breakout. I also do not rule out a retest of the key level of 3345. The global trend is bullish, with the price locally in a fairly wide range, with an emphasis on the support zone of 3345-3355. If the bulls can hold this zone overall, the market will have a good chance of rising to 3400-3450
Best regards, R. Linda!
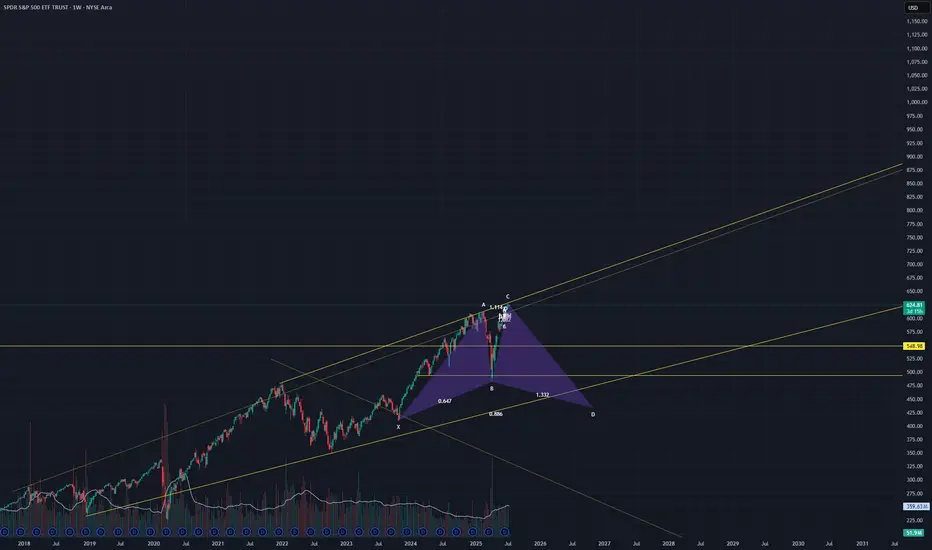
SPY is about to dumpThere isn't much to say. Chart speaks for itself. Possible shark farming if we hit resistance at this trendline that was resistance since 2022. Not shown but its also at the 707 extension of the October '24 and April '25 low.
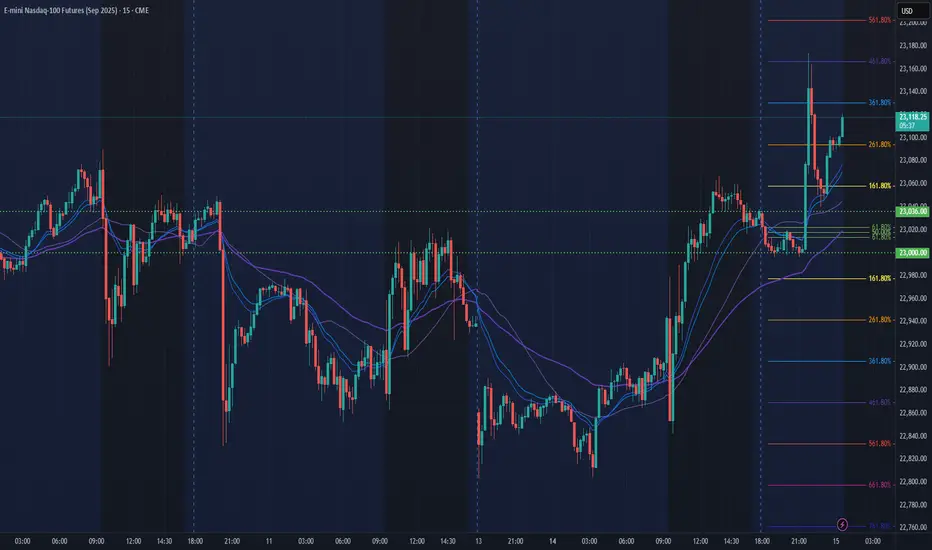
NQ Power Range Report with FIB Ext - 7/15/2025 SessionCME_MINI:NQU2025
- PR High: 23036.00
- PR Low: 23000.00
- NZ Spread: 80.5
Key scheduled economic events:
08:30 | CPI (Core|MoM|YoY)
Asian hours vol spike breakout swing into new ATHs
Session Open Stats (As of 12:15 AM 7/15)
- Session Open ATR: 290.39
- Volume: 42K
- Open Int: 276K
- Trend Grade: Neutral
- From BA ATH: -0.3% (Rounded)
Key Levels (Rounded - Think of these as ranges)
- Long: 23239
- Mid: 21525
- Short: 20383
Keep in mind this is not speculation or a prediction. Only a report of the Power Range with Fib extensions for target hunting. Do your DD! You determine your risk tolerance. You are fully capable of making your own decisions.
BA: Back Adjusted
BuZ/BeZ: Bull Zone / Bear Zone
NZ: Neutral Zone
Bitcoin still a long: Target remains at $124,632This is an update to the wave counts for Bitcoin. We are in the final wave 5 of 5 of 3 and the target remains at around $124,632.
The stop can be adjusted to around $120,433, below the wave 2 of 5 of 3.

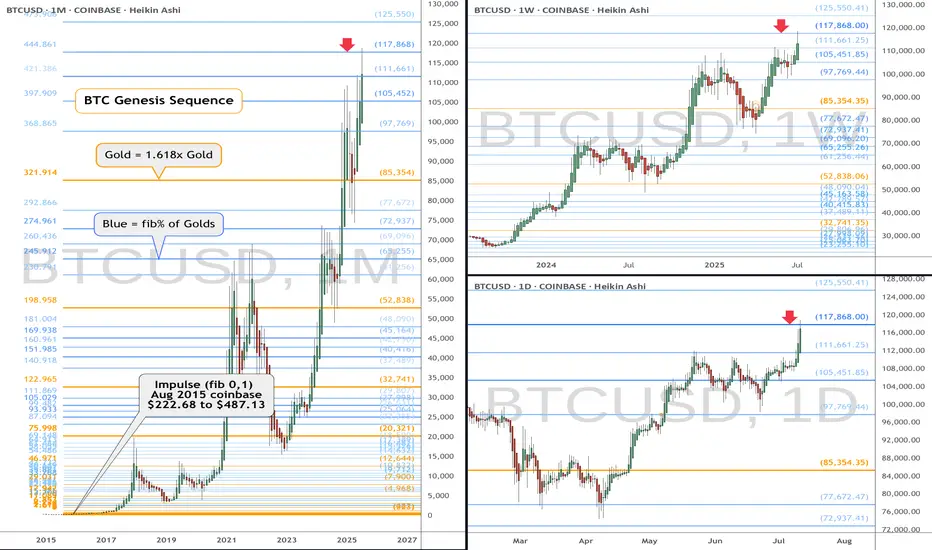
BTC eyes on $117,868: SemiMajor Genesis fib to Orbit a few times\Shown here is a single fib series in three different time-frames.
The "Genesis Sequence" has called all major turns since 2015.
This are "High Gravity" Fibs try to capture price into Orbit.
$ 117,668.00 (Coinbase) is the exact level of interest.
$ 111,661.25 is the first support below, a minor ratio.
$ 105,451.85 is semi-major and MUST hold fib below.
$ 125,550.41 is the next target above, a minor ratio.
See "Related Publications" for many PRECISE and TIMELY charts -------->>>>>>>
.
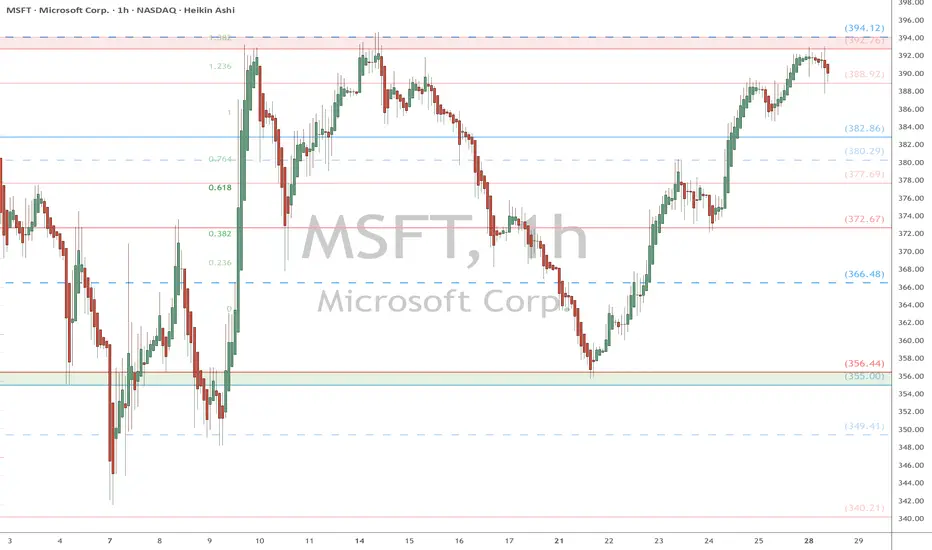
MSFT watch $392.76-394.12: Key Resistance to Tariff RecoveryMSFT testing a well proven Resistance zone $392.76-394.12
This zone rejected twice already, now may be ready to break?
Fib reactions have been precise, so look for Break-n-Retest
EURJPY IDEA After seeing the previous day close with bullish momentum we could expect continued push to the upside but since the 4hr is trading at a HH area a slight retrace could occur before the next bullish move to the upside

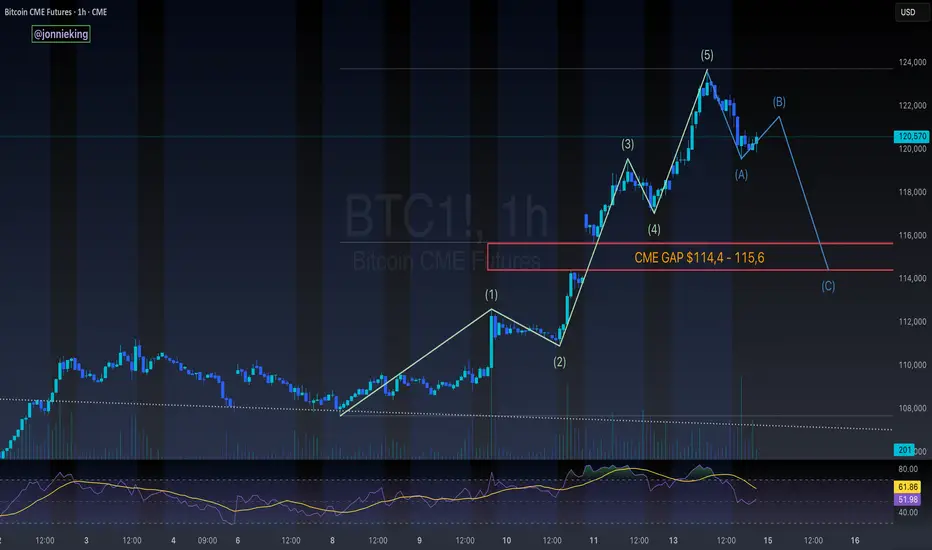
$BTC 5-Wave Impulse > ABC Correction > CME GapCRYPTOCAP:BTC appears to be headed towards an ABC correction after this impulsive 5-wave move to the upside
Would be a great opportunity to fill the CME gap ~$114k
Lines up perfectly with the 50% gann level retracement to confirm the next leg
don't shoot the messenger..
just sharing what i'm seeing 🥸
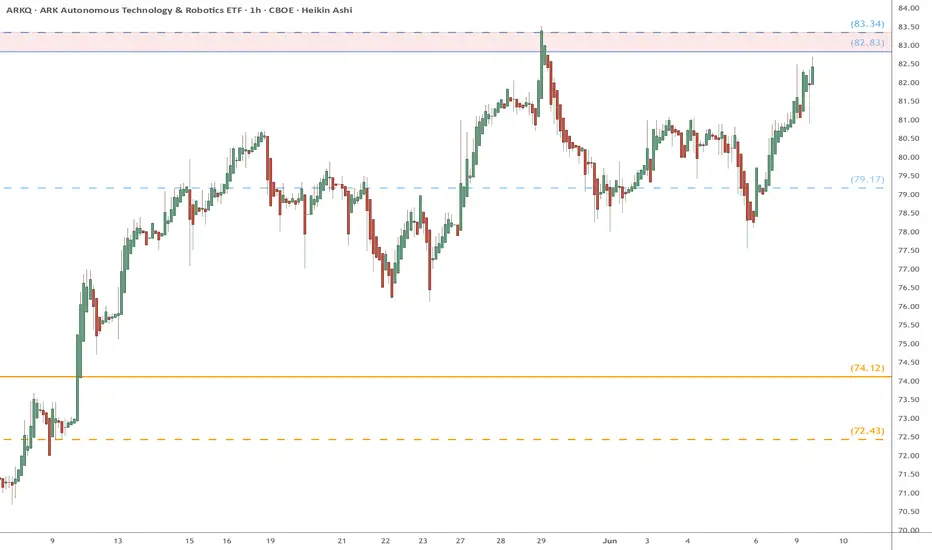
ARKQ heads up at $83.xx: Proven Resistance break should RUN hardARKQ about to try a well proven resistance again.
Dual fibs mark the rejection zone $82.83-83.34
Looking for a Break-and-Retest for long entries.
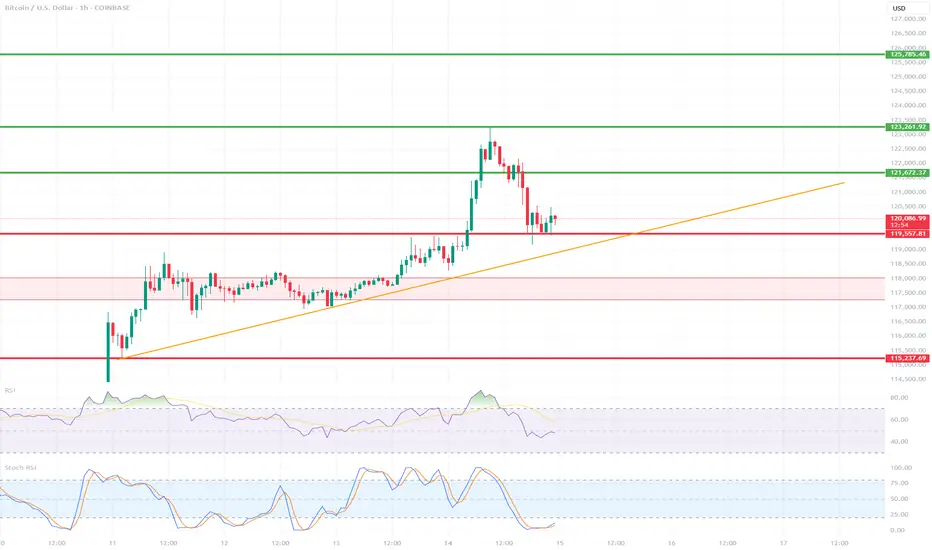
BTC/USD 1H ShortTerm🔍 Trend:
The short-term uptrend remains in effect, supported by the orange trendline.
The price has tested dynamic support but has not yet broken it.
🟥 Supports (Important Levels):
🔻 1. 119.550
Key support.
The price is currently testing it. Holding = potential upside rebound.
Breaking = greater downside risk.
🔻 2. 117.260–118.040 USD
Clear demand zone (reinforced by prior consolidation).
If the price breaks below current support, this is the next logical stopping point.
🔻 3. 115.237–115.500 USD
Strong weekly support – very important in the event of a stronger correction.
Historically, it has responded many times.
🟩 Resistance:
🔼 1. USD 121.673
The nearest local resistance – this could pose a problem for further growth.
🔼 2. USD 123.961
The last local high. Breaking it confirms the continuation of the uptrend.
🔼 3. USD 125.785
The next resistance – a potential target after a breakout to the upside.
📈 Technical Indicators:
RSI (classic):
Still below 50, but starting to reverse slightly upward – neutral with a slight potential for a rebound.
Stochastic RSI:
Gives a long signal – the lines have crossed in the oversold zone and are pointing upward.
📊 Scenarios:
🟢 Bullish:
Maintaining the current support zone (119.5–120k).
Breakout above 121.673 → target: 123.961.
Breakout of 123.961 = trend confirmation and target: 125.8k+
🔴 Bearish:
Break of the trend line and support at 119.550 → possible quick decline to 117.2k–118k.
If this doesn't hold, target: 115.2k
✅ Summary:
Decisive moment – tested trend line + support = rebound or breakout point.
The Stochastic RSI indicates a potential upside breakout, but the RSI needs confirmation.
Careful monitoring of volume and reaction to 120k in the coming hours.
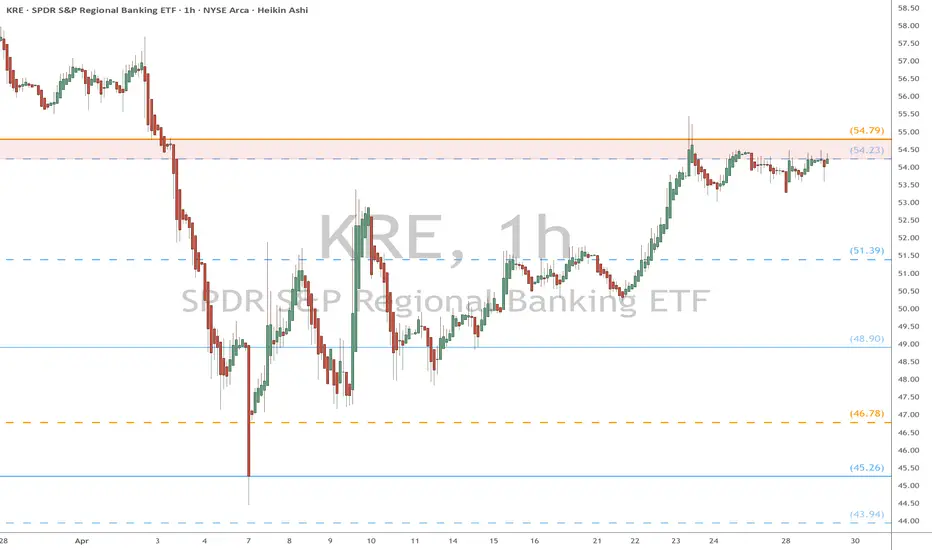
KRE eyes on $54.xx: Major Resistance zone to Break or RejectKRE recovering nicely from the tariff tantrums.
But up against a major resistance zone $54.23-54.79
Want a Break-n-Retest or dip to lower fib at $51.39
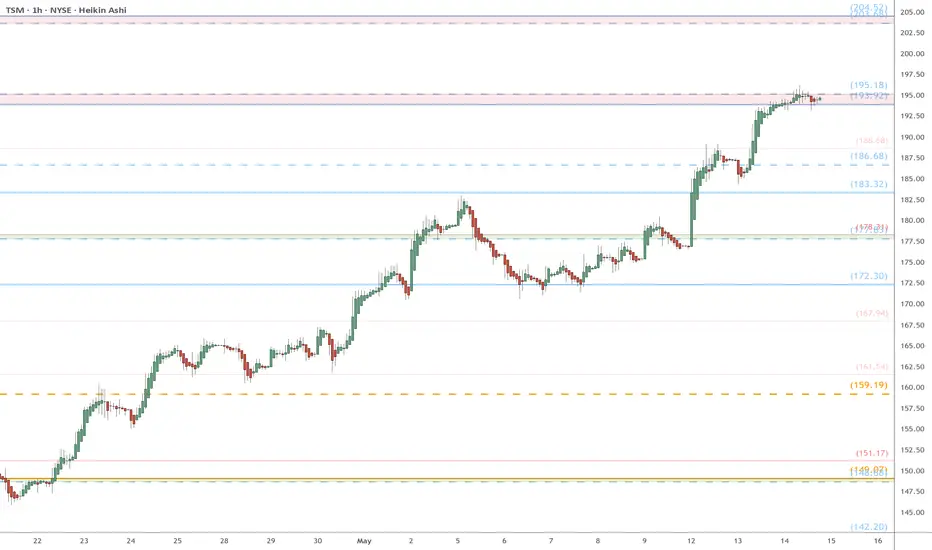
TSM eyes on $194: Major Resistance to Break-n-Run or Dip-to-Buy TSM has been recovering with the chip sector.
Currently testing a Major Resistance zone.
Look for a Dip-to-Buy or Break-n-Retest entry.
$193.92-195.18 is the exact zone of concern.
$177.83-178.31 is the first major support.
$203.68-204.56 is the first resistance above.
========================================
.
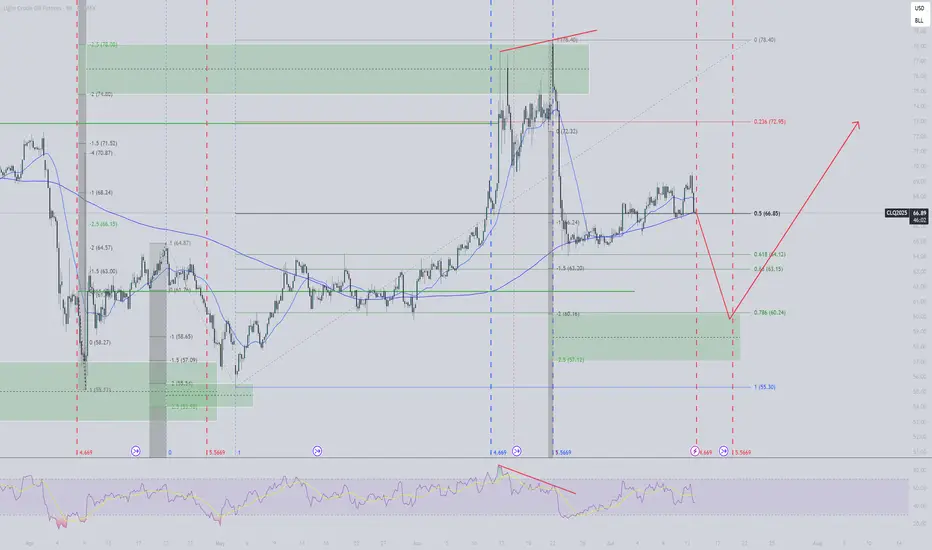
CL down sub $60 before moving up above $73Expected support or reversal zone based on last swing high for CL is at $60. This matches with 0.786 fib level of last move up, suggesting a standard SBS structure forming. Expecting a move up to at least $73 (fib 0.236), possibly also well beyond this.
Based on time fib of last swing high I expect the bottom to occur before July 20th.
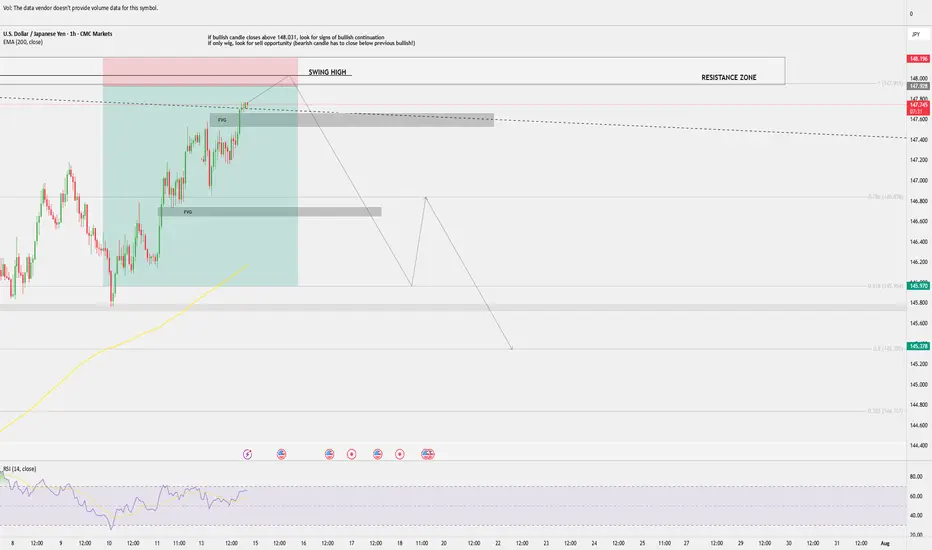
USD/JPY sell opportunity approaching?USD/JPY is approaching previous swing high and resistance zone.
Bullish closure above the swing high (148.031) could indicate further push up.
Failure to close above swing high (bullish candle tapping into it, but only with the wig) and second bearish candle closing below the previous bullish opens sell opportunity.
SELL IDEA
entry: 147.928
SL: 148.196
TP: 145.970 (around 0.618 Fib retracement)
Potential second TP at 145.378 (0.5 Fib retracement).
PLEASE NOTE THIS IS ONLY AN IDEA
I am not a professional trader, but learning to analyse and looking to share ideas and get feedback.