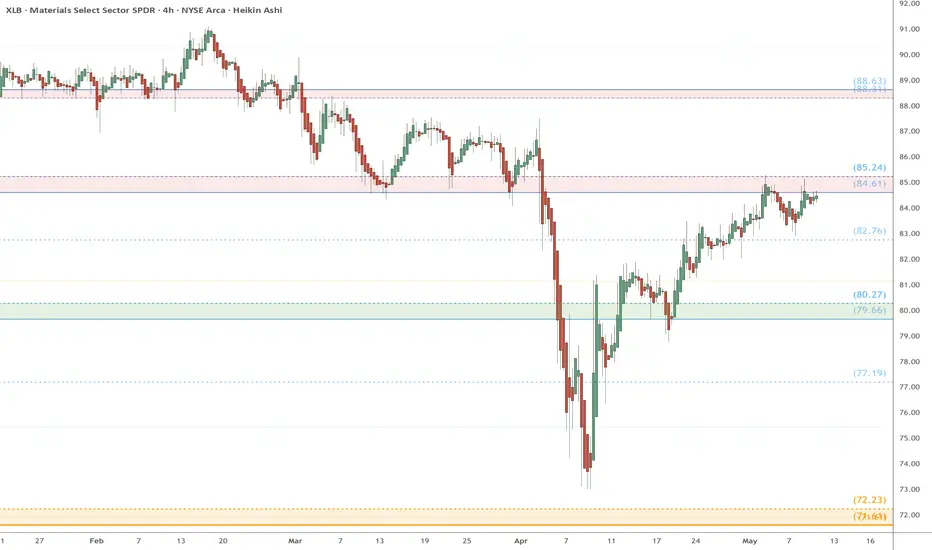
XLB eyes on $85: Proven Support zone to End Bounce or to Break?XLB has recovered the tariff tantrum dumps.
But struggling against a proven resistance zone.
Dip is likely, Break-n-Retest means Strong bull.
$84.61-85.24 (red) is the exact zone of concern.
$79.66-80.27 (green) is first strong support below.
$71.71-72.23 (Gold) a double golden major support.
=============================================
Fibonacci
Update gold time 1 hourI checked on the 15 minute time frame and saw liquidity points for us to consider trading, Gold price is being supported, candlestick patterns are showing signs of breaking resistance so consider volume for the sell-off plan. If you do not have a buy order in the idea below 👇
then set up a buy order according to this trading idea, good luck to you and us.

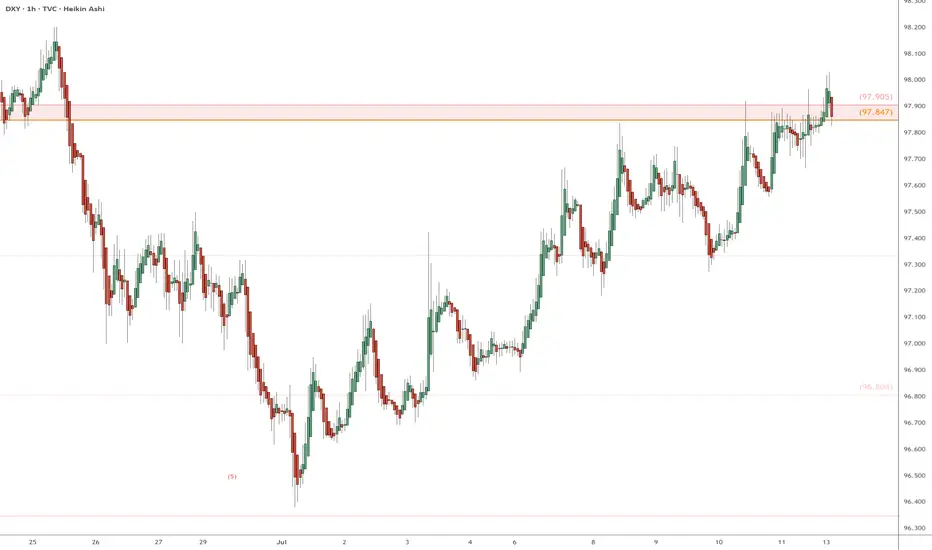
DXY eyes on 97.847 - 97.903 : Exact zone to break the DownTrend The Dollar has not been so mighty since Trump.
But there are signs of a possible bottom forming.
Key is the well known battle zone 97.847-97.905
Break and clean Retest would signal the bottom.
Rejecting here would start next leg southward.
Is the world really going to De-Dollarize? Nope.
===========================================
.
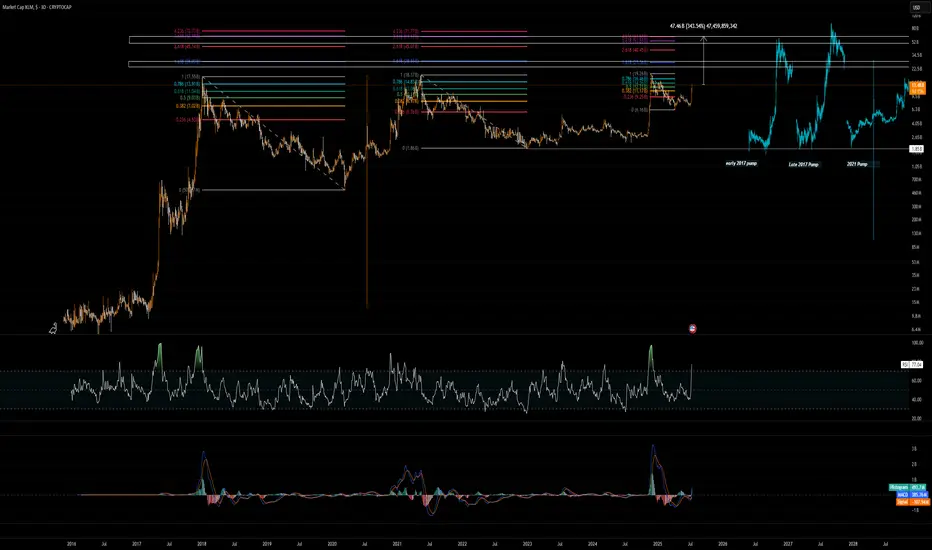
$TOTAL CRYPTO MARKET CAP BREAKOUT CONFIRMEDWhat a FILTHY Weekly Close back within the POI 🚀
Bulls are back in biz, for at least the next few weeks.
I’m expecting a bit of sideways chop here, and the next leg up the first or second week of August.
This is in no way, shape or form a call for “ALT SEASON”, yet.
Still need to see what happens in the next few weeks,
BUT IT LOOKS PROMISING 🙏

Bitcoin (BTCUSDT) Potential Move from $43,600 to $120,000Description:
Based on the current weekly chart analysis for Bitcoin / Tether Standard Futures (BTCUSDT), there is a significant potential for Bitcoin to move from $43,600 to $120,000. Below are the key points observed:
Current Price: Bitcoin is currently trading at approximately $54,806.45, down by 5.75%.
Elliott Wave Analysis:
The chart indicates a potential ABC correction pattern.
Wave A has completed, and Bitcoin is currently in Wave B, which suggests an upcoming bullish Wave C.
Support and Resistance Levels:
The primary support level is at $39,987.31.
The significant resistance level and target is the area around $120,000.
Fibonacci Retracement Levels:
38.2% Retracement: $31,145.00
50.0% Retracement: $23,356.00
61.8% Retracement: $15,568.00
Indicators:
RSI shows potential bullish divergence indicating a possible upward move.
Volume profile indicates strong accumulation in the lower price ranges.
Extrem Buy Alert: The chart highlights an "EXTREM BUY ALERT," suggesting that the current levels could be a significant buying opportunity before the expected upward move.
Chart Details:
Timeframe: Weekly (1W)
Ticker: BTCUSDT.PS
Exchange: Binance
Disclaimer: This analysis is based on historical data and technical indicators. It is not financial advice. Please conduct your own research before making any trading decisions.

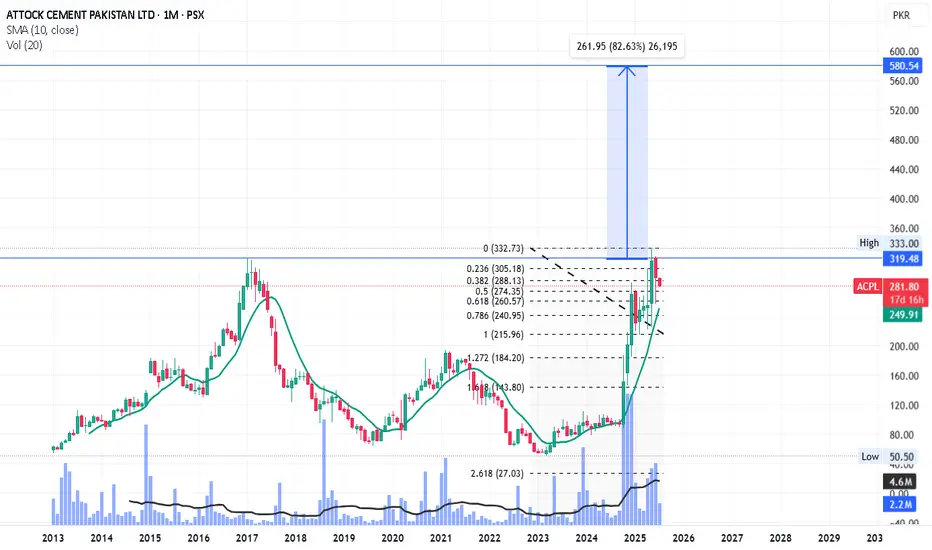
ACPL LongACPL tried to break its all-time high first time and failed. It may retrace to Fib-0.618 level (~260) where its SMA10 will push it upwards again. However, it may take some time that it breaks its all-time high and go for new highs. Ultimate target (580) is mentioned in chart.
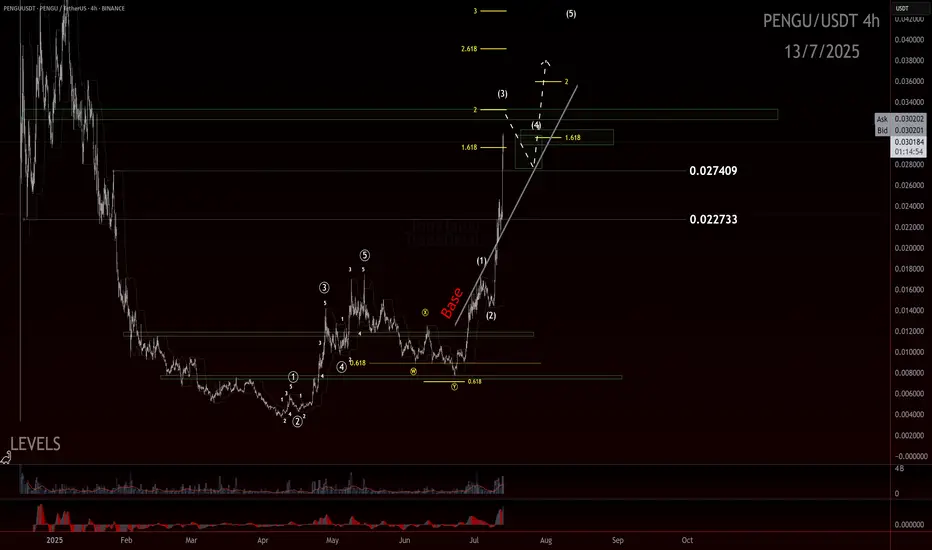
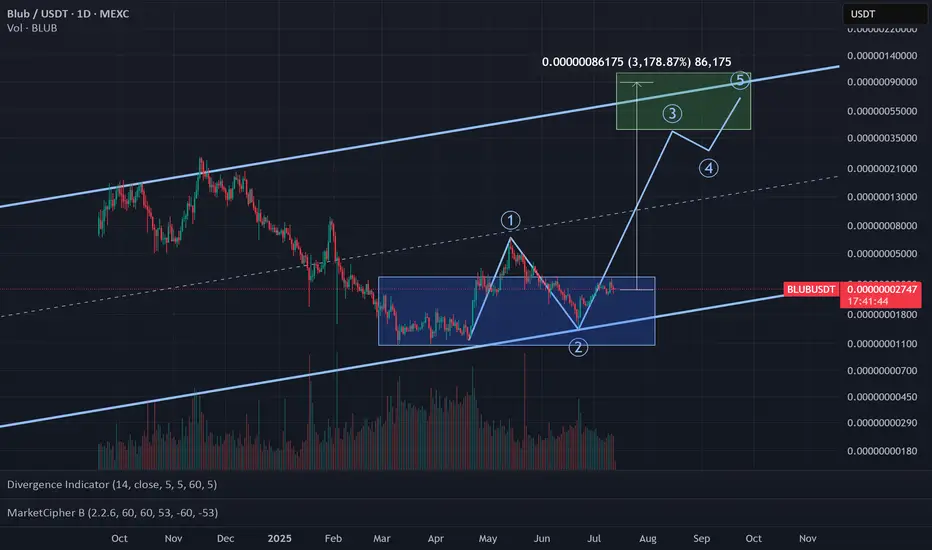
PENGU still has room!?If you find this information inspiring/helpful, please consider a boost and follow! Any questions or comments, please leave a comment!
The move off the low looked like a clean, completed impulse—sharp, decisive, and well-structured. After that, we got a double zigzag retracement. It ran a bit deeper than the textbook version, but still landed right in the normal range you’d expect for a healthy correction. From there, we saw another smaller-degree impulse form off the .007 pivot, suggesting bullish momentum was building again.
Since the last update, PENGU has come a long way—more than doubling in price and now hovering around a most likely target for a wave 3. What’s notable is how it got there: not just by breaking above the 0.017 resistance, but by blowing through multiple base channels on solid momentum and healthy volume.
We didn’t get the ideal depth for a retrace for a wave 2 before that breakout, but that doesn’t disqualify the larger count. In fact, from an Elliott Wave perspective, I still believe we haven’t seen a proper wave 4 to balance out the earlier wave (2). So I’m holding off on calling a top to this wave 3 just yet.
Here’s what we’re watching closely now:
The secondary impulse off .007 continues to build structure
Ideally, the next pullback holds above the 0.027 or .022 region, signaling respect for previous support and AOIs
That pullback needs to unfold correctively, not impulsively, to confirm bullish continuation
The next trade setup I’m eyeing is that wave 4 into wave 5 move. I’ll be stalking this ticker closely as structure unfolds.
Trade safe.
Trade clarity.
Spell Token (SPELL)On the above 2-day chart price action has corrected over 80%. A number of reasons now exist to be long, including:
1) Price action and RSI resistance breakouts.
2) Price action corrects to past resistance/support.
3) Price action backtest is also the Fibonacci 0.236
4) Finally, the flag breakout projects a 150% target.
Is it possible price action falls further? Sure.
Is it probable? no.
Ww
Type: trade
Risk: <=6%
Timeframe: Longs from now until month end
Return: 150%

GOLD continue bull? Hye guys. based on my previous mapping , market gave us almost 800pips , I expecting gold to reach price around 3395.
Clearly, market did a breakout in bullish flag pattern. So we can wait for retracement around 3330 fresh zone. if price break near support and make it as liquidity, it will continue to 3302..
dyor =)

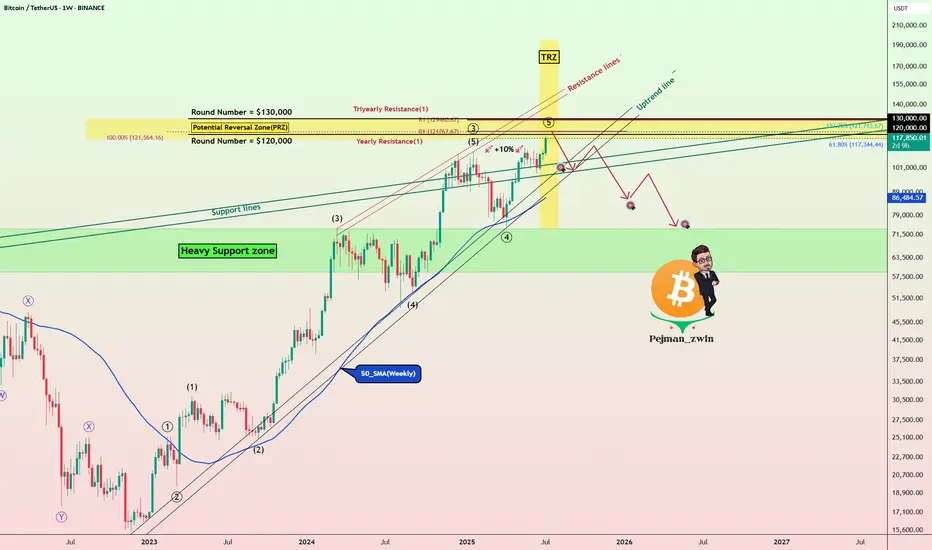
Bitcoin Roadmap=>End of RallyBitcoin ( BINANCE:BTCUSDT ) has gained nearly +10% in the recent weekly candle so far. The question is where this rally could end up. So to get to that zone, let’s go to the weekly timeframe .
Before we start this analysis, let’s take a look at my last analysis on the weekly timeframe , which was well into the Potential Reversal Zone(PRZ) . ( Analysis time: 9 JUN 2025 )
Bitcoin has now entered the Potential Reversal Zone(PRZ) and Time Reversal Zone(TRZ=June 23 to August 4) , and these zones could be the zones where this Bitcoin rally will end. Do you agree with me?
In terms of Elliott Wave theory , Bitcoin appears to be completing a main wave 5 , as the main wave 3 was an extended wave . The main wave 5 could end at the Potential Reversal Zone(PRZ) .
I expect Bitcoin to start a main correction from the Potential Reversal Zone(PRZ) and could continue to support lines and near the $105(at least) .
What do you think about the end of the Bitcoin rally?
Note: Sell orders near $120,000 are very heavy.
Note: Cumulative Long Liquidation Leverage attractive volume for liquidation.
Note: If Bitcoin goes above $130,000, it can continue to rise to the Resistance lines (near $150,000).
Please respect each other's ideas and express them politely if you agree or disagree.
Bitcoin Analyze (BTCUSDT), weekly time frame.
Be sure to follow the updated ideas.
Do not forget to put a Stop loss for your positions (For every position you want to open).
Please follow your strategy and updates; this is just my Idea, and I will gladly see your ideas in this post.
Please do not forget the ✅' like '✅ button 🙏😊 & Share it with your friends; thanks, and Trade safe.
Bitcoin Long: Expects New High; Target 124,632Over in this video, I update on the Elliott Wave counts for Bitcoin and explain why I think that Bitcoin is going higher for a wave 5 of 3 of 5.
The stop loss will be below the wave 4 and given some leeway, will be around 115,900. There are 2 Take profit targets:
1. 119,251, and
2. 124,632
I made it known that my personal preference is $124,632 but note that once a new high is made, this wave counts will already be validated even if it then drops to our stop.
I talk about the possibility of trailing the stop once a new high is reached but commented that every trader must trade based on their own style and risk preference.
Finally, Good luck in your trading!

[UPD] Trend analysis: BTC / ETH / SOL / XRP and other Just recorded a new video overview of the crypto market and the current trend developments in major coins: CRYPTOCAP:BTC , CRYPTOCAP:ETH , CRYPTOCAP:SOL , CRYPTOCAP:XRP , CRYPTOCAP:LINK , GETTEX:HYPE , BSE:SUPER , $FLOKI.
Among the new assets on my radar I shared my view on the trend structure of $RENDER.
In my personal investment planning, I continue to treat any potential corrections into key support zones as opportunities to add or open new positions.
Thank you for your attention and I wish you successful trading decisions!
If you’d like to hear my take on any other coin you’re tracking — feel free to ask in the comments (just don’t forget to boost the idea first 😉).

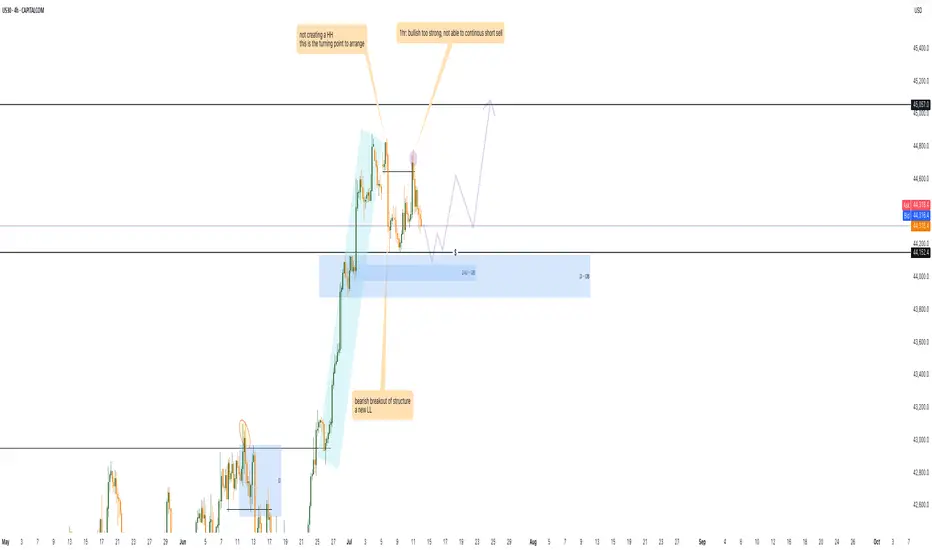
US30 prepare for the bullish 1. there is double bottom at 44152 level, i will tend to wait for the sweep meaning the price go down and hit the 4hr order block.
2. wait for 15m/ 30m TF a strong bullish momentum.
3. retest the 44152 around level or 0.618 to enter the market to long
XLM potentialXLM shows a great performance this cycle so far and it finally show some independency from XRP and lead without XRP getting pump.
Some might think it will go for ever, I am sorry to break your heart it won't be more than $70B market cap. best case scenarios.
Around $15B to $19B there will the first resistance.
1.618 fib in all timeframes will be the next, which will be $20B - $28 Market cap I think safe bet for final exit will be $53B market cap which is 350% from here.
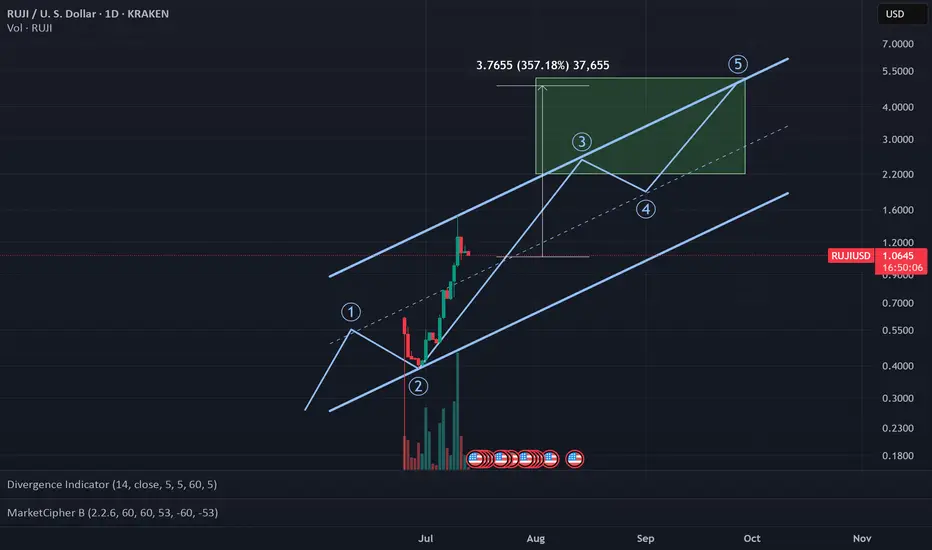
Altseason 2025 - Wave 3Bitcoin is approaching its next destination between $125K and $250K, and that means its time to shift focus to altcoins. We’re not in full-blown altseason yet, but the foundations are forming. BTC dominance needs to drop fast, that’s the key trigger. Once it does, the rotation into alts could accelerate quickly.
Favorites so far this cycle:
🥑 POLONIEX:GUACUSDT 🧱 MEXC:YBRUSDT ⛏️ MEXC:KLSUSDT
🌐 HTX:SYNTUSDT 🧪 POLONIEX:DEAIUSDT *⃣ MEXC:SAIUSDT
🔗 POLONIEX:LLUSDT 🎮 KUCOIN:MYRIAUSDT 🤖 COINEX:ENQAIUSDT
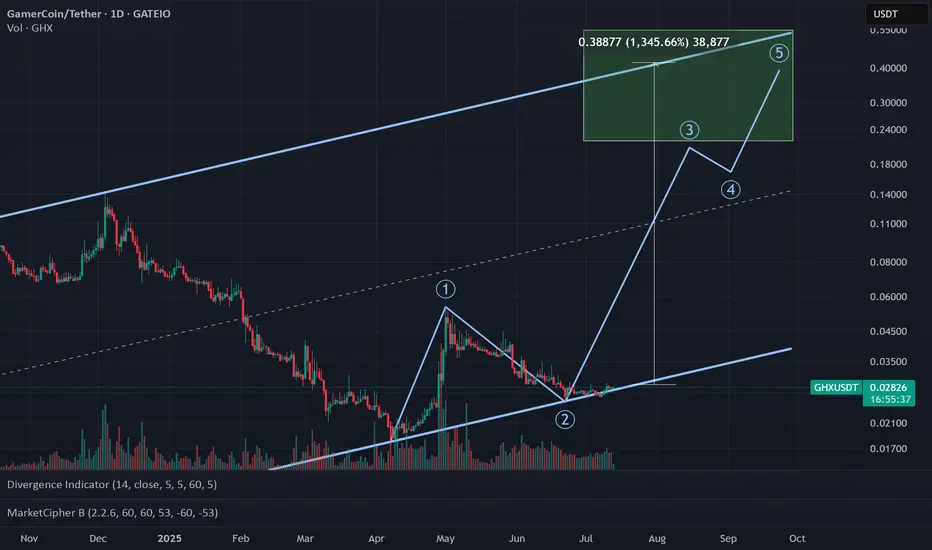
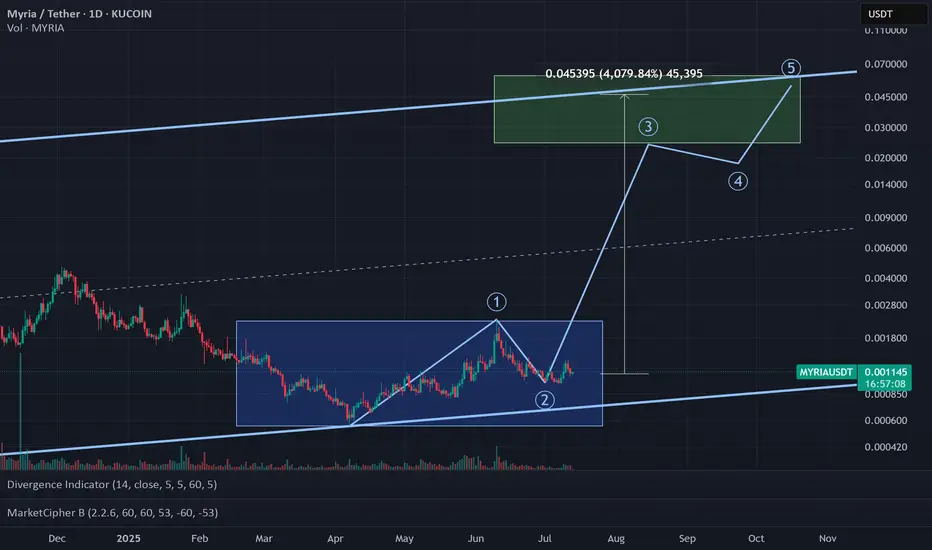
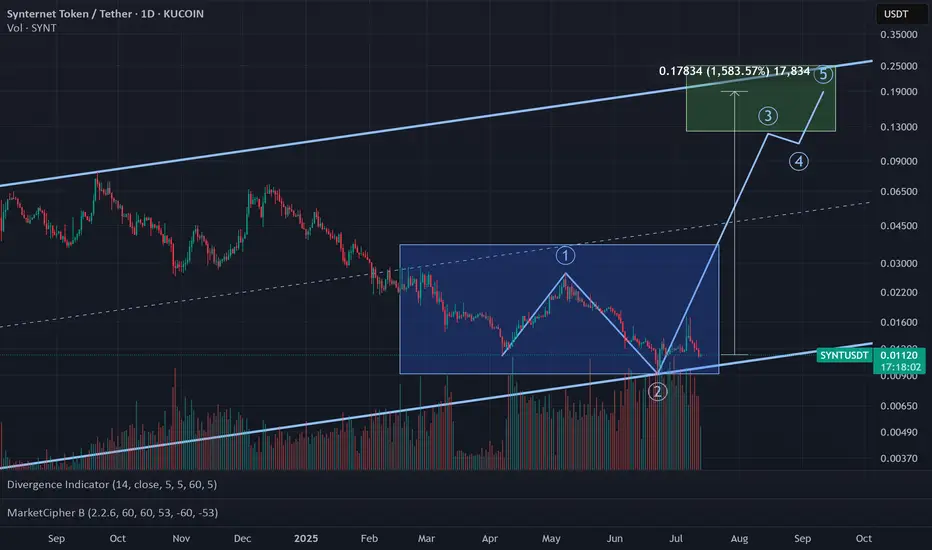
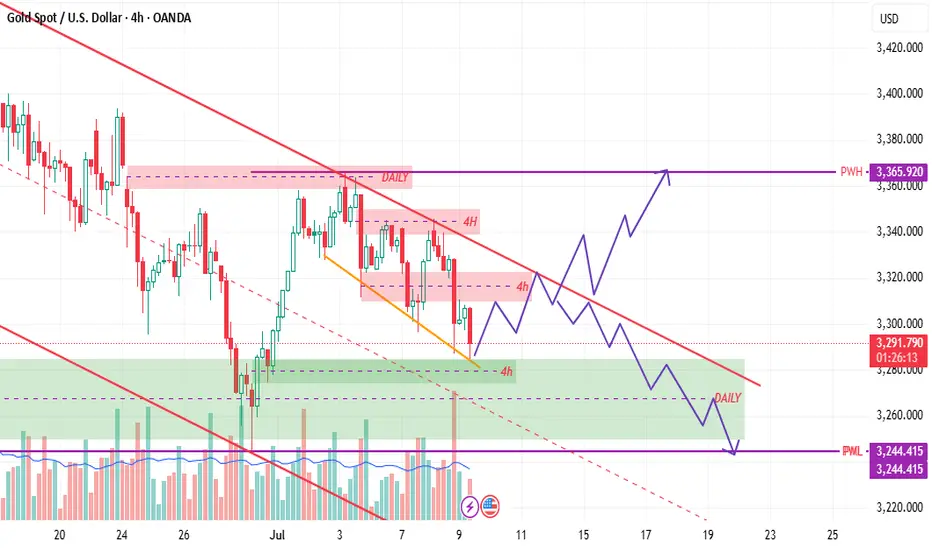
XAUUSD 4HHello,
this is my own opinion about XAUUSD timeframe 4h today
as far as i can see, XAUUSD 4h still in trendline channel downtrend
but, in meantime, we can see also pattern Flag has form, so i think we can entry now or wait for break downtrend/flag
but the seller volume is quite big in the previous candle 4h, so manage your own RRR (Risk Reward Ratio)
PWH = Previous Week High
PWL = Previous Week Low
Price now is around 4h bull fvg + daily
if we use fibonacci price also hit 0.618
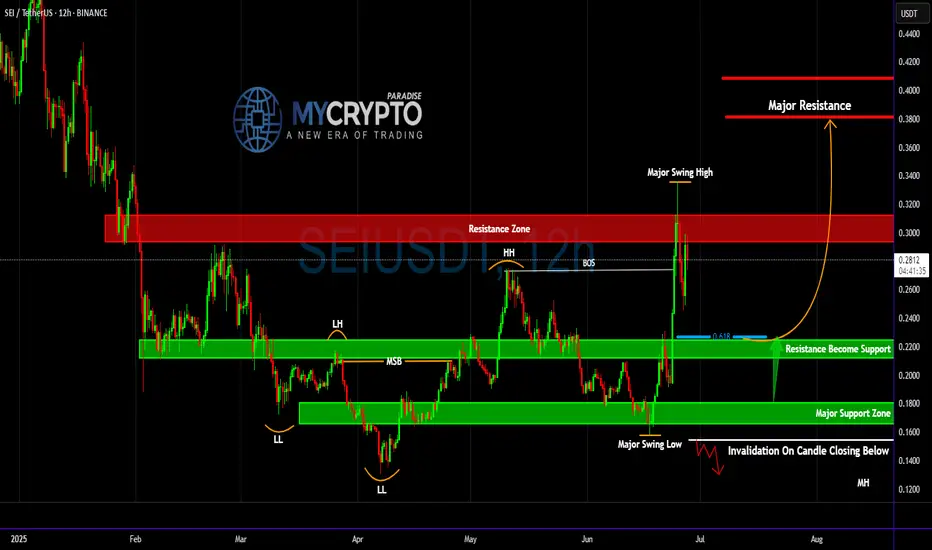
SEIUSDT on the Brink of a Major Explosion… or Total Breakdown?Yello Paradisers! Are you prepared to act with precision—or will you get trapped like the rest before the real move begins? #SEI has entered a highly reactive price zone where one wrong candle could invalidate the entire bullish structure. The market is whispering its next move, but only those who understand structure and timing will be ready to capitalize.
💎#SEIUSDT has completed a significant transition from a bearish trend structure to a more bullish one. Earlier, the price formed consecutive Lower Lows (LL) and Lower Highs (LH), confirming bearish momentum. However, that trend shifted once the market printed a Market Structure Break (MSB) around the 0.2121–0.2253 range. This area—previously acting as resistance—has now flipped into a confirmed support zone, marking a critical bullish development.
💎The structure strengthened further when SEI broke above the prior Higher High (HH) and created a Break of Structure (BOS). That move catapulted price into the red resistance zone between 0.2929 and 0.3152, just beneath the last major swing high at 0.3471. This zone is now acting as a ceiling, containing bullish pressure—but the underlying structure remains intact unless we see an invalidation close below key levels.
💎High probability, SEI i retracing back into the 0.618 Fibonacci level at 0.2269, which aligns precisely with the flipped support zone. This is a textbook bullish retest, and as long as the price holds above 0.2121, the probability for continuation remains high. The coming candles will be decisive: they will either confirm strength and fuel continuation—or fail and lead to a complete structure breakdown.
💎If buyers manage to hold the key support zone between 0.2269 and 0.2121, the probability of a bullish continuation increases significantly. The first major target on the upside is 0.3471, which marks the previous swing high and is likely to act as the initial area of resistance. A clean break above that level could open the path toward 0.3812, followed by 0.4086, both of which align with higher timeframe supply zones and represent strong historical resistance. These levels are expected to attract profit-taking and short-term volatility, making them critical decision points for continuation or rejection in the next phase of SEI’s move.
💎However, traders must be alert: any candle close below 0.1554 will serve as a hard invalidation level for this bullish thesis. If that happens, the structure flips bearish, and we would anticipate a deeper correction toward 0.1361 or even lower. That’s the line we are not willing to ignore—structure and discipline come first.
This is not the time to trade emotionally, Paradisers . Retail traders will act impulsively—either FOMOing at the highs or panic-selling at the lows. The smart move here is to observe how price reacts and only execute if there’s clear confirmation and structure support. No guessing. No gambling.
MyCryptoParadise
iFeel the success🌴