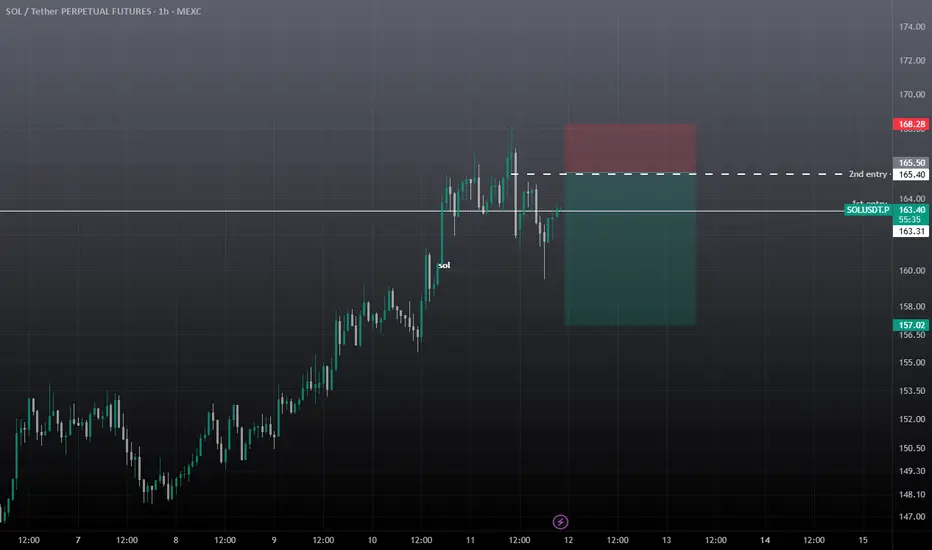
SOL Sell / Short SetupSell at cmp 163.49, 2nd entry mentioned and tp also mentioned, Must keep SL, best of luck.
Fibonacci
$AAPL: Breaking Down Broader Cycle via FibsPublishing separately a specific interconnection type mentioned in idea below:
Testing this particular way of mapping the multi-scale cycles:

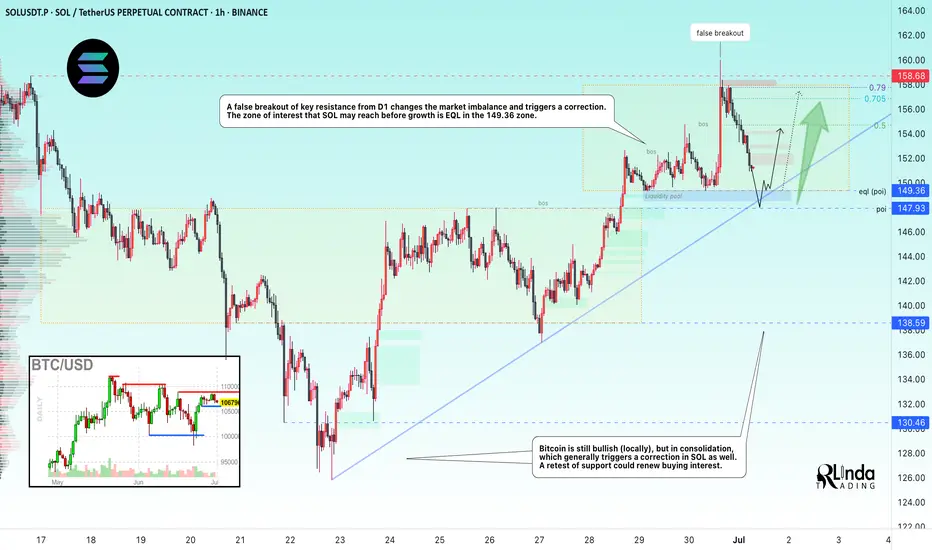
SOLUSDT → Countertrend correction and hunt for liquidityBINANCE:SOLUSDT looks quite promising on the bullish side. The price is testing one of the key resistance levels within the local trend rally. A correction is forming. Is it beneficial for us?
On the higher timeframe, we see a change in character, a breakout of the trend resistance, and the formation of an upward trend support line. Bitcoin is still bullish (locally) at this time, but it is consolidating, which generally provokes a correction in SOL as well. Focus on the 150-149 area. If the bulls are able to keep the price above this zone after the retest, followed by the formation of momentum, this can be considered a positive medium-term sign.
Locally, the price within the trading range of 149.36 - 158 is heading towards the area of interest and liquidity (eql) at 149.36. The current sell-off is most likely triggered by a large player seeking a more favorable entry into the market.
Resistance levels: 154.75, 156.8
Support levels: 149.36, 147.93
In the current situation, it makes the most sense to consider an intraday trading strategy. A countertrend correction and a retest of support could attract buyers...
Best regards, R. Linda!
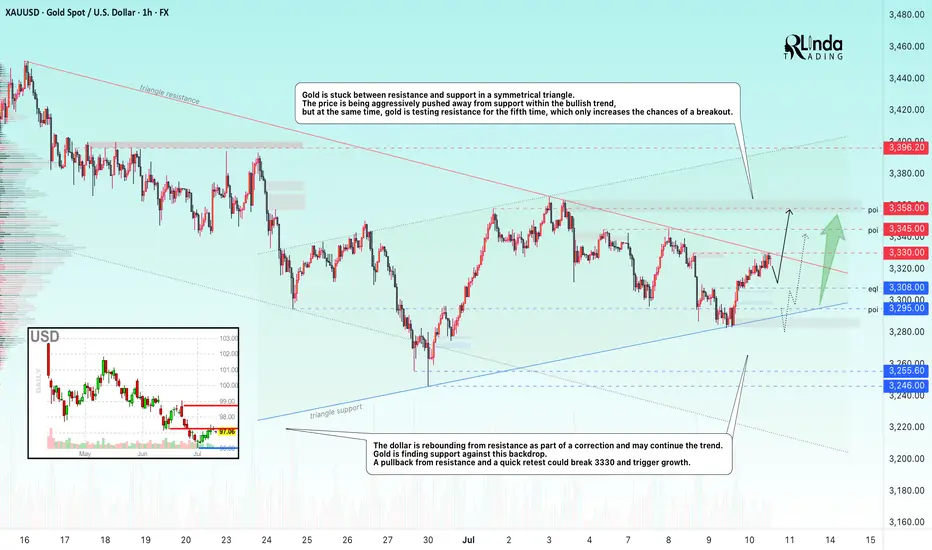
GOLD → Retest of consolidation resistance. Breakout?FX:XAUUSD is consolidating in a symmetrical triangle pattern. The price is stabilizing amid a falling dollar and uncertainty...
Gold is recovering after falling to $3,283 thanks to a weaker dollar and lower bond yields amid concerns over Trump's new tariff threats. The announced tariffs against seven countries, including Brazil and the Philippines, have heightened tensions, partially offsetting the Fed's hawkish signals. Markets are now awaiting new data from the US and speeches by Fed officials, which could influence the further dynamics of gold.
Technically, gold is squeezed between the resistance and support of a symmetrical triangle. The price is being aggressively pushed away from support within a bullish trend, but at the same time, gold is testing resistance for the fifth time, which only increases the chances of a breakout.
Resistance levels: 3330, 3345, 3358
Support levels: 3308, 3295
If gold continues to storm the local resistance at 3330 and the triangle resistance during consolidation, we will have a good chance of catching the breakout and growth. An additional scenario could be growth after a shake-up of the triangle support and the global trend.
Best regards, R. Linda!
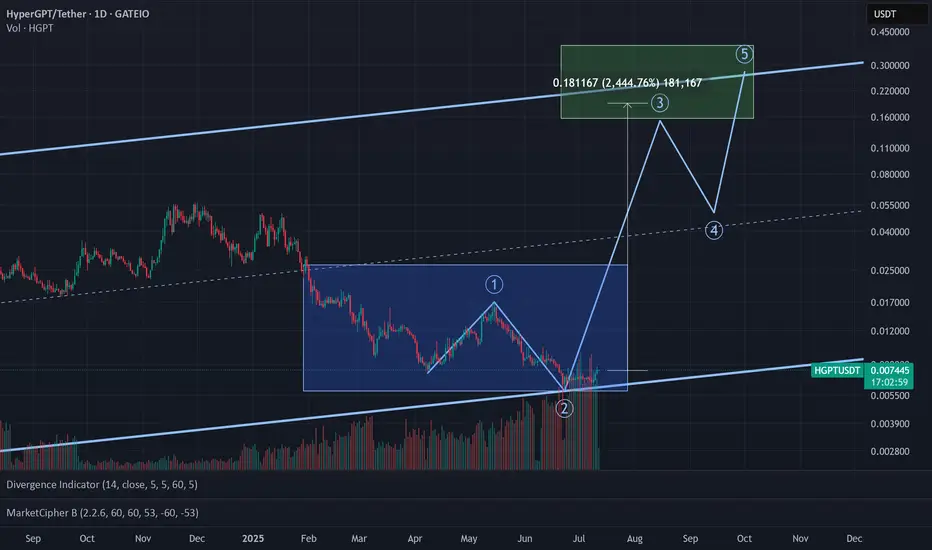
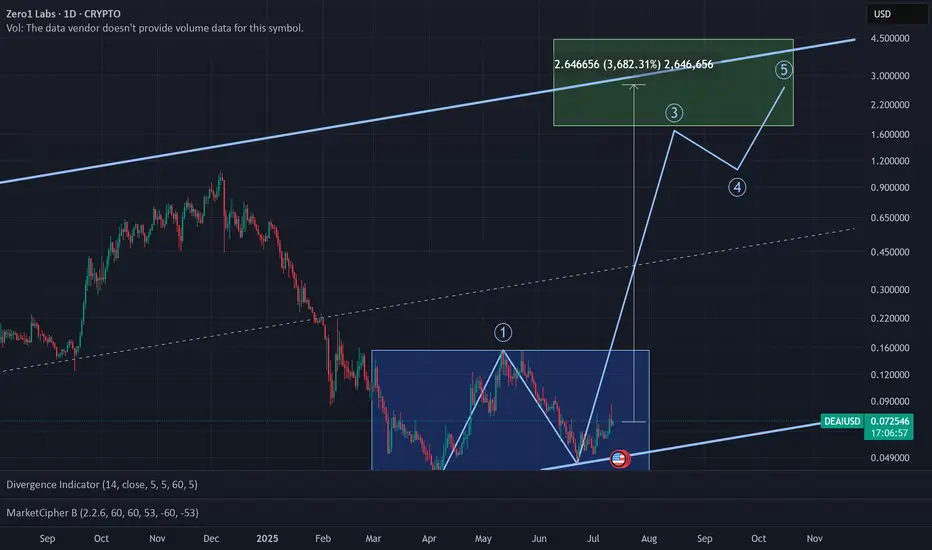
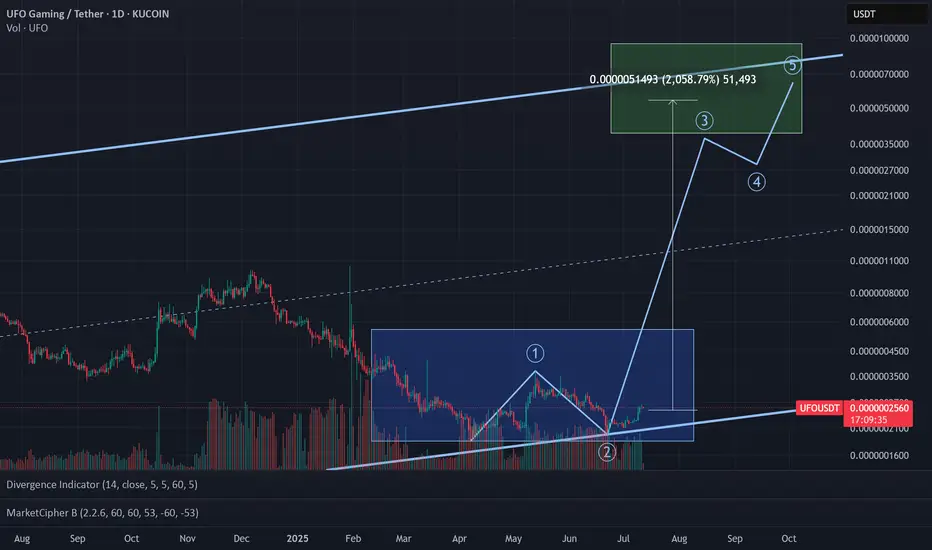
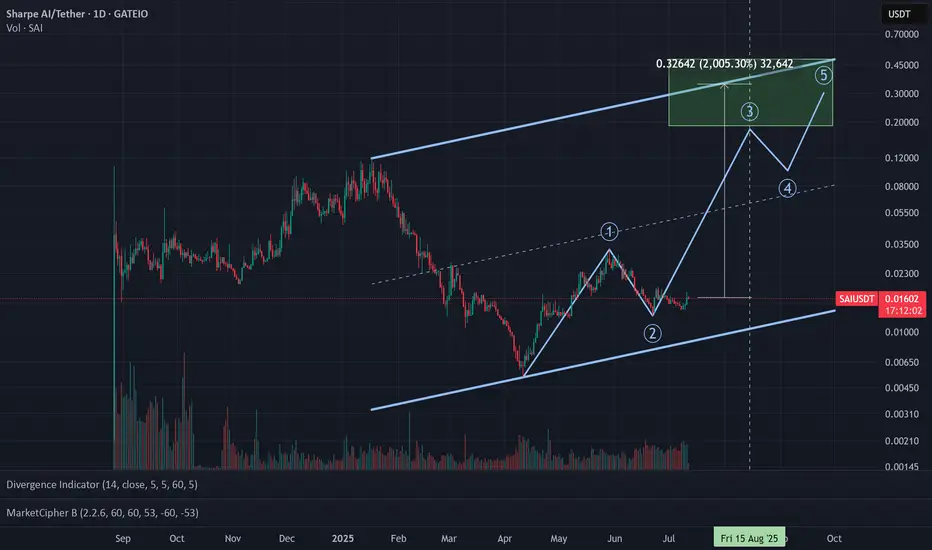
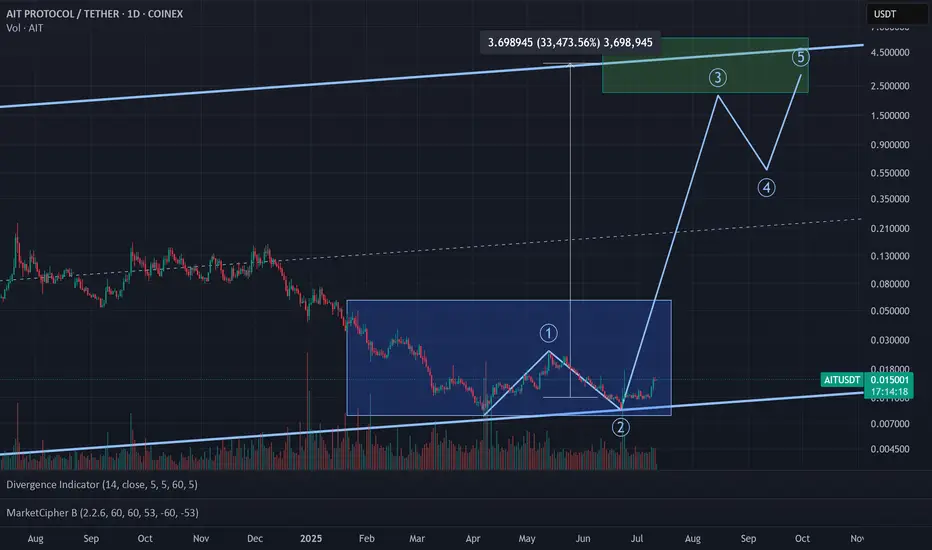
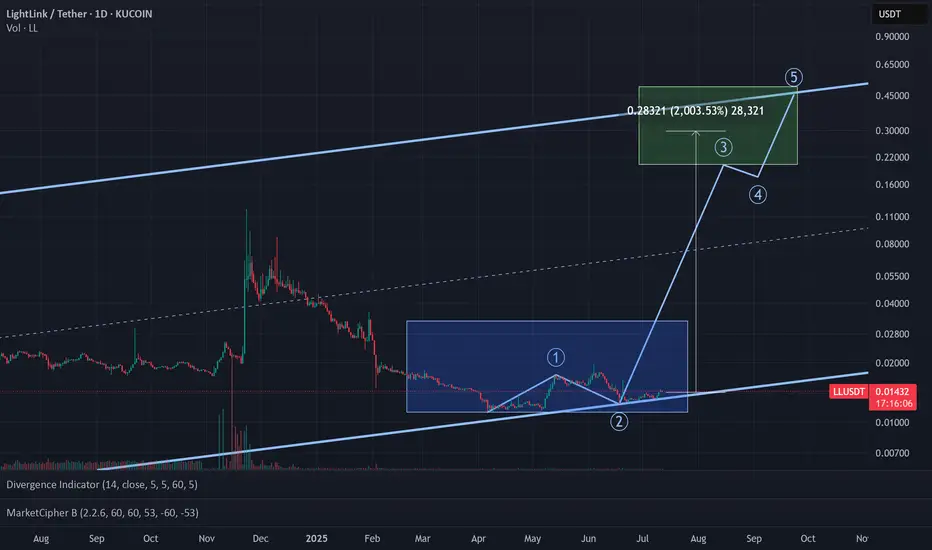
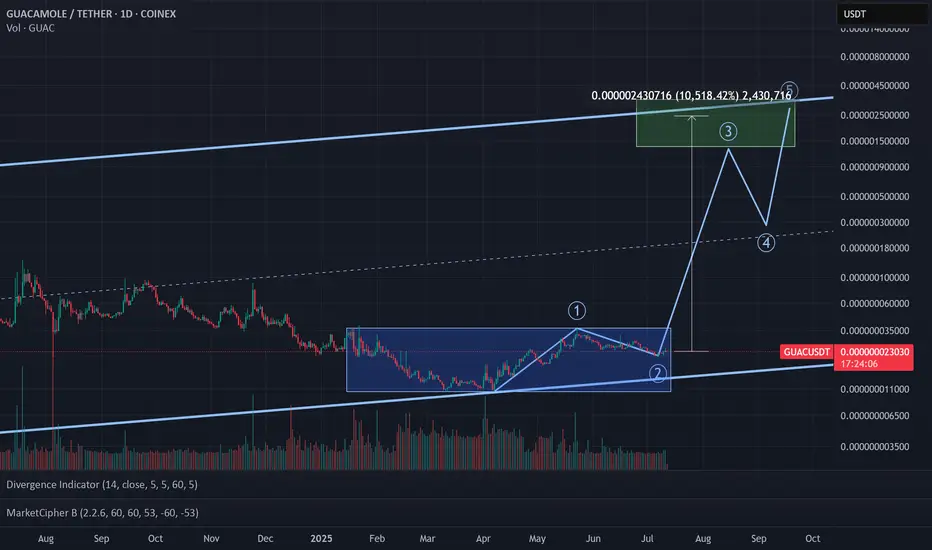
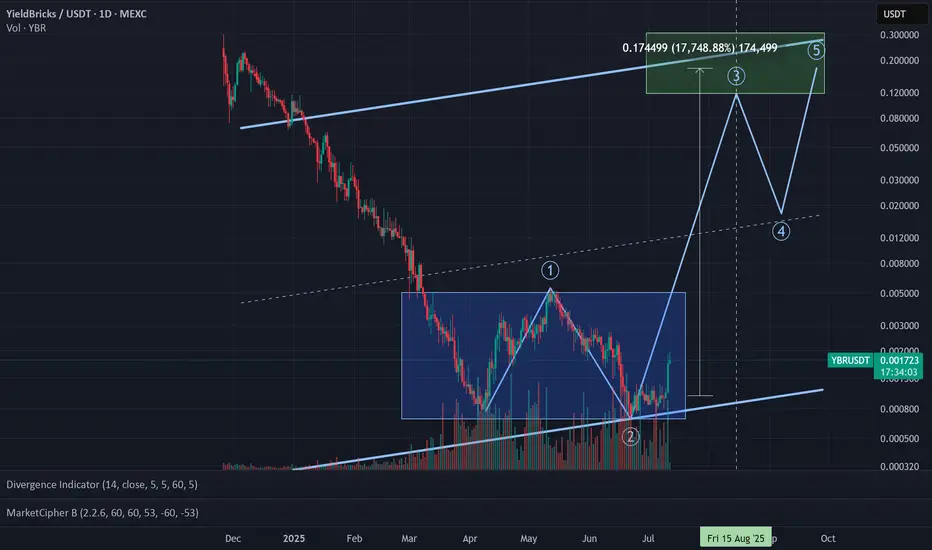
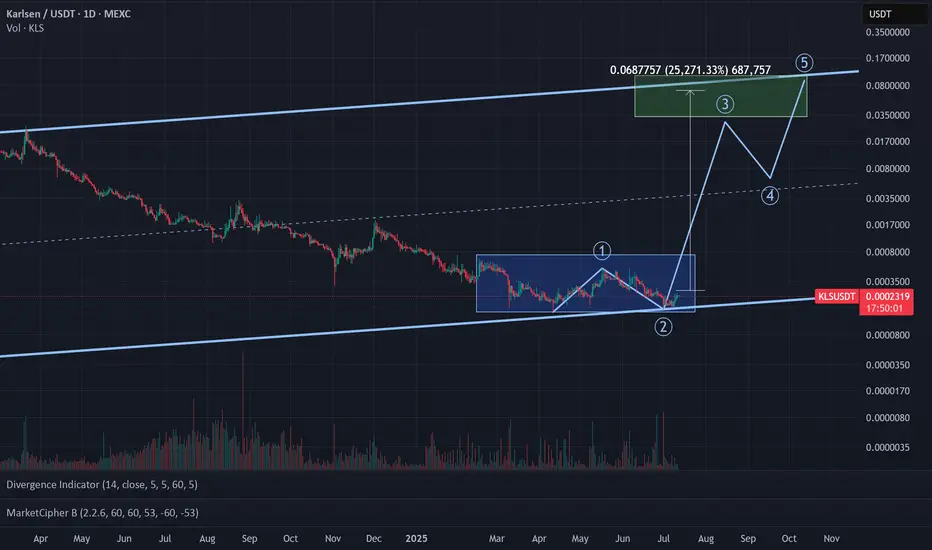
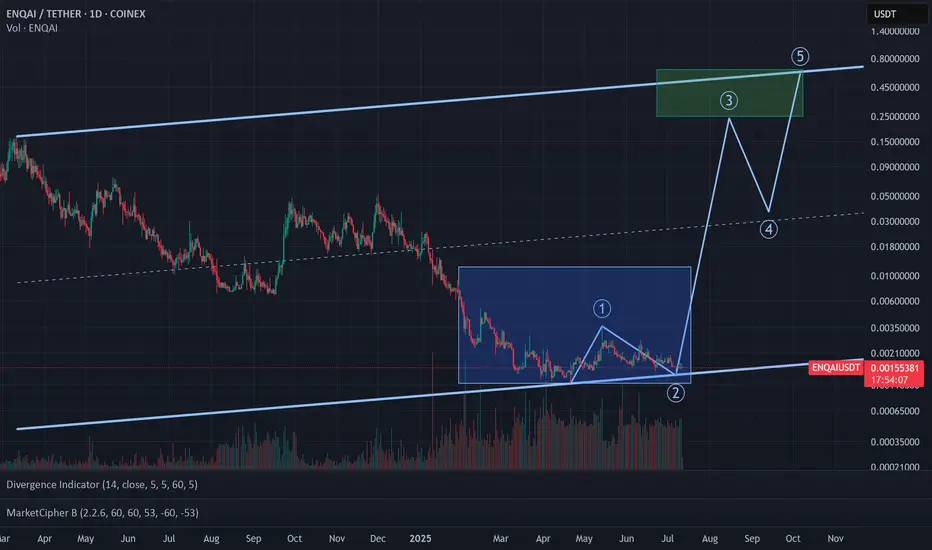
Altseason 2025 - Wave 3Bitcoin is approaching its next destination between $125K and $250K, and that means its time to shift focus to altcoins. We’re not in full-blown altseason yet, but the foundations are forming. BTC dominance needs to drop fast, that’s the key trigger. Once it does, the rotation into alts could accelerate quickly.
Favorites so far this cycle:
🥑 POLONIEX:GUACUSDT 🧱 MEXC:YBRUSDT ⛏️ MEXC:KLSUSDT
🌐 HTX:SYNTUSDT 🧪 MEXC:DEAIUSDT *⃣ MEXC:SAIUSDT
🔗 POLONIEX:LLUSDT 🎮 KUCOIN:MYRIAUSDT 🤖 COINEX:ENQAIUSDT
Altseason 2025 - Wave 3Bitcoin is approaching its next destination between $125K and $250K, and that means its time to shift focus to altcoins. We’re not in full-blown altseason yet, but the foundations are forming. BTC dominance needs to drop fast, that’s the key trigger. Once it does, the rotation into alts could accelerate quickly.
Favorites so far this cycle:
🥑 GUACUSDT 🧱 YBRUSDT ⛏️ KLSUSDT
🌐 SYNTUSDT 🧪 DEAIUSDT *⃣ SAIUSDT
🔗 LLUSDT 🎮 MYRIAUSDT 🤖 ENQAIUSDT
Altseason 2025 - Wave 3Bitcoin is approaching its next destination between $125K and $250K, and that means its time to shift focus to altcoins. We’re not in full-blown altseason yet, but the foundations are forming. BTC dominance needs to drop fast, that’s the key trigger. Once it does, the rotation into alts could accelerate quickly.
Favorites so far this cycle:
🥑 GUAC/USDT 🧱 YBR/USDT ⛏️ KLS/USDT
🌐 SYNT/USDT 🧪 DEAI/USDT *⃣ SAI/USDT
🔗 LL/USDT 🎮 MYRIA/USDT 🤖 ENQAI/USDT
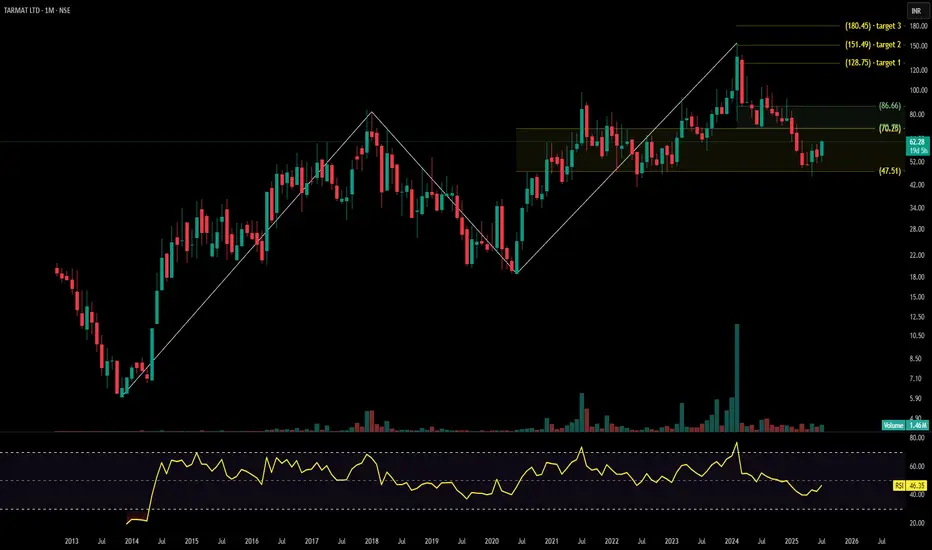
TARMAT LTDTarmat Ltd. is a mid-cap infrastructure development company specializing in engineering, procurement, and construction (EPC) of roads, highways, bridges, and airports. Operating across multiple Indian states, it works with government agencies and defense sector clients. The stock is currently trading at ₹62.28, showing signs of base formation with volume expansion and a well-defined Fibonacci breakout structure.
Tarmat Ltd. – FY22–FY25 Snapshot
Sales – ₹150 Cr → ₹178 Cr → ₹195 Cr → ₹215 Cr – Gradual revenue growth with stable order execution
Net Profit – ₹6.2 Cr → ₹7.5 Cr → ₹9.0 Cr → ₹10.6 Cr – Margin visibility improving with better project mix Company Order Book – Moderate → Moderate → Strong → Strong – Increasing inflow from central and state contracts Dividend Yield (%) – 0.00% → 0.00% → 0.00% → 0.00% – No payouts, reinvestment-focused approach
Operating Performance – Weak → Moderate → Moderate → Moderate – Cost efficiency gains visible
Equity Capital – ₹15.52 Cr (constant) – Stable ownership structure
Total Debt – ₹42 Cr → ₹40 Cr → ₹37 Cr → ₹34 Cr – Deleveraging in progress Total Liabilities – ₹89 Cr → ₹96 Cr → ₹103 Cr → ₹109 Cr – Aligned with order book expansion
Fixed Assets – ₹33 Cr → ₹35 Cr → ₹38 Cr → ₹41 Cr – Controlled capex, capacity-based investments
Latest Highlights FY25 net profit rose 17.7% YoY to ₹10.6 Cr; revenue increased 10.3% to ₹215 Cr EPS: ₹6.83 | EBITDA Margin: 14.6% | Net Margin: 4.93% Return on Equity: 13.52% | Return on Assets: 7.64% Promoter holding: 55.18% | Dividend Yield: 0.00% Recent order wins in Maharashtra, Karnataka, and airport runway expansion projects Improved cost controls and execution pace supporting profit momentum
Institutional Interest & Ownership Trends Promoter holding has remained stable at 55.18%, showing confidence in long-term strategy. Institutional interest is picking up post Q4 FY25 results, with DIIs adding 0.8% stake in April 2025. No signs of dilution or pledging activity observed. Overall ownership structure remains lean, and recent delivery volumes suggest selective accumulation by mid-cap trackers.
Business Growth Verdict Yes, Tarmat is showing promising signs of infrastructure-driven growth Margins and asset turnover improving steadily Debt profile is conservative and manageable Capex strategy is paced with execution capabilities
Company Guidance Management expects moderate revenue growth in FY26 with stable margins, supported by a healthy project pipeline. No major capex planned beyond routine equipment upgrades.
Final Investment Verdict Tarmat Ltd. offers a value-focused opportunity in India’s infra build-out cycle. The company’s small but stable base, growing order book, and improving margins suggest credible bottom-line visibility. While topline growth remains moderate and dividend payouts are absent, the low equity dilution, rising contract inflow, and renewed institutional interest make it an attractive candidate for staggered accumulation by investors seeking infra exposure in the mid-cap segment.
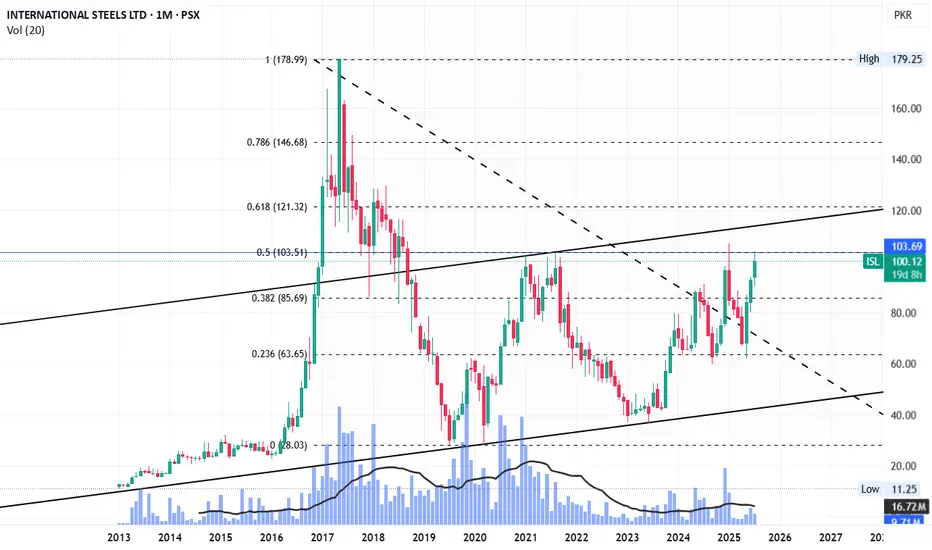
ISL LongCurrently Fib 0.5 of its all-time high and its last peak - both are showing resistance.
Once it breaks the level, the trendline will act as resistance (~114).
After that it may speed-up towards its next targets of 121, 146 and previous all-time high.
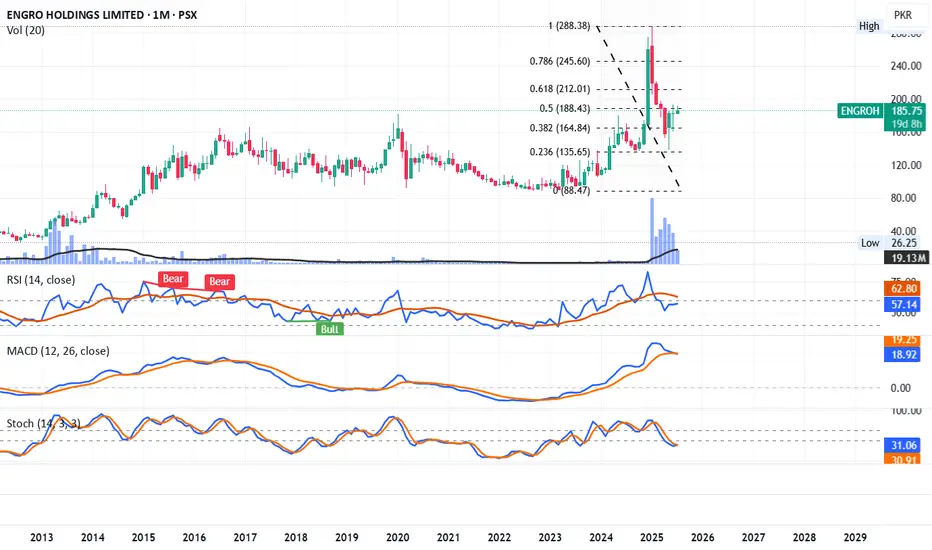
EngroH Bounce expectedEngroH is going to form an M pattern for which it has to take a bounce and then will fall back.
Bounce can be expected to Fib-0.618 (212) or Fib-0.786 level (245).
RSI and Stoch are in recovery phase. MACD still bearish.
Playing on levels should be prioritized with trailing stoploss once it reaches 212.
Exit should be planned near 245. Staying long can be fatal.
This is my personal opinion, not a buy / sell call.
Gold Potential UpsidesHey Traders, in today's trading session we are monitoring XAUUSD for a buying opportunity around 3,330 zone, Gold is trading in an uptrend and currently is in a correction phase in which it is approaching the trend at 3,330 support and resistance area.
Trade safe, Joe.

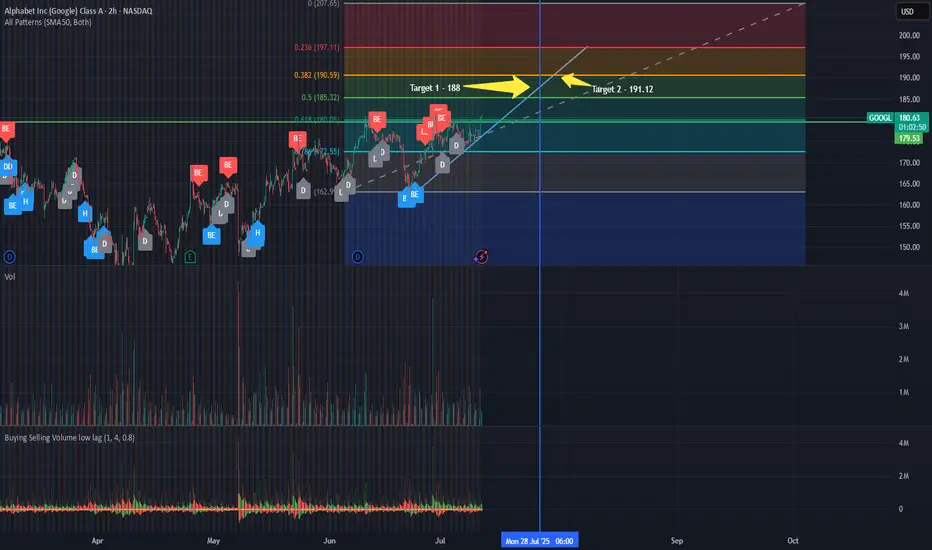
GOOGL Short Term Trading IdeaEntered at $173.55 on 07/08.
Expecting earnings to be reported on 07/23 and beat expectations by a huge margin.
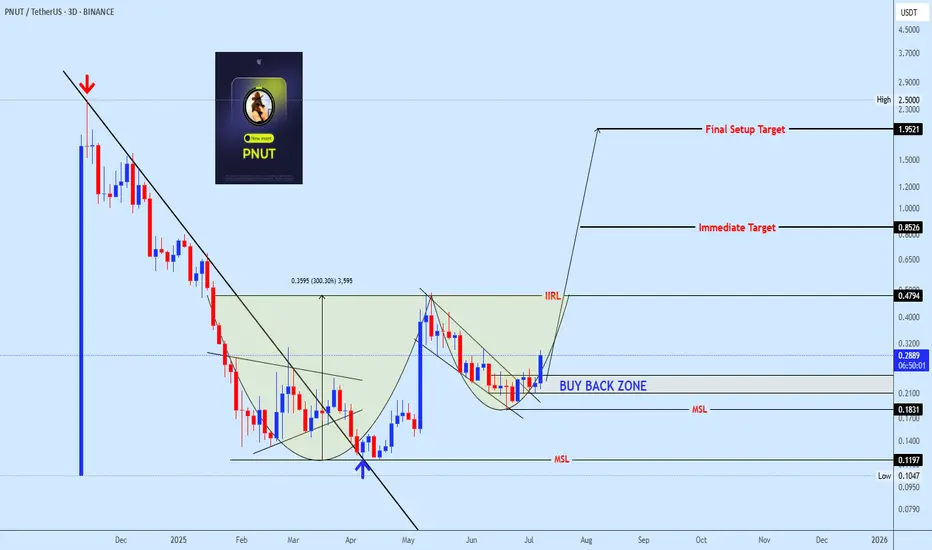
Pnutusdt buy opprotunityPNUTUSDT is showing a well defined bottoming structure, completing a rounded reversal formation. Price is currently building momentum within the buy-back zone, supported by a successful break of the mid-structure line (MSL). Continuation above the IIRL neckline could trigger the next impulsive leg toward the immediate target at 0.8526, with the final setup target projected at 1.9521. Holding above 0.1831 is critical for maintaining bullish structure.
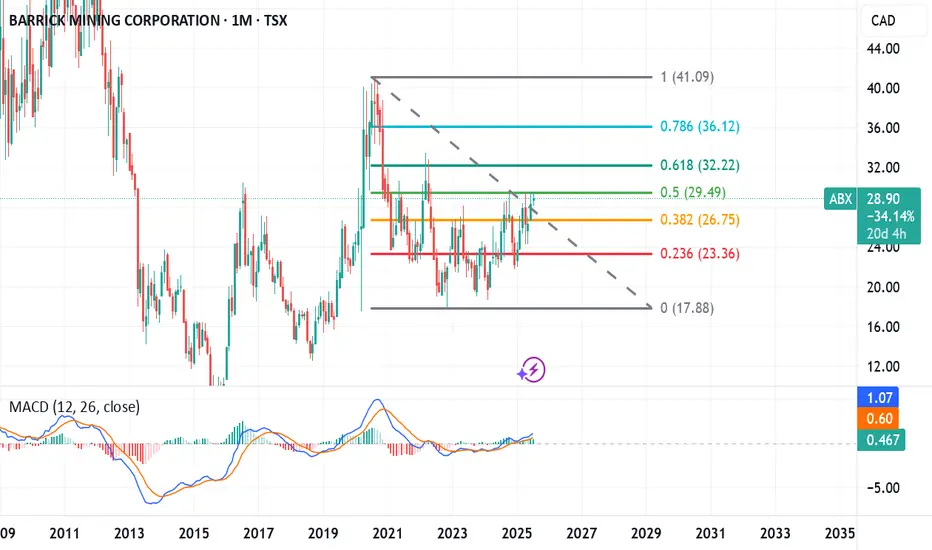
barrick, run it hotfiscal dominance adding downward pressure on dollar. long term chart look favourable with key fib levels being touched. added copper exposure in usa, abx has some legs
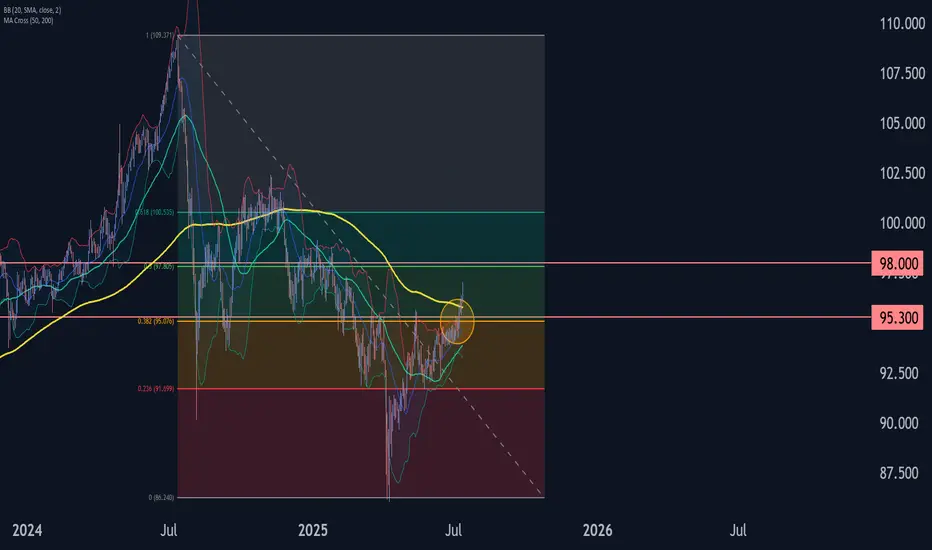
AUDJPY Wave Analysis – 11 July 2025
- AUDJPY broke resistance zone
- Likely to rise to resistance level 98.00
AUDJPY currency pair recently broke the resistance zone between the resistance level 95.30 (which has been reversing the price from March) and the 38.2% Fibonacci correction of the downward impulse from July.
The breakout of this resistance zone continues the active impulse wave 3, which belongs to the intermediate impulse wave (C) from May.
Given the strongly bearish yen sentiment seen across the FX markets today, AUDJPY currency pair can be expected to rise to the next resistance level 98.00 (target price for the completion of wave 5).
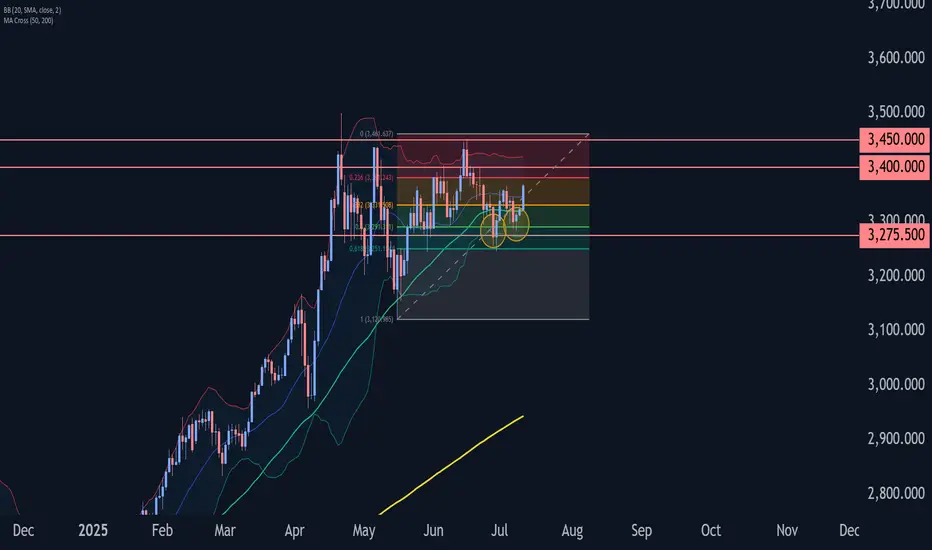
Gold Wave Analysis – 11 July 2025- Gold reversed from support zone
- Likely to rise to resistance levels 3400.00 and 3450.00
Gold recently reversed up from the support zone between the strong support level 3275.50 (which has been reversing the price from May), lower daily Bollinger Band and the 50% Fibonacci correction of the upward impulse 1 from May.
The upward reversal from this support zone continues the active impulse wave 3 of the intermediate impulse wave (5) from May.
Given the clear daily uptrend, Gold can be expected to rise to the next resistance levels 3400.00 and 3450.00.