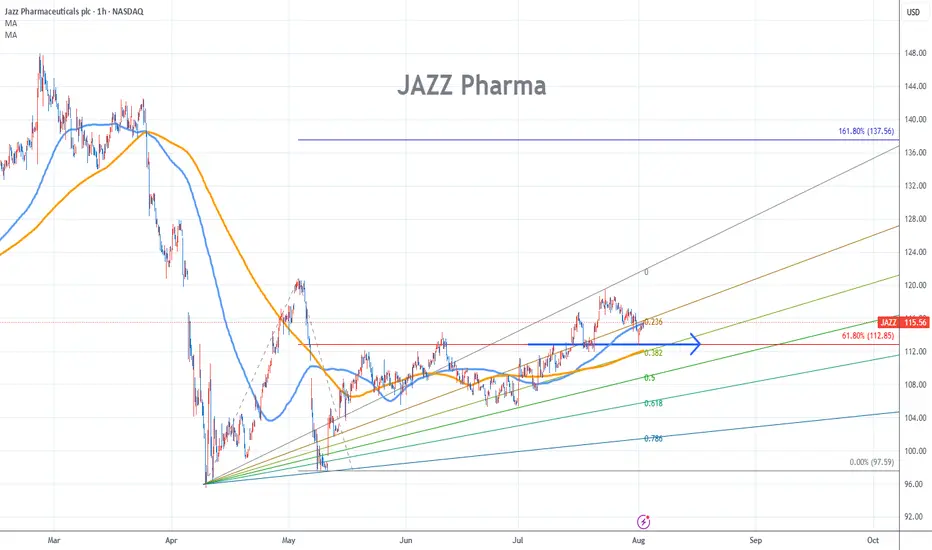
Jazz Pharma Stock Chart Fibonacci Analysis 080125Trading Idea
1) Find a FIBO slingshot
2) Check FIBO 61.80% level
3) Entry Point > 112/61.80%
Chart time frame:B
A) 15 min(1W-3M)
B) 1 hr(3M-6M)
C) 4 hr(6M-1year)
D) 1 day(1-3years)
Stock progress:C
A) Keep rising over 61.80% resistance
B) 61.80% resistance
C) 61.80% support
D) Hit the bottom
E) Hit the top
Stocks rise as they rise from support and fall from resistance. Our goal is to find a low support point and enter. It can be referred to as buying at the pullback point. The pullback point can be found with a Fibonacci extension of 61.80%. This is a step to find entry level. 1) Find a triangle (Fibonacci Speed Fan Line) that connects the high (resistance) and low (support) points of the stock in progress, where it is continuously expressed as a Slingshot, 2) and create a Fibonacci extension level for the first rising wave from the start point of slingshot pattern.
When the current price goes over 61.80% level , that can be a good entry point, especially if the SMA 100 and 200 curves are gathered together at 61.80%, it is a very good entry point.
As a great help, tradingview provides these Fibonacci speed fan lines and extension levels with ease. So if you use the Fibonacci fan line, the extension level, and the SMA 100/200 curve well, you can find an entry point for the stock market. At least you have to enter at this low point to avoid trading failure, and if you are skilled at entering this low point, with fibonacci6180 technique, your reading skill to chart will be greatly improved.
If you want to do day trading, please set the time frame to 5 minutes or 15 minutes, and you will see many of the low point of rising stocks.
If want to prefer long term range trading, you can set the time frame to 1 hr or 1 day.
Fibonacci
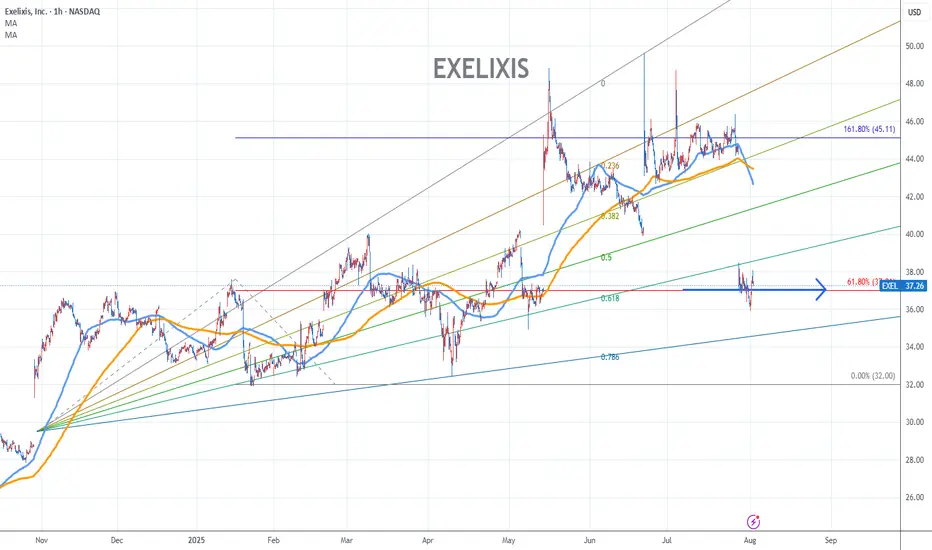
Exelixis Stock Chart Fibonacci Analysis 080125Exelixis Stock Chart Fibonacci Analysis 080125
Trading idea - Entry point > 37/61.80%
Trading Idea
1) Find a FIBO slingshot
2) Check FIBO 61.80% level
3) Entry Point > 37/61.80%
Chart time frame:B
A) 15 min(1W-3M)
B) 1 hr(3M-6M)
C) 4 hr(6M-1year)
D) 1 day(1-3years)
Stock progress:A
A) Keep rising over 61.80% resistance
B) 61.80% resistance
C) 61.80% support
D) Hit the bottom
E) Hit the top
Stocks rise as they rise from support and fall from resistance. Our goal is to find a low support point and enter. It can be referred to as buying at the pullback point. The pullback point can be found with a Fibonacci extension of 61.80%. This is a step to find entry level. 1) Find a triangle (Fibonacci Speed Fan Line) that connects the high (resistance) and low (support) points of the stock in progress, where it is continuously expressed as a Slingshot, 2) and create a Fibonacci extension level for the first rising wave from the start point of slingshot pattern.
When the current price goes over 61.80% level , that can be a good entry point, especially if the SMA 100 and 200 curves are gathered together at 61.80%, it is a very good entry point.
As a great help, tradingview provides these Fibonacci speed fan lines and extension levels with ease. So if you use the Fibonacci fan line, the extension level, and the SMA 100/200 curve well, you can find an entry point for the stock market. At least you have to enter at this low point to avoid trading failure, and if you are skilled at entering this low point, with fibonacci6180 technique, your reading skill to chart will be greatly improved.
If you want to do day trading, please set the time frame to 5 minutes or 15 minutes, and you will see many of the low point of rising stocks.
If want to prefer long term range trading, you can set the time frame to 1 hr or 1 day.
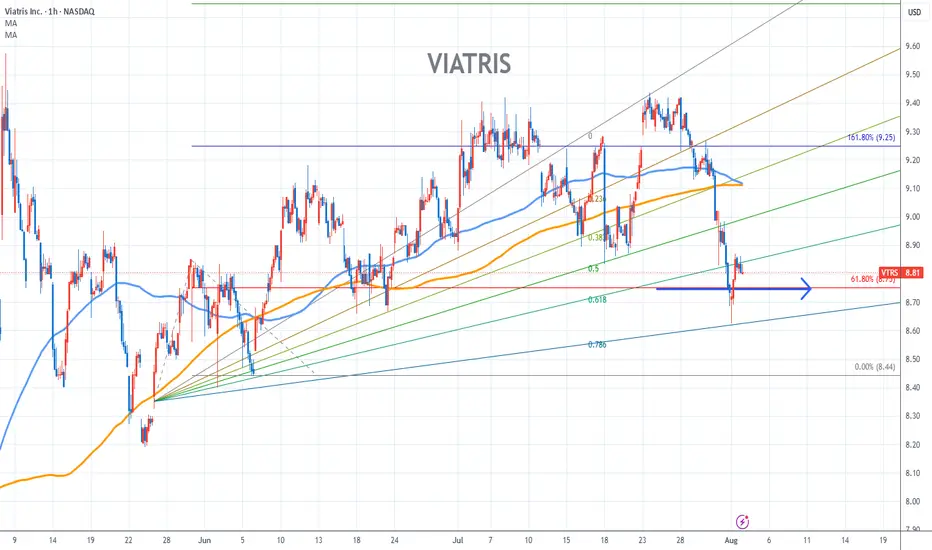
Viatris Stock Chart Fibonacci Analysis 080125Trading Idea
1) Find a FIBO slingshot
2) Check FIBO 61.80% level
3) Entry Point > 8.8/61.80%
Chart time frame:B
A) 15 min(1W-3M)
B) 1 hr(3M-6M)
C) 4 hr(6M-1year)
D) 1 day(1-3years)
Stock progress:A
A) Keep rising over 61.80% resistance
B) 61.80% resistance
C) 61.80% support
D) Hit the bottom
E) Hit the top
Stocks rise as they rise from support and fall from resistance. Our goal is to find a low support point and enter. It can be referred to as buying at the pullback point. The pullback point can be found with a Fibonacci extension of 61.80%. This is a step to find entry level. 1) Find a triangle (Fibonacci Speed Fan Line) that connects the high (resistance) and low (support) points of the stock in progress, where it is continuously expressed as a Slingshot, 2) and create a Fibonacci extension level for the first rising wave from the start point of slingshot pattern.
When the current price goes over 61.80% level , that can be a good entry point, especially if the SMA 100 and 200 curves are gathered together at 61.80%, it is a very good entry point.
As a great help, tradingview provides these Fibonacci speed fan lines and extension levels with ease. So if you use the Fibonacci fan line, the extension level, and the SMA 100/200 curve well, you can find an entry point for the stock market. At least you have to enter at this low point to avoid trading failure, and if you are skilled at entering this low point, with fibonacci6180 technique, your reading skill to chart will be greatly improved.
If you want to do day trading, please set the time frame to 5 minutes or 15 minutes, and you will see many of the low point of rising stocks.
If want to prefer long term range trading, you can set the time frame to 1 hr or 1 day.
Essential Utilities Stock Chart Fibonacci Analysis 080125Trading Idea
1) Find a FIBO slingshot
2) Check FIBO 61.80% level
3) Entry Point > 38/61.80%
Chart time frame:D
A) 15 min(1W-3M)
B) 1 hr(3M-6M)
C) 4 hr(6M-1year)
D) 1 day(1-3years)
Stock progress:A
A) Keep rising over 61.80% resistance
B) 61.80% resistance
C) 61.80% support
D) Hit the bottom
E) Hit the top
Stocks rise as they rise from support and fall from resistance. Our goal is to find a low support point and enter. It can be referred to as buying at the pullback point. The pullback point can be found with a Fibonacci extension of 61.80%. This is a step to find entry level. 1) Find a triangle (Fibonacci Speed Fan Line) that connects the high (resistance) and low (support) points of the stock in progress, where it is continuously expressed as a Slingshot, 2) and create a Fibonacci extension level for the first rising wave from the start point of slingshot pattern.
When the current price goes over 61.80% level , that can be a good entry point, especially if the SMA 100 and 200 curves are gathered together at 61.80%, it is a very good entry point.
As a great help, tradingview provides these Fibonacci speed fan lines and extension levels with ease. So if you use the Fibonacci fan line, the extension level, and the SMA 100/200 curve well, you can find an entry point for the stock market. At least you have to enter at this low point to avoid trading failure, and if you are skilled at entering this low point, with fibonacci6180 technique, your reading skill to chart will be greatly improved.
If you want to do day trading, please set the time frame to 5 minutes or 15 minutes, and you will see many of the low point of rising stocks.
If want to prefer long term range trading, you can set the time frame to 1 hr or 1 day.
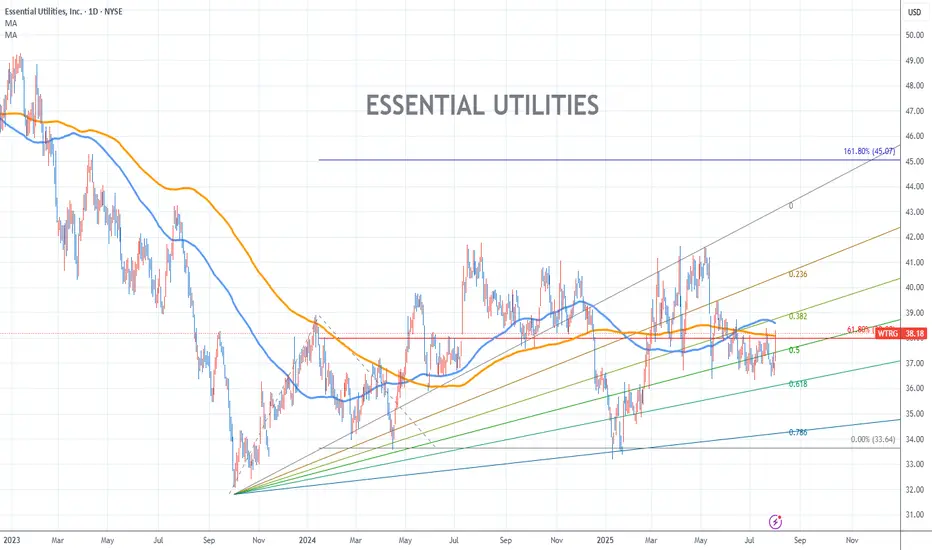
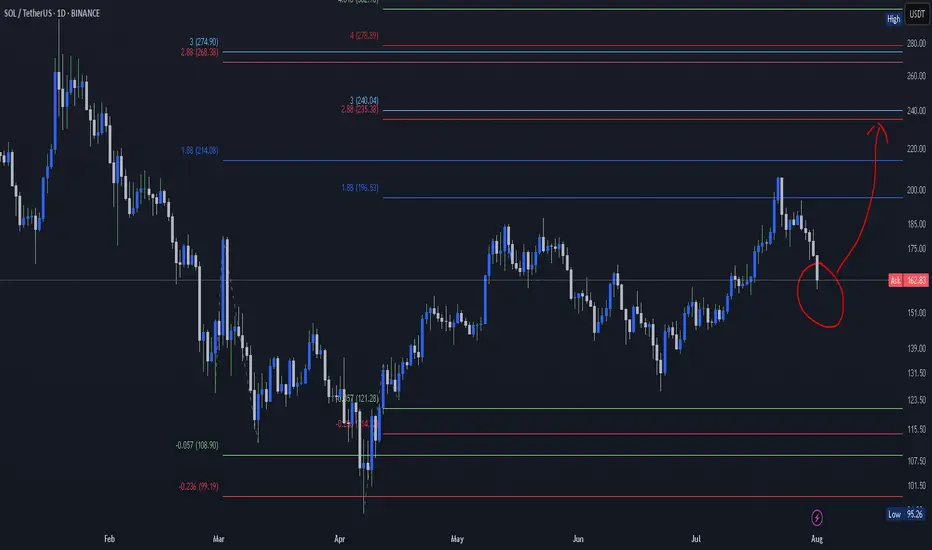
Chart Overview (SOL/USDT – 1D, Binance)Key Insights:
Support Zone: Around $160–165, aligning with Ichimoku support lines.
Fibonacci Levels: Price broke above the 1.618 level (~$175) and is now retesting.
Indicators Below: Showing a strong bullish crossover, supporting upward momentum.
Target Path: Drawn to reach $223, then $240–260 if bullish trend continues.
📈 Bullish Scenario:
Bounce from $160–165 zone
-Short-term target: $195–200
-Mid-term target: $223
-Long-term: $240–260
📉 Bearish Scenario:
If $160 support breaks:
Next support levels: $145, then $122
Worst-case retest: $95
✅ Conclusion:
Crucial zone now: Either a strong bounce or a bearish breakdown.
Current indicators and structure favor a bullish continuation if support holds.
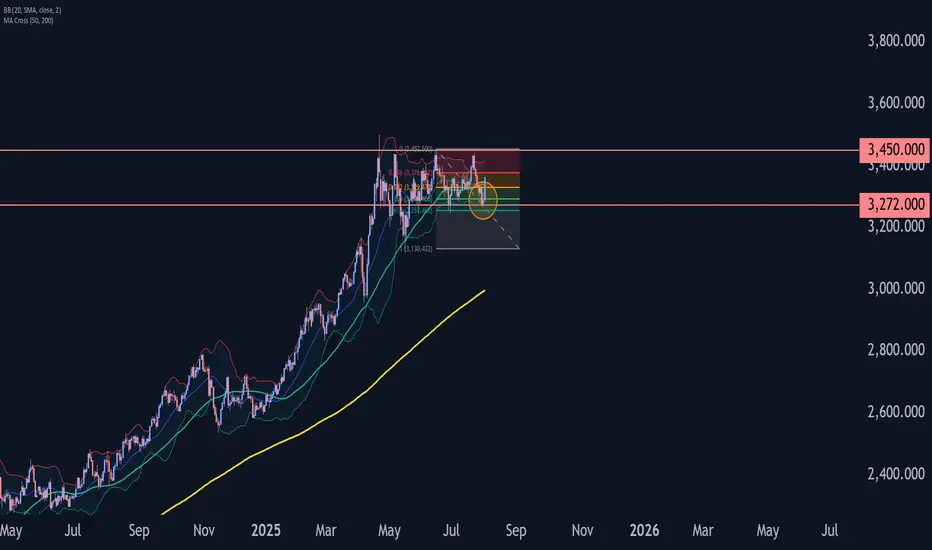
Gold Wave Analysis – 1 August 2025
- Gold reversed from the support zone
- Likely to rise to the resistance level at 3450.00
Gold today reversed from the support zone between the support level 3272.00 (which has been reversing the price from the end of May), lower daily Bollinger Band and the 50% Fibonacci correction of the upward wave B from May.
The upward reversal from this support zone created the daily Japanese candlesticks reversal pattern, Morning Star.
Given the clear daily uptrend and the oversold daily Stochastic, Gold can be expected to rise to the next resistance level at 3450.00 (top of waves B and ii).
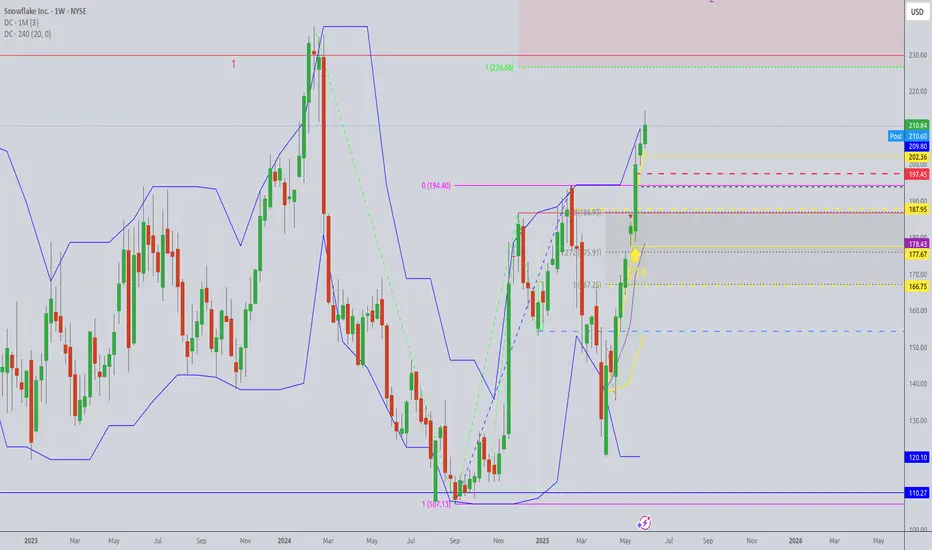
Put a lid on what smells badWe are within a resistance range that is as old as 5 years. It has been confirmed impressively in February 2024 again. Perhaps we will test these high again within the next weeks. But I oubt that we may decisive exceed the 230-240 level as this resistance is very strong and even stronger due to the 2024 Fibonacci extension.
The top on Wednesday could no be overcome. This means to me that we are in a decisive zone now with a possible correction attempt towards the open window of mid May.
Another upward attempt may be followed then.
Reddit breaks out for bullish run I have been watching Reddit for a couple of weeks and identified that we had put in the .786 low from the correction since February and then formed a range that was well respected for the past 4 months .
In this video I highlight zones where i expect price to gravitate too and where a nice entry will be if you are looking to long reddit.
Tools used Fib suite , trend based fib , tr pocket , 0.786 + 0.382 and fixed range .

USD/JPYThis is a trade setup for USD/JPY, based on volume and trend analysis.
Entry Price: 150.360
Stop-Loss (SL): 150.740
Take-Profit (TP): 149.963
The trade is intended to be executed instantly at the mentioned price, in alignment with both volume behavior and the current trend direction.
Disclaimer: This setup is shared purely for backtesting purposes and to document trade ideas. It is not financial advice. Always perform your own analysis before making any trading decisions.

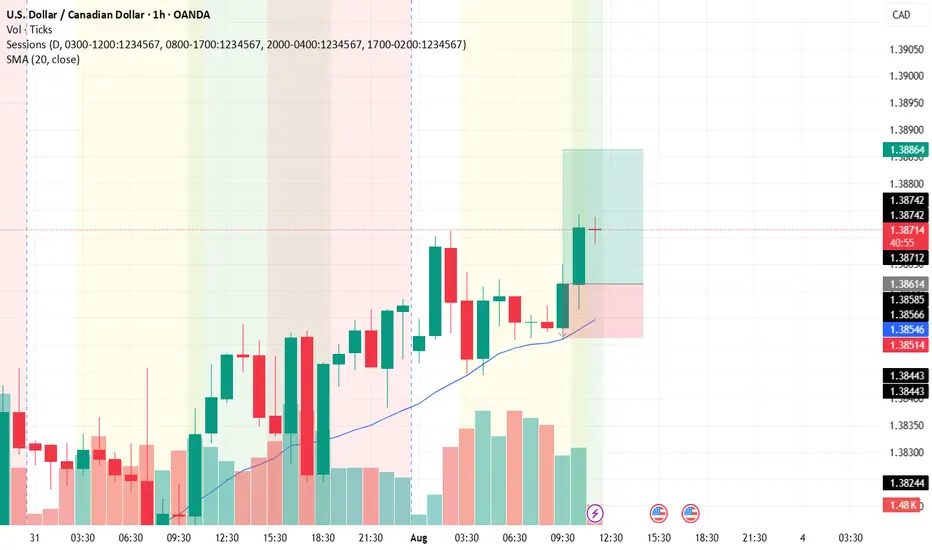
USD/CADThis is a trade setup for USD/CAD, based on volume and trend analysis.
Entry Price: 1.38614
Stop-Loss (SL): 1.38514
Take-Profit (TP): 1.38864
The trade is intended to be executed instantly at the mentioned price, in alignment with both volume behavior and the current trend direction.
Disclaimer: This setup is shared purely for backtesting purposes and to document trade ideas. It is not financial advice. Always perform your own analysis before making any trading decisions.
NZD/USDThis is a trade setup for NZD/USD, based on volume and trend analysis.
Entry Price: 0.58742
Stop-Loss (SL): 0.58892
Take-Profit (TP): 0.58582
The trade is intended to be executed instantly at the mentioned price, in alignment with both volume behavior and the current trend direction.
Disclaimer: This setup is shared purely for backtesting purposes and to document trade ideas. It is not financial advice. Always perform your own analysis before making any trading decisions.

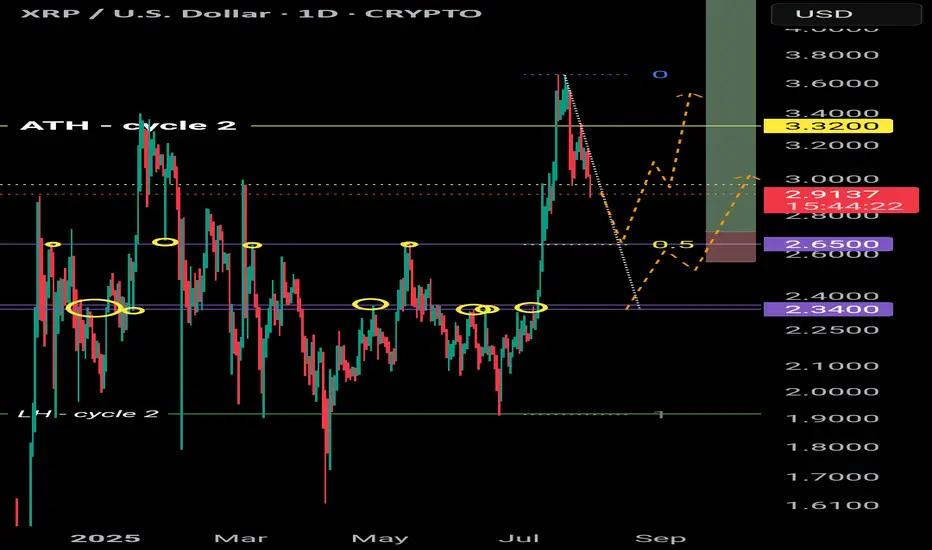
XRP retracement levelsWhere is XRP next likely to head next?
$2.65 is the next price level down with 4 points of contact. This level was also a weekly high as well as the 0.5 fibbonachi.
Next level down is $2.34 with 6 points of contact.
There is a downtrend forming so a breakout of this trend could be bullish for XRP 📈
renderwithme ||| XAU/USD Monthly Analysis (August 2025 Outlook) #Fundamental Analysis
Gold prices are influenced by macroeconomic factors, monetary policy, and geopolitical events. Based on recent data:Federal Reserve Policy: The Fed’s decision to maintain interest rates at 4.25–4.50% in July 2025, with a hawkish tilt, has strengthened the US dollar, putting downward pressure on gold. A stronger USD typically reduces gold’s appeal as it’s priced in dollars. However, expectations of a potential rate cut in September could support gold if signaled by Fed Chair Jerome Powell. Watch for updates in the FOMC statement or Powell’s comments for clues on future policy.
#Economic Indicators:
Strong US economic data, such as a robust labor market (jobless claims at a 3-month low) and rising consumer confidence (Conference Board’s Index at 97.2 in July), suggest increased economic activity, which could bolster the USD and limit gold’s upside. Upcoming data like the US PCE Price Index and Nonfarm Payrolls (NFP) in early August will be critical for gauging inflation and labor market trends, impacting gold’s trajectory.
Geopolitical and Safe-Haven Demand: Reduced safe-haven demand due to de-escalating global trade tensions and geopolitical stability has capped gold’s gains. However, any escalation in conflicts (e.g., Russia-Ukraine or Middle East) or renewed trade disputes could drive demand for gold as a safe-haven asset.
Central Bank Demand: Continued central bank gold purchases could provide long-term support, but a slowdown in buying might weigh on prices.
# Inflation and Currency Dynamics:
Persistent US inflation supports the USD, limiting gold’s attractiveness. Conversely, a recovering Chinese economy or global policy easing could boost gold demand.
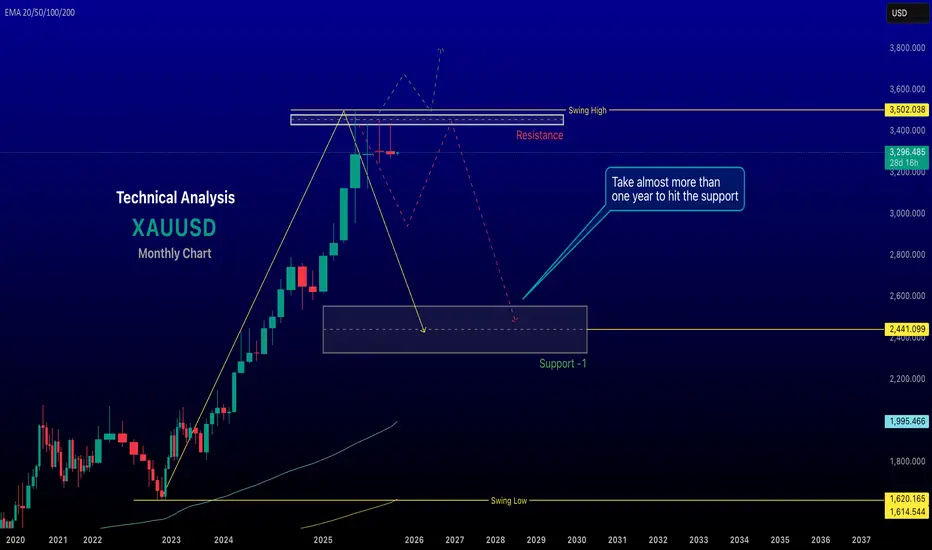
#Technical Analysis
Recent technical data suggests a mixed outlook for XAU/USD on the monthly timeframe:Price Levels and Trends: As of late July 2025, XAU/USD is trading around $3,291–$3,337, consolidating after retreating from a high of $3,440. The monthly chart shows a medium-term uptrend channel that began in early 2025, with support around $3,285–$3,300 and resistance at $3,355–$3,430. A decisive break above $3,355 could signal bullish momentum toward $3,500 or higher, while a break below $3,285 might target $3,130 or lower.
Indicators: The 14-day RSI at 46.10 suggests neutral momentum, neither overbought nor oversold. Technical indicators show mixed signals, with 15 bearish and 11 bullish signals as of July 28, 2025, reinforcing a cautious outlook.
Key Levels: Support: $3,275–$3,225 (major demand zone), $3,130 (potential deeper pullback).
Resistance: $3,355, $3,430, $3,500 (psychological level).
A bearish descending channel on shorter timeframes (e.g., 1H, 3H) suggests potential downside unless $3,320 is breached.
Monthly ForecastBearish Scenario: If the USD remains strong due to hawkish Fed signals, persistent inflation, or robust US economic data, XAU/USD could test support at $3,275–$3,225. A break below this zone might lead to $3,130 or even $2,900 in a deeper correction, especially if safe-haven demand weakens further.
Bullish Scenario: A Fed signal of rate cuts, renewed geopolitical tensions, or increased central bank buying could push gold above $3,355, targeting $3,430 or $3,500. A breakout above $3,430 could aim for $3,830, as suggested by some analysts.
Expected Range: For August 2025, XAU/USD is likely to trade between $3,225 and $3,430, with volatility driven by US economic data and Fed policy updates. A monthly close above $3,430 would strengthen the bullish case, while a close below $3,225 would favor bears.
Trading ConsiderationsRisk Management: Given the mixed signals, use tight stop-losses. For bullish trades, consider entries near $3,275–$3,300 with stops below $3,225. For bearish trades, enter near $3,320 with stops above $3,355.
Key Events to Watch: Monitor the US PCE Price Index, NFP report, and Fed statements in early August for directional cues. Geopolitical developments could also trigger sudden moves.
Volatility: The 30-day volatility is low at 0.91%, suggesting consolidation, but upcoming data releases could spark sharper moves.
# Chart for the reference will give u better idea to take decisions
in my views top has been made
~~ Disclaimer ~~
This analysis is based on recent technical data and market sentiment from web sources. It is for informational \ educational purposes only and not financial advice. Trading involves high risks, and past performance does not guarantee future results. Always conduct your own research or consult a SEBI-registered advisor before trading.
# Boost and comment will be highly appreciated.
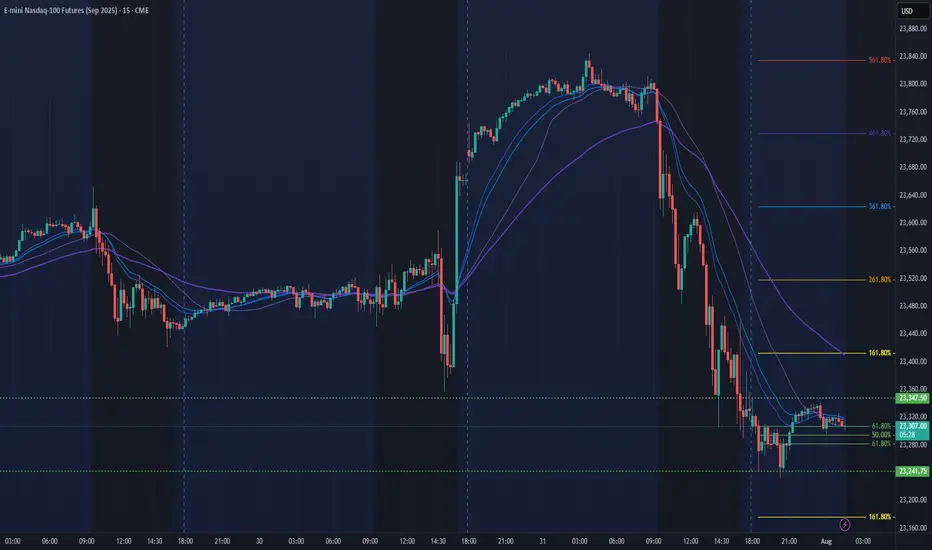
NQ Power Range Report with FIB Ext - 8/1/2025 SessionCME_MINI:NQU2025
- PR High: 23347.50
- PR Low: 23241.75
- NZ Spread: 236.0
Key scheduled economic events:
08:30 | Average Hourly Earnings
- Nonfarm Payrolls
- Unemployment Rate
09:45 | S&P Global Manufacturing PMI
10:00 | ISM Manufacturing PMI
- ISM Manufacturing Prices
Engulfing daily bar from ATH into new week lows
Session Open Stats (As of 12:45 AM 8/1)
- Session Open ATR: 262.82
- Volume: 45K
- Open Int: 280K
- Trend Grade: Long
- From BA ATH: -2.2% (Rounded)
Key Levels (Rounded - Think of these as ranges)
- Long: 23811
- Mid: 22096
- Short: 20383
Keep in mind this is not speculation or a prediction. Only a report of the Power Range with Fib extensions for target hunting. Do your DD! You determine your risk tolerance. You are fully capable of making your own decisions.
BA: Back Adjusted
BuZ/BeZ: Bull Zone / Bear Zone
NZ: Neutral Zone
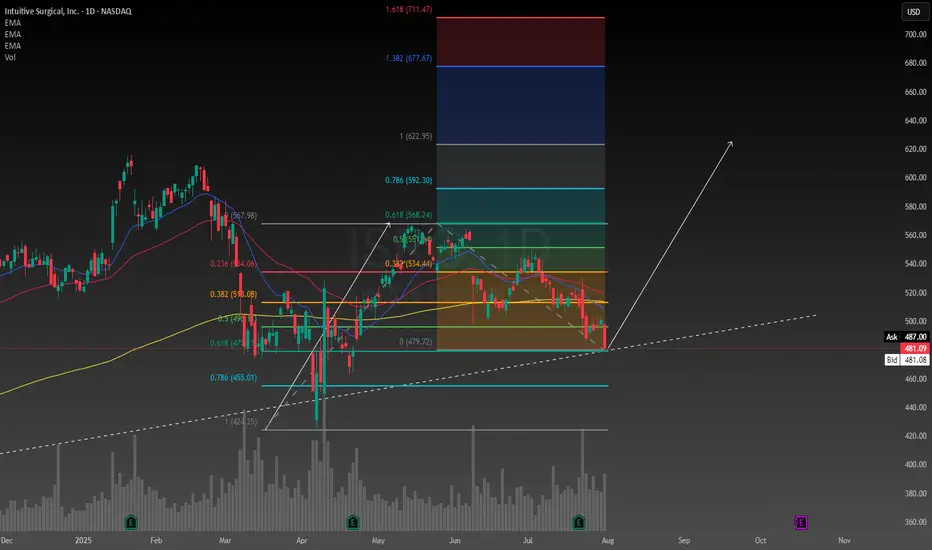
Technically Intuitive Surgical looks like it has found supportBecause I don't know much about the healthcare industry I have been avoiding it thus far. However I have done some research on Intuitive Surgical and was surprised to learn about what they do. The company is a mix between technology and healthcare, there's nobody to compete with them either which was something I found to be valuable at this time.
I have conducted a technical analysis using a trendline and a Fibonacci measurement. The risk is high, fundamentally the stock is very overvalued, but I believe this may be because of the potential the company has to grow. Every hospital is saying the same thing, they are understaffed. I feel like this company might have a positive influence to healthcare and hospitals in the future.
I have calculated the intrinsic value using the discounted cash flow model. Assuming a discount rate of 6.4%, with a 5 year exit the intrinsic value is $365. After running the numbers with a discount rate between 5.8% and 7.0% the range of the intrinsic value is between $235 and $1070 so there is clearly a potential for a significant upside. But I am taking a cautious approach because like I mentioned it is still looking over valued. I want to take the risk of owning this stock but I will monitor the company closely to make sure the fundamentals do not change as to why I decided to buy it in the first place.
I think the technical analysis I have drawn on the chart speaks for itself no need to explain much I think most people know technical analysis. I want to buy it tomorrow but I might wait a week or so to see how the tariff drama plays out and whether I can get a better deal or not I will probably enter with a stop order because I want to enter when the price is going up maybe above the next green bar on the daily we shall see I am being very cautious this time. I will start by allocating 5% of my portfolio to ISRG but that's always subject to change in the future.
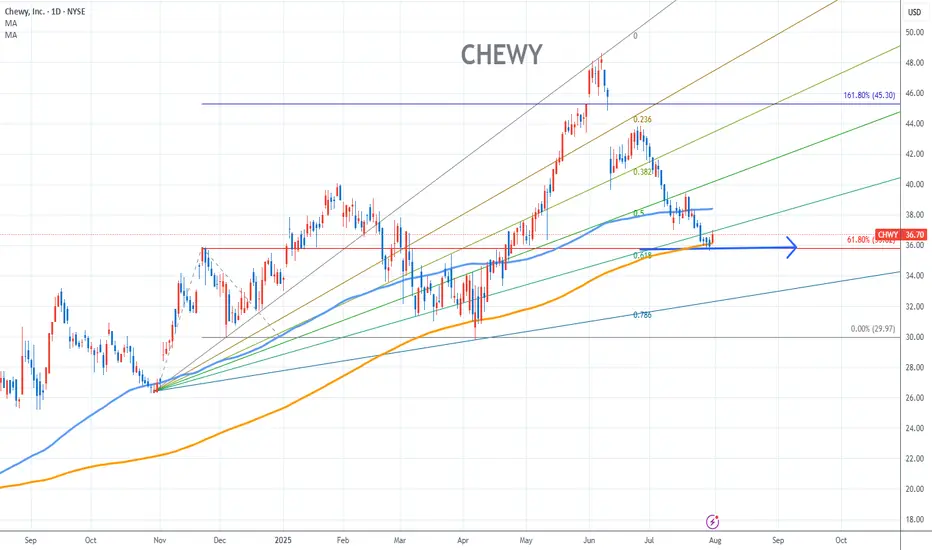
Chewy Stock Chart Fibonacci Analysis 073125Trading Idea
1) Find a FIBO slingshot
2) Check FIBO 61.80% level
3) Entry Point > 36/61.80%
Chart time frame:D
A) 15 min(1W-3M)
B) 1 hr(3M-6M)
C) 4 hr(6M-1year)
D) 1 day(1-3years)
Stock progress:C
A) Keep rising over 61.80% resistance
B) 61.80% resistance
C) 61.80% support
D) Hit the bottom
E) Hit the top
Stocks rise as they rise from support and fall from resistance. Our goal is to find a low support point and enter. It can be referred to as buying at the pullback point. The pullback point can be found with a Fibonacci extension of 61.80%. This is a step to find entry level. 1) Find a triangle (Fibonacci Speed Fan Line) that connects the high (resistance) and low (support) points of the stock in progress, where it is continuously expressed as a Slingshot, 2) and create a Fibonacci extension level for the first rising wave from the start point of slingshot pattern.
When the current price goes over 61.80% level , that can be a good entry point, especially if the SMA 100 and 200 curves are gathered together at 61.80%, it is a very good entry point.
As a great help, tradingview provides these Fibonacci speed fan lines and extension levels with ease. So if you use the Fibonacci fan line, the extension level, and the SMA 100/200 curve well, you can find an entry point for the stock market. At least you have to enter at this low point to avoid trading failure, and if you are skilled at entering this low point, with fibonacci6180 technique, your reading skill to chart will be greatly improved.
If you want to do day trading, please set the time frame to 5 minutes or 15 minutes, and you will see many of the low point of rising stocks.
If want to prefer long term range trading, you can set the time frame to 1 hr or 1 day.
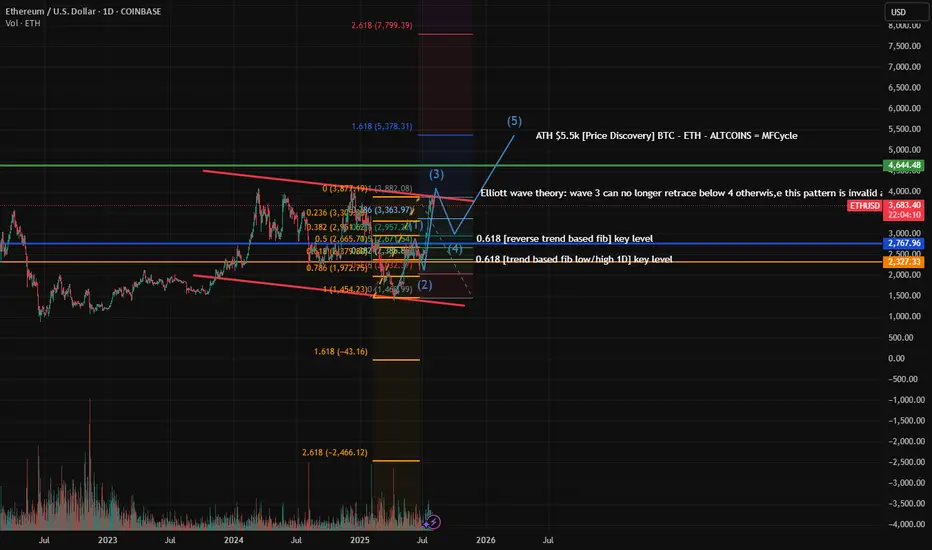
ETH in a 1-5 patternEverythings is labeled on the chart of my theory and where I predict if this theory is valid following BTC's ATH and the Money Flow Cycle.
USDJPY Wave Analysis – 31 July 2025- USDJPY broke resistance zone
- Likely rise to resistance level 152.00
USDJPY currency pair recently broke the resistance zone located between the resistance level 148.85 (which stopped earlier waves A and i) and the 50% Fibonacci correction of the downward impulse from January.
The breakout of this resistance zone accelerated the active impulse wave c, which belongs to medium-term ABC correction (2) from April.
USDJPY currency pair can be expected to rise further to the next resistance level 152.00 (target price for the completion of the active impulse wave C).

Jsw energy fibonachi supports Jsw has taken support of 418 (golden ration 61.8) and then at 490(ratio .5) so 485 is the stop loss and it is ready for target of 595
Cmo 512

MAMO Buying Opportunity🤑 CRYPTO:MAMOUSD did 3 waves pullback into extreme area $0.099 - $0.077 and as long as it holds the trendline from May low then Bulls will be looking for more upside to take place from here!

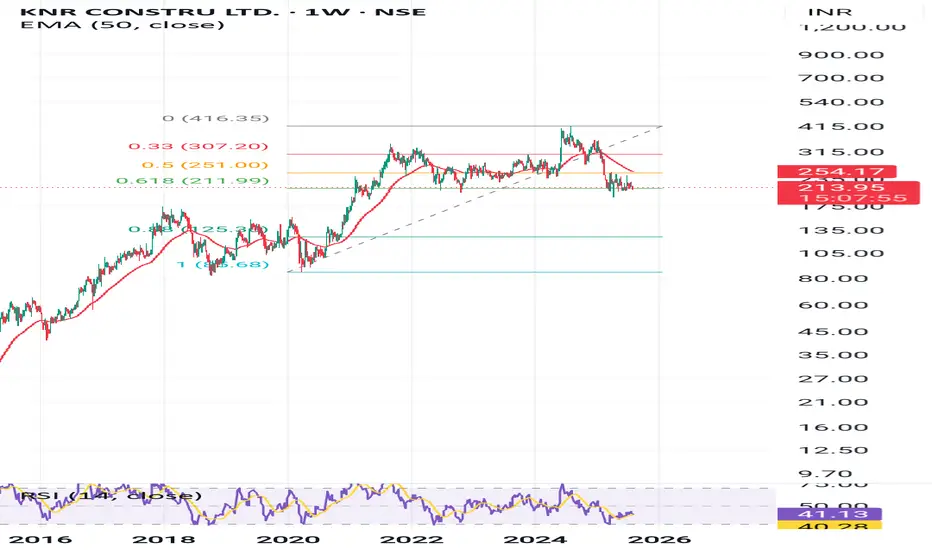
Retracement 61.8 golden ratio for KNR CONSTRUCTION Knr construction has corrected and taking support at fibonochi retracement level, might bounce from here keep an eye .
AGCO eyes on $120: Dual Fib Resistance to break and run to $140 AGCO earnings report was well received by the market.
Price surged into a resistance zone at $119.09-119.98
Looking for a Dip-to-Fib or Break-n-Retest to open longs.

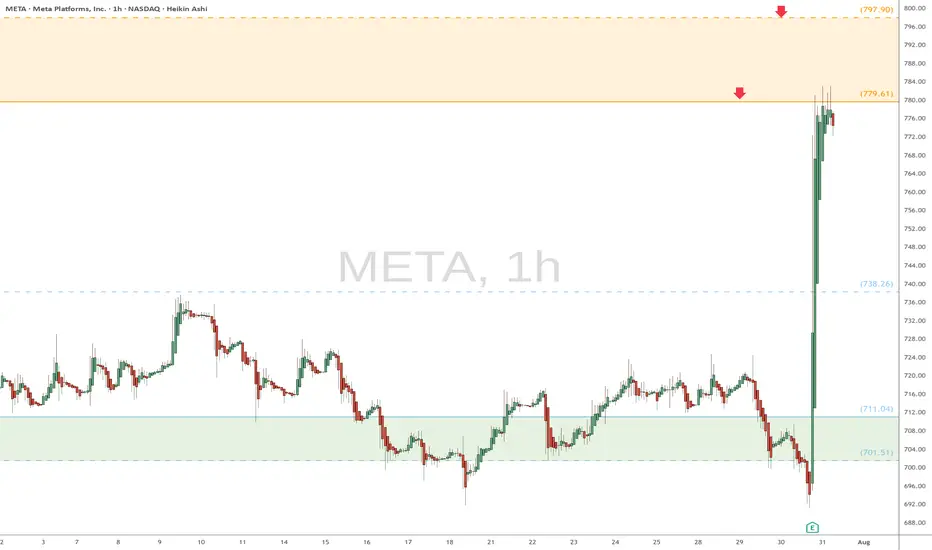
META watch $779 then 798: Dual Golden fib barrier to 800 round META earnings blew away the analyst expectations.
Surged into dual Golden fibs at $779.61 then 797.90
This "high gravity" zone will likely hold price for a bit.
.
See "Recent Publications" for previous charts ------------>>>>>>>>>
Such as this one that caught an HUGE BREAKOUT
Hit BOOST and FOLLOW for more such PRECISE and TIMELY charts.
=========================================================
.