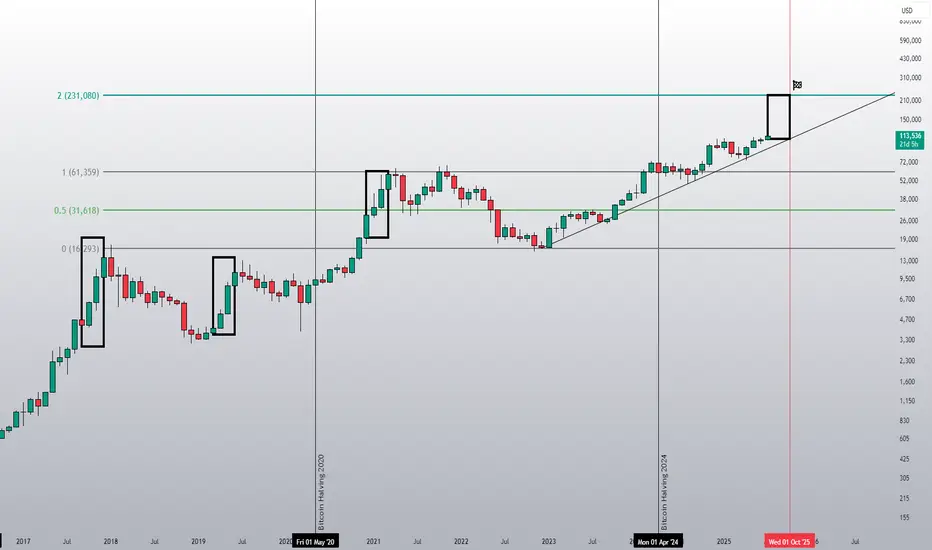
BTC is on track!This is what four month for Bitcoin can look like and you really think 230k in October 2025 is far-fetched?? You better rethink that.
Fibonacci
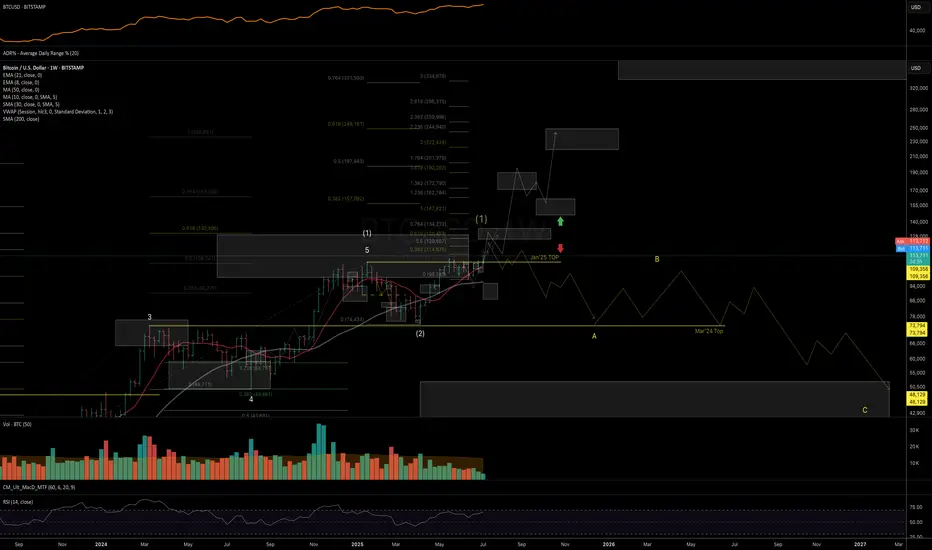
BTC: Macro Structure [Weekly Timeframe]Sharing my current view on the macro price structure of Bitcoin, outlining both main and alternative scenarios based on trend wave analysis.
Macro Trend Overview and Main scenario
The uptrend from the Nov ’22 bottom shows a classic 5-wave impulsive structure, closely aligning with ideal Fibonacci proportions:
Wave 3 peaked within the 1.382–1.618% zone
Wave 4 found support in the 1.236–1.000% area
Wave 5 topped near the 2.000% / 0.618% projection (measured from the Nov’18 bottom to Nov’21 top, projected from the Nov’22 low)
Wave (2) was relatively short in time and depth, but technically acceptable as complete. Given the broader technical structure, macro fundamentals, policy tailwinds, and social sentiment - I consider wave (2) to be finished.
The rally from April’25 low to May’25 high looks impulsive, followed by a clean three-wave pullback into the June’25 low - a structure consistent with the start of a new uptrend, within a larger degree wave (3).
If this is the case, given the fractal nature of the markets, price should Fibonacci proportions similar to the Nov’22 - Mar’24 cycle.
For this bullish count to remain valid, BTC must break and hold above the 126–134K resistance zone. This would open the door to next resistance zone be tested nex: 170–190K and 200–220/250K, where I’d expect a major top to begin forming, possibly, the start of a multi-year higher low formation.
Alternative Scenario
If price fails to break above 126–134K and starts showing reversal patterns, then the yellow count remains valid suggesting the entire trend from Nov’22 has peaked, and BTC could be entering a deep, prolonged correction (as per the yellow count).
In Summary
As long as weekly closes stay above 111.9K, my base case favors continued upside into 125–135K, where the next major decision zone lies:
• Either a short consolidation before breakout
• Or formation of a macro top
For more detailed levels and daily trend structure (including ETH, SOL, XRP, and HYPE), check out my recent video idea and Minds post.
Thank you for your attention and I wish you successful trading decisions!
If you found this idea helpful, I’d really appreciate a boost — and would be glad to have you as a subscriber!
Thank you for your attention and I wish you successful trading decisions!
* I'm keeping the same structure read from my public Mar'24 analysis:
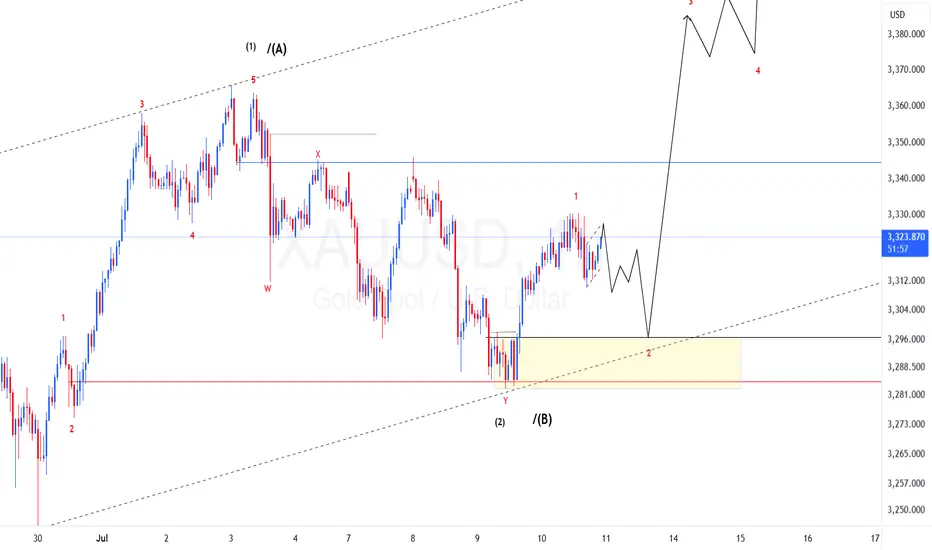
XAUUSD Elliot waves update: What to expect?Bullish bias is still on. Price made impulsive wave 1 of lower degree and now we should expect price to continue up to test the upper trend line. There is also a possibility that the 4th wave is still in play and a possible triangle is about to be finished, however, this does not change our current bias to the upside. I am expecting price to drop to test the extreme order flow before continuing. To take advantage of the bullish move one need to find the entry around this extreme order flow marked with a rectangle. "Trade responsibly, this is not financial advice"
Franco-Nevada Breakout — Is $160 the Launchpad?With gold breaking to new all-time highs and capital rotating into high-quality royalty names, Franco-Nevada looks poised to lead the charge in the next leg of the bull market.
After spending nearly 3 years in a wide consolidation ($106–160), FNV has now posted a clean monthly close above $160 — the key resistance level that capped every rally since 2020. This is not just any breakout — it's the classic "base + breakout" structure that often precedes major upside moves.
🔍 Technical Highlights:
✅ Multi-year base breakout confirmed on monthly close
✅ Strong confluence of Ichimoku, MAs & low-volume node just above $160
✅ $160 flips from resistance to structural support (role reversal)
🎯 Measured Move Target: $230
📍 Initial Target Zone: $208–215
📈 Retest of $160 offers a ~30% upside with tight risk
🛑 Risk Management: A pullback that holds $160 on weekly/monthly close would validate the breakout.
Breakdown below $160 on volume would put the move on hold and reintroduce range risk.
💡 Bottom Line: This is a textbook breakout with asymmetric risk/reward. While gold gets the headlines, Franco-Nevada may quietly be leading the charge in royalty sector performance.

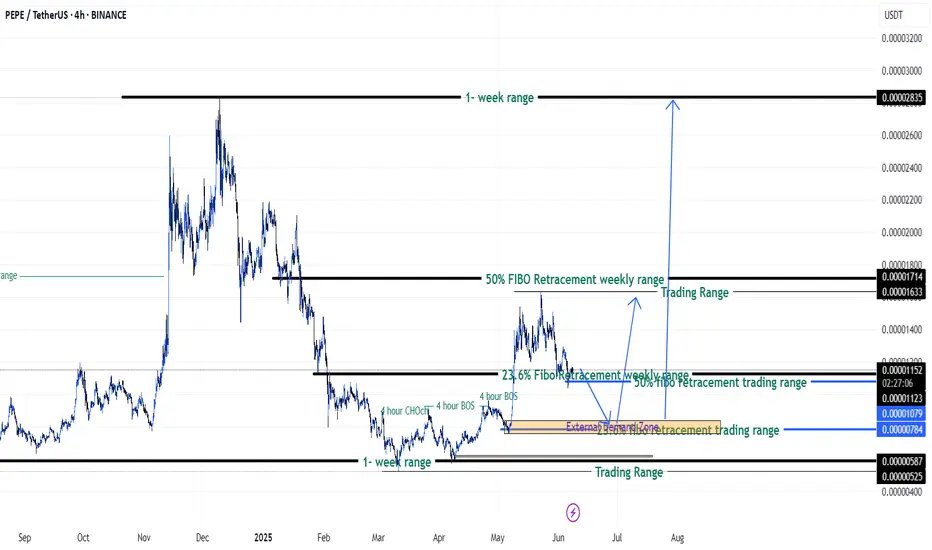
PEPEUSD going to moon according to my analysis. {08/june/2025}Educational Analysis says that PEPEUSD may give trend Trading opportunities from this range, according to my technical analysis.
Broker - binance
So, my analysis is based on a top-down approach from weekly to trend range to internal trend range.
So my analysis comprises of two structures: 1) Break of structure on weekly range and 2) Trading Range to fill the remaining fair value gap
Let's see what this pair brings to the table for us in the future.
Please check the comment section to see how this turned out.
DISCLAIMER:-
This is not an entry signal. THIS IS FOR EDUCATIONAL PURPOSES ONLY.
I HAVE NO CONCERNS WITH YOUR PROFIT OR LOSS,
Happy Trading, Fx Dollars.
Coffee Trade Analysis - Fx Dollars - {11/07/2025}Educational Analysis says that Coffee (Commodity) may give trend Trading opportunities from this range, according to my technical analysis.
Broker - NA
So, my analysis is based on a top-down approach from weekly to trend range to internal trend range.
So my analysis comprises of two structures: 1) Break of structure on weekly range and 2) Trading Range to fill the remaining fair value gap
Let's see what this Commodity brings to the table for us in the future.
Please check the comment section to see how this turned out.
DISCLAIMER:-
This is not an entry signal. THIS IS FOR EDUCATIONAL PURPOSES ONLY.
I HAVE NO CONCERNS WITH YOUR PROFIT OR LOSS,
Happy Trading, Fx Dollars.

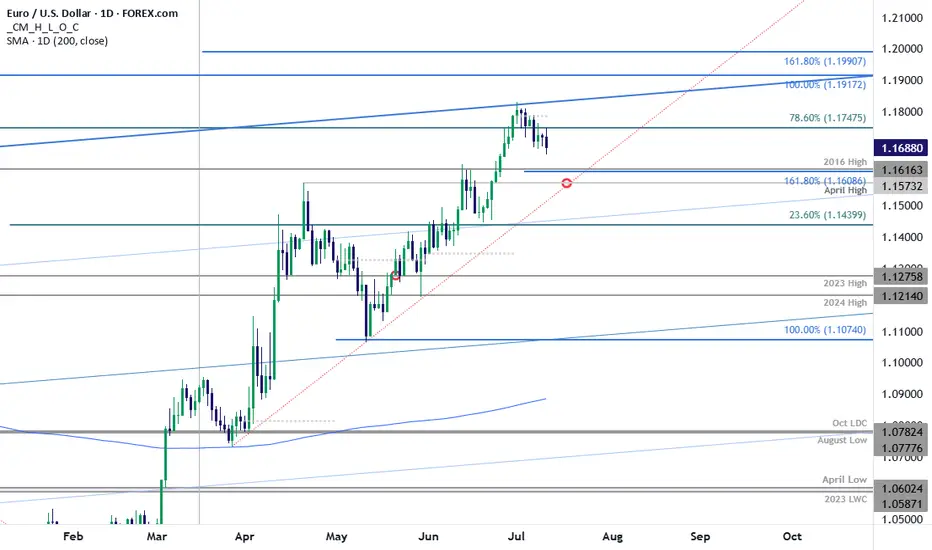
EUR/USD Correction Targets March Uptrend- Support in ViewThe Euro rally exhausted into uptrend resistance into the start of the month with EUR/USD threatening to snap a two-week winning streak at fresh yearly highs. Price has fallen more than 1% from the high and the near-term threat for a larger correction remains below the weekly open at 1.1775.
A break below the weekly opening-range today threatens further declines within this formation with initial support objective seen at the 1.618% extension / 2016 high at 1.1609/16 and the April high at 1.1573. Note that the April trendline converges on this threshold next week and a break / close below this slope would be needed to suggest a more significant high was registered last week / a larger reversal is underway- look for a larger reaction there IF reached. Subsequent support rests with the 23.6% retracement of the yearly range at 1.1440.
Initial resistance is eyed with the 78.6% retracement of the 2021 decline at 1.1748 and is backed closely by the objective weekly / monthly open at 1.1775/87- we’ll reserve this threshold as our bearish invalidation levels with a breach above the upper parallel (currently near ~1.1830s) ultimately needed to mark uptrend resumption. Subsequent resistance eyed at the 100% extension of the 2022 advance at 1.1917 and the 1.618% extension of the January rally at 1.1990.
Bottom line: A reversal off uptrend resistance into the monthly open threatens a larger correction here in EUR/USD. From a trading standpoint, losses should be limited to 1.1573 IF price is heading higher on this stretch with a close above the upper parallel needed to fuel the next major leg of the advance.
-MB
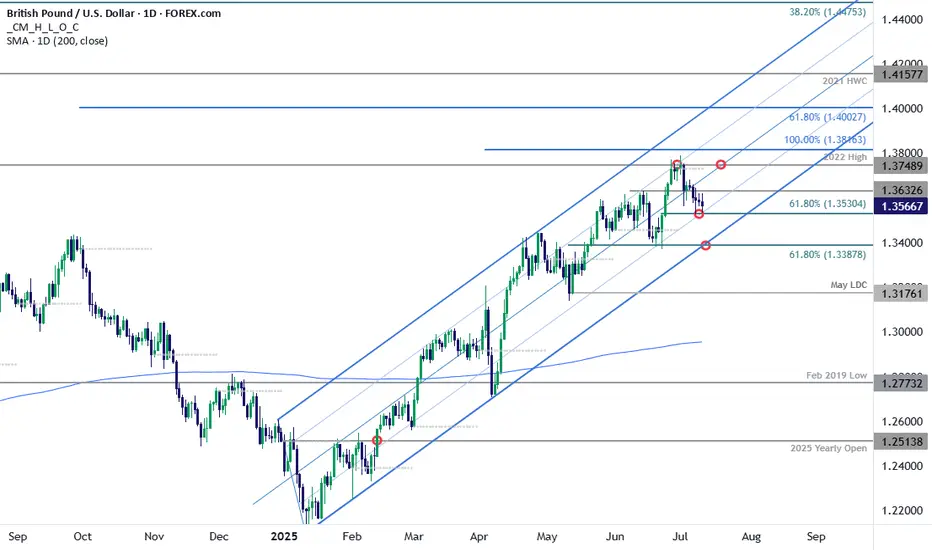
GBP/USD Poised for Fifth Daily Decline- Support in ViewThe Sterling rally failed to close above confluent trend resistance at the 2022 high near 1.3749 with GBP/USD now off more than 1.8% from the monthly / yearly high. The July opening-range seems set here at 1.3530-1.3750 and the focus is on a breakout in the days ahead with the broader outlook still constructive while within this formation.
GBP/USD is testing support today at the 61.8% retracement of the late-June advance at 1.3530 with the weekly opening-range preserved just above. Initial resistance eyed along this short-term channel with breach above the objective weekly open at 1.3645 needed to shift the focus back towards the 2022 high at 1.3749- a daily close above this level is still needed to mark uptrend resumption. Subsequent resistance objective eyed at the 100% extension of the January advance at 1.3816 and the 61.8% extension of the broader 2022 advance at 1.4003.
A break lower exposes key support at the 61.8% retracement of the May rally / 2024 high-day close (HDC) at 1.3388-1.3415. A break / close below this slope would suggest a more significant high was registered last week / a larger reversal is underway with initial support seen at the May low-day close (LDC) at 1.3176.
Bottom line: A reversal from trend resistance threatens a larger correction within the broader GBP/USD uptrend. The immediate focus is on a breakout of the weekly opening-range for guidance. From a trading standpoint, losses would need to be limited to 1.3388 IF Sterling is heading higher on this stretch with a close above 1.3749 ultimately needed to mark uptrend resumption.
-MB
Add-onsAs far as break outs go, this might be all it goes but I'd like to see it get a bit technical and hit that first level at the 618 before retesting the channel. If it can hold up there and maybe flush a bit out, then for me it's an adding opportunity. It might be the last chance we see these prices. It can always be wrong, but that's what stops are for on trading funds.

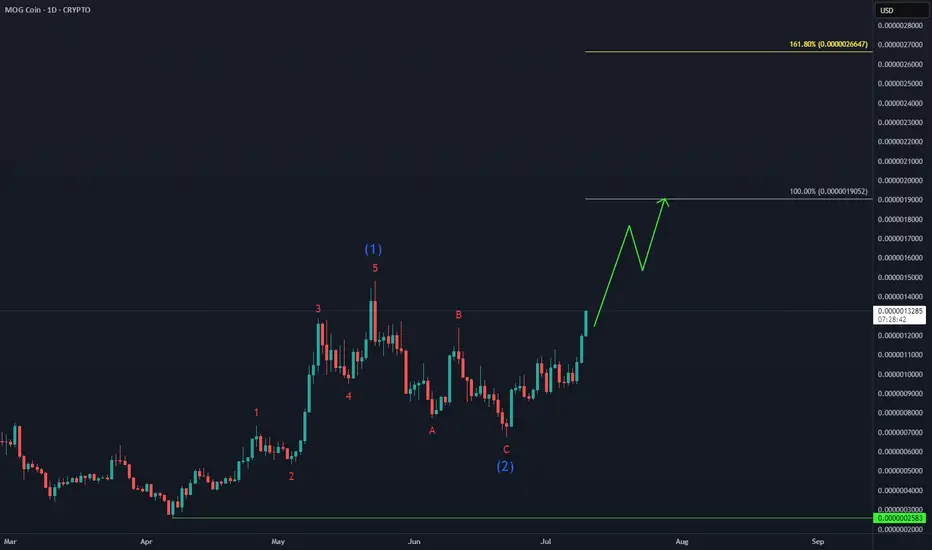
MOG Bullish Acceleration in ProgressCRYPTO:MOGUSD is currently experiencing the anticipated acceleration in wave (3)—typically the strongest and most impulsive leg in an Elliott Wave cycle.
With momentum building, the next upside target aligns with the 100% Fibonacci extension, which could propel price toward new highs if the structure holds.
Wave (3) is doing what it does best: leading the charge.
XAGUSD ~750 USD!?Hello. SILVER is approaching the cap of a multi-decade 'cup and handle' pattern. The measured move from that pattern reaches ~750USD/oz. GOLD has already reached the capping line of the 'cup and handle' and has continued up. Silver is known to lag Gold and outperform in the end. Position wisely my brothers and sisters.

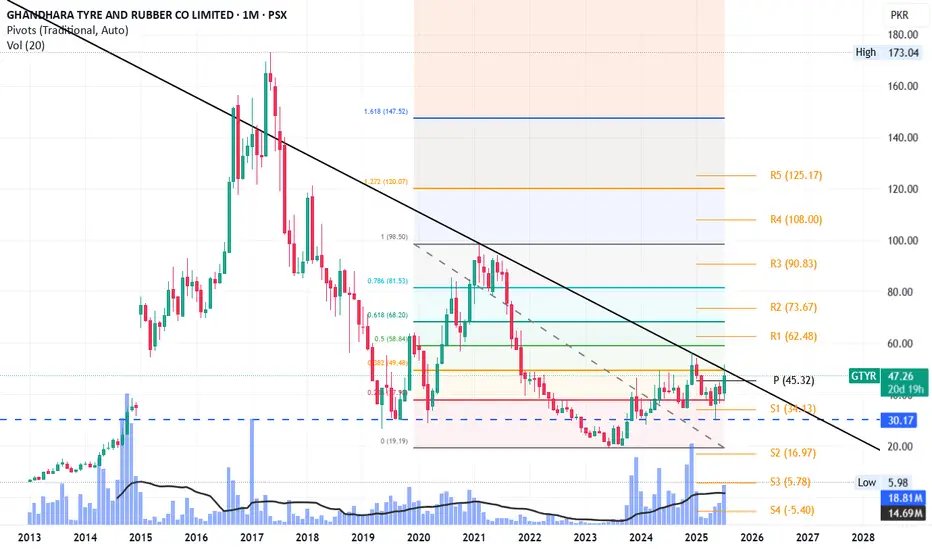
GTYR at the cusp of breakoutFib 0.236 level from last peak and trend line is the main hurdle. Once it breaks, resistances on pivots and other Fib levels will be the targets.
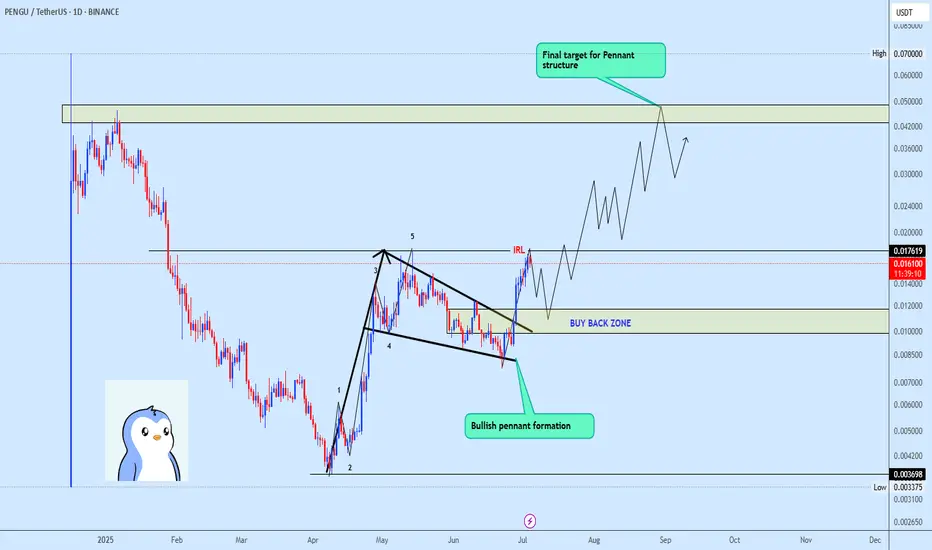
Penguusdt Buy opportunityPENGUUSDT is exhibiting a potential bullish pennant formation, with price making a strong breakout from the consolidation zone.
It recently found resistance near the top of the pennant pole around the $0.0176 level, which aligns with the Immediate Internal Resistance Level (IIRL).
The current plan is to watch for a pullback into the designated buy-back zone, offering a possible re-accumulation opportunity. If the structure holds, the projected pennant target sits around the $0.043 zone, as illustrated on the chart.
Nifty Analysis EOD – July 10, 2025 – Thursday🟢 Nifty Analysis EOD – July 10, 2025 – Thursday 🔴
"False Hopes, True Drop – Bears Tighten Their Grip"
Nifty opened with a mild 50-point gap-up, but within the very first minute, that optimism was crushed. It dropped nearly 100 points, breaching the previous day’s low, and entered the key support zone of 25405–25418, which held briefly for about half an hour.
But this wasn’t a day for bulls.
After a weak attempt to recover from the 25360 support (which held twice intraday), sellers regained momentum, dragged the index further down, and finally closed at the lowest point of the day – 25348.
🔸 Expiry volatility played its part — trapping option buyers and luring them into false reversals.
🔸 However, quick scalpers and intraday short-sellers likely capitalized well.
🔸 The structure was decisively bearish, with no meaningful intraday bounce.
Tomorrow becomes crucial.
Bulls have one last stronghold at the 25300 level.
Bears, already in charge, may extend the damage further if this breaks.
⚠️ Bias Levels:
🟢 Bullish above: 25420
🔴 Bearish below: 25290
⚪ Between = Neutral / Watch Mode
🕯 5 Min Time Frame Chart with Intraday Levels
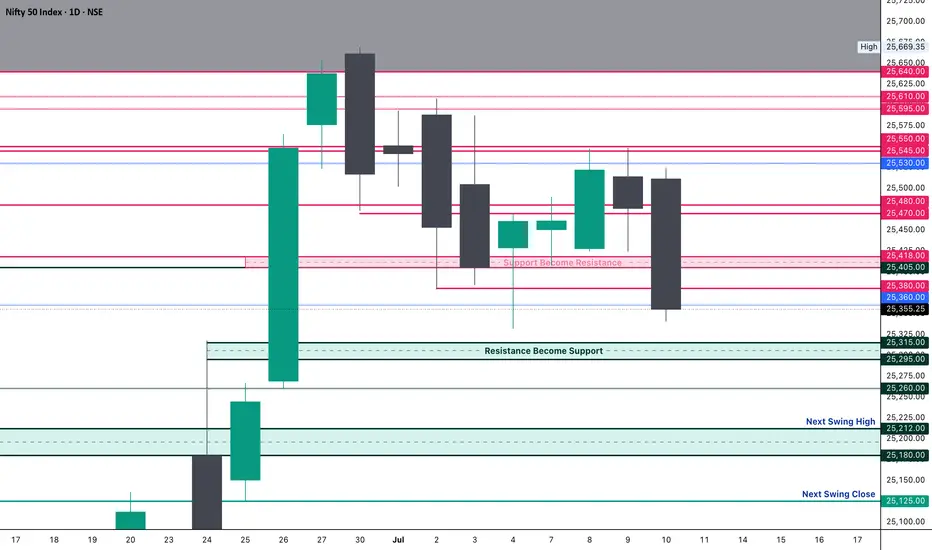
🕯 Daily Time Frame Chart with Intraday Levels
🕯 Daily Candle Breakdown
Open: 25,511.65
High: 25,524.05
Low: 25,340.45
Close: 25,355.25
Change: −120.85 (−0.47%)
📊 Candle Structure Breakdown
Real Body: 156.40 points – large red candle
Upper Wick: 12.40 points – minimal bullish push
Lower Wick: 14.80 points – bears kept pressure till close
🔍 Interpretation
Bears took over early and never let go
The close at day low shows strong conviction from sellers
Lack of significant wicks → no real fight from bulls
🕯 Candle Type
Bearish Marubozu-style candle – clear sign of dominance by sellers, and potential for continuation if no quick reversal
📌 Key Insight
Market is in a critical zone — hovering above the edge of deeper correction
25300–25290 is the line in the sand
A breakdown below can target 25,200–25,250
Bulls can only regain momentum above 25,420
🛡 5 Min Intraday Chart
⚔️ Gladiator Strategy Update
ATR: 189.49
IB Range: 113.75 → Medium IB
Market Structure: 🟡 Balanced
Trades Triggered
10:52 AM – Short Trade → 🎯 Trail SL Hit (R:R 1:0.38)
📌 Support & Resistance Zones
Resistance Levels
25,380
25,405 ~ 25,418
25,470 ~ 25,480
25,530
25,545 ~ 25,550
Support Levels
25,315 ~ 25,295
25,260
25,212 ~ 25,180
25,125
💭 Final Thoughts
"Expiry days often blur the picture, but today’s price action was sharp. Unless bulls step up quickly, the breakdown may just be getting started."
✏️ Disclaimer
This is just my personal viewpoint. Always consult your financial advisor before taking any action.
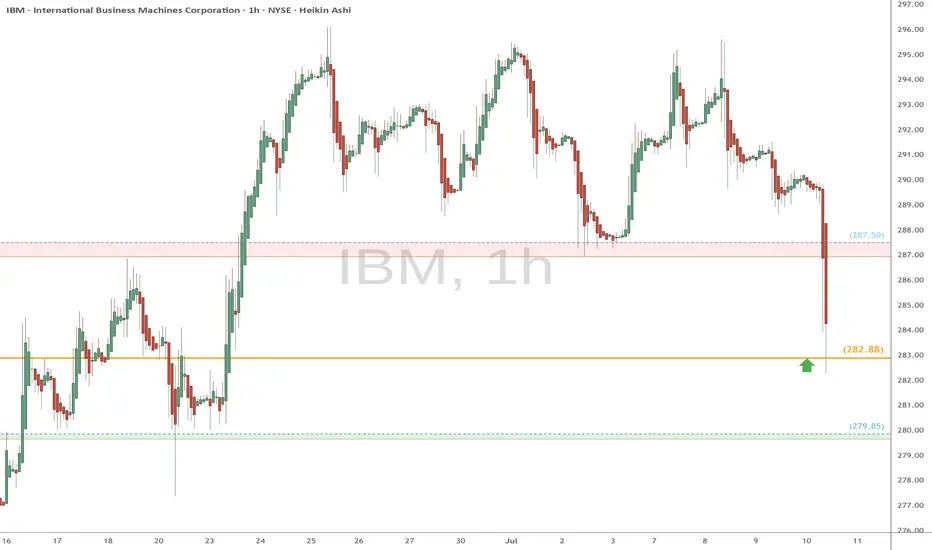
IBM eyes on $282.88: Golden Genesis fib a Key Support to uptrendIBM has been in a strong uptrend but looking top-ish.
It has pulled back to a Golden Genesis fib at $282.88
Look for a bounce but perhaps after a couple orbits.
.
See "Related Publications" for previous charts like this BOTTOM CALL:
Hit the BOOST and FOLLOW for more such PRECISE and TIMELY charts.
============================================================
.
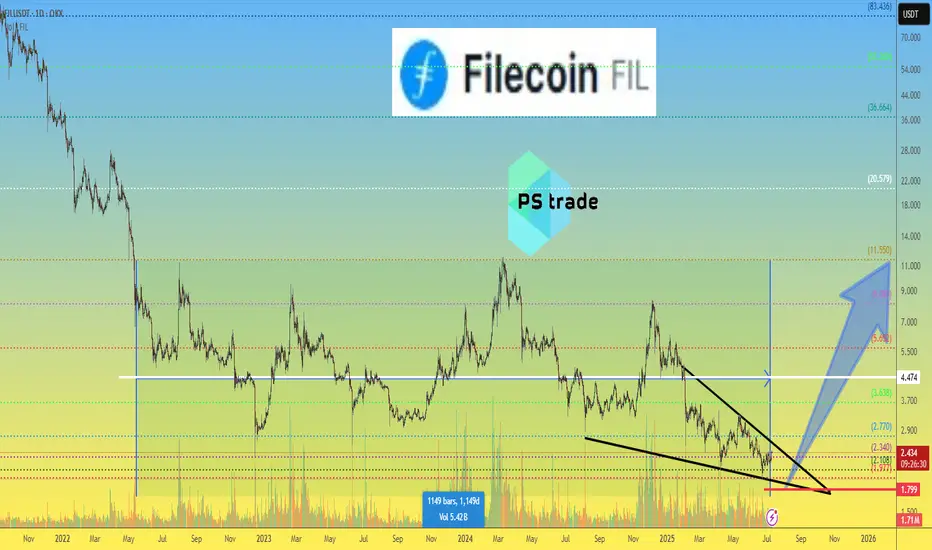
Filecoin FIL price analysis🪙 It would seem that #Filecoin is a “dinosaur” of the crypto market, having survived so many different cycles and “shocks,” whose fundamentals should only increase the annual application of the project, but no... it's not happening...
Looking at the OKX:FILUSDT chart, we see that the accumulation phase in the $2-11.50 range has been going on for over 1150 days, which means that another +/- 30-60 days of correction will not make a significant difference.
What can we say: we wish the holders patience and hope they wait for their moment of glory together with #FIL
🙂 And for those who want to test their luck and try to jump on the “last train” — place a “bucket” at $1.80 (any lower than that would be indecent)
Of course, if you believe that the price of #FILUSD will still be able to grow to at least $4.50 this year, and ideally to $11.50.
_____________________
Did you like our analysis? Leave a comment, like, and follow to get more
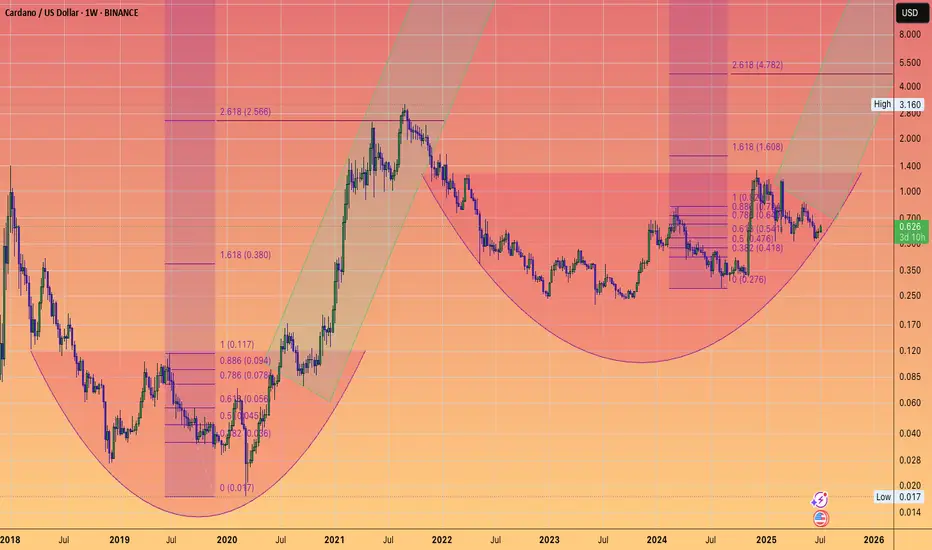
Could Cardano become a crypto unicorn?And make a 3rd new all time high in subsequent cycles.
One fib extension certainly suggests that is possible pointing towards around $4.80
Let's see ... things can mover very fast during altseason.
Support Under Siege – Is Gold Ready for Another Leg Down?As I expected in the previous idea , Gold ( OANDA:XAUUSD ) rose to $3,343 on the 1-hour time frame , but failed to break the Resistance zone($3,350-$3,326) and started to fall with relatively good momentum .
Do you think Gold can finally break the Support zone($3,312-$3,280) and Support lines , or will it rise again?
Gold is currently trading in the Support zone($3,312-$3,280) and near the Support line s. It has also managed to break the downtrend line .
In terms of Elliott Wave theory on the 15-minute time frame , Gold appears to be completing a main wave 4 . The main wave 4 appears to follow Double Three Correction(WXY) . Also, the main wave 3 is extended due to the high downward momentum.
I expect Gold to start falling again by entering the Potential Reversal Zone(PRZ) or Resistance zone($3,302-$3,296) and eventually breaking the Support zone($3,312-$3,280) and Support lines, Gold's falling targets are clear on the chart.
Note: Stop Loss (SL) = $3,313
Gold Analyze (XAUUSD), 15-minute time frame.
Be sure to follow the updated ideas.
Do not forget to put a Stop loss for your positions (For every position you want to open).
Please follow your strategy; this is just my idea, and I will gladly see your ideas in this post.
Please do not forget the ✅ ' like ' ✅ button 🙏😊 & Share it with your friends; thanks, and Trade safe.

Ethereum & monthly 20MAEthereum is gaining strength and will likely break above the monthly 20 MA. Will it maintain this momentum by month's end and remain bullish in the coming months?
Good luck HODLRS ✌️🤞

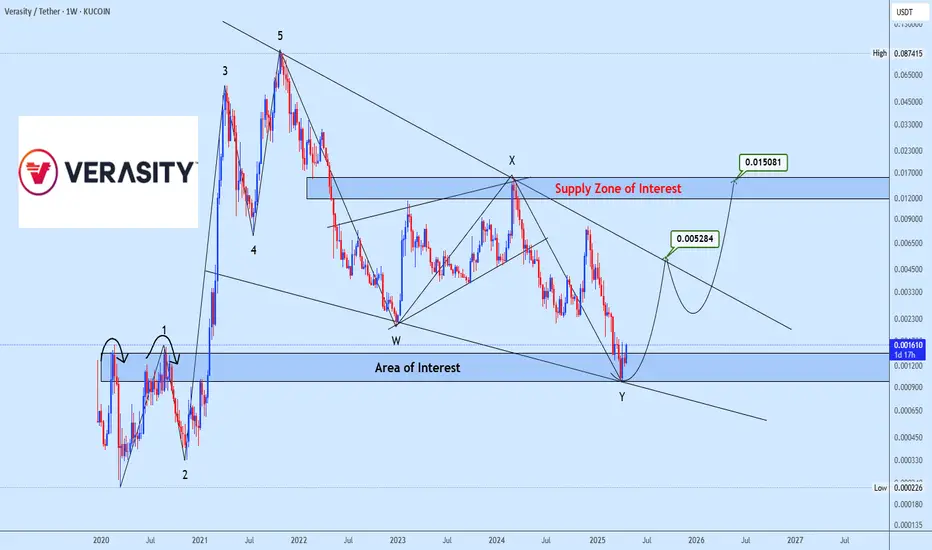
VRAUSDT correction is done time to flyVRAUSDT is presenting a clear completion of a WXY corrective structure into the defined Area of Interest, offering a potential re-accumulation opportunity. Price is currently reacting from the major demand zone with initial upside targets around 0.005284 and a secondary target aligning with the Supply Zone of Interest near 0.015081. The overall structure suggests a corrective phase conclusion with prospects of a new bullish impulse. Future validation will depend on sustained bullish momentum from the current demand area.
EURUSDSentiment: Bullish Bias
Institutions are holding a strong net long position on the Euro, with +107,537 contracts. This reflects continued bullish sentiment toward EUR, suggesting strength against the USD. With DXY showing net shorts and EUR net longs, EUR/USD may favor upside moves, especially from key daily demand zones. Swing traders should watch for bullish confirmations and structure shifts on 4H.

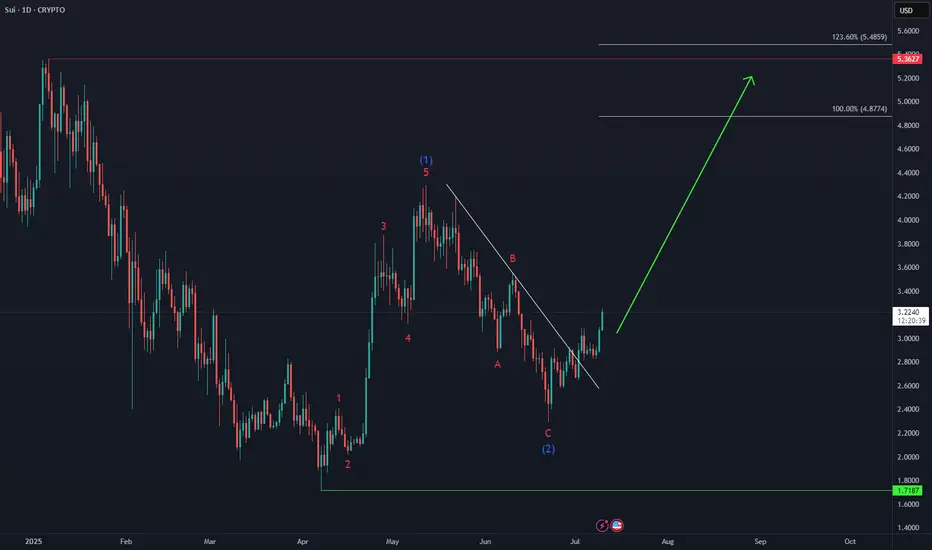
SUI Next Upside Target🚀 After holding above the April low and completing a 3-wave pullback in wave (2), CRYPTO:SUIUSD is now advancing in a potential wave (3).
Momentum is building, and the next upside target lies in the equal legs zone at $4.80 – $5.40, which could eventually lead to a new all-time high.
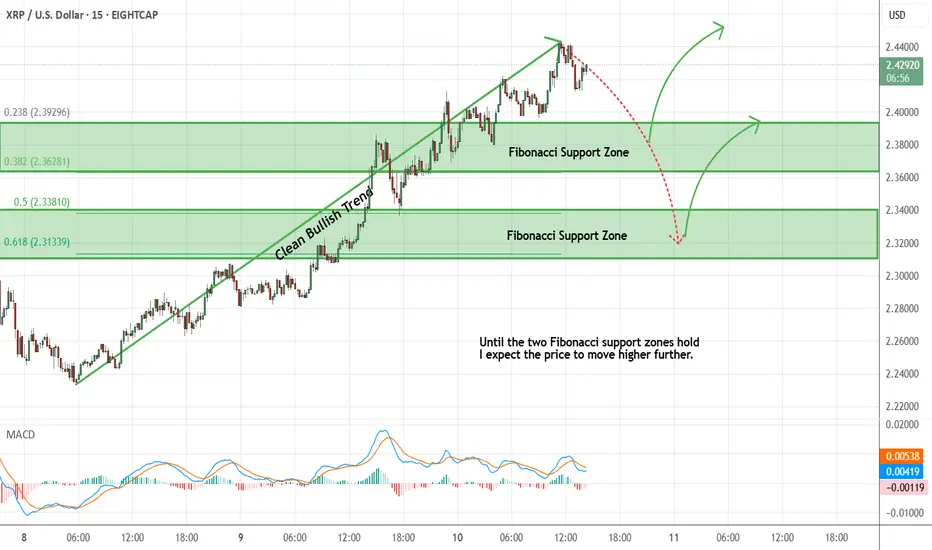
Ripple - Expecting Bullish Continuation In The Short TermH4 - We have a clean bullish trend with the price creating a series of higher highs, higher lows structure.
This strong bullish momentum is followed by a pullback.
No opposite signs.
Until the two Fibonacci support zones hold I expect the price to move higher further.
If you enjoy this idea, don’t forget to LIKE 👍, FOLLOW ✅, SHARE 🙌, and COMMENT ✍! Drop your thoughts and charts below to keep the discussion going. Your support helps keep this content free and reach more people! 🚀
--------------------------------------------------------------------------------------------------------------------