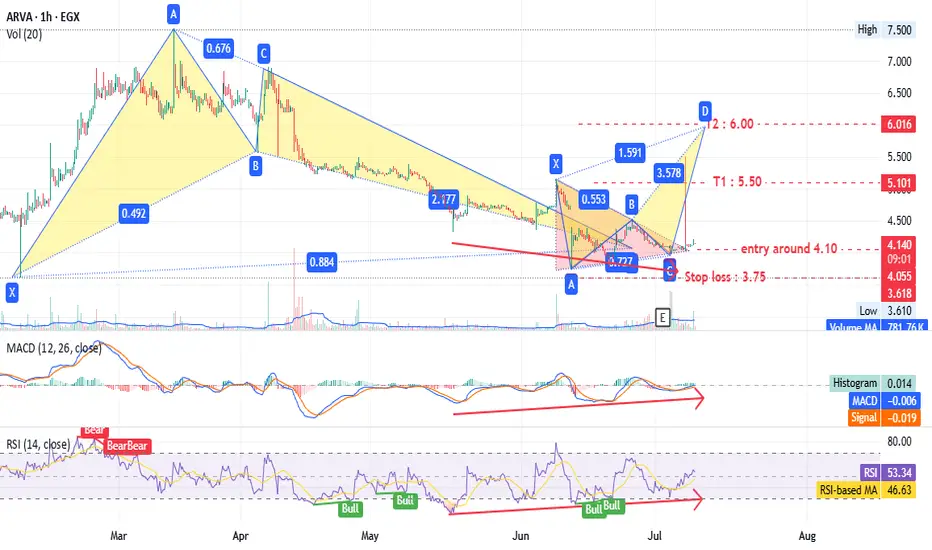
ARVA - many patterns give one target - Amazing EGX:ARVA timeframe 1 hour
Entry around 4.10
Stop loss at 3.75 (10% loss).
Targets at 5.50 and 6.00 (up to 44% profit).
Hourly chart shows a triangle pattern and bearish Gartley pattern.
Daily timeframe also indicates a bullish pattern with the same targets.
MACD and RSI support this analysis.
Note: This is not investment advice—only my analysis based on chart data. Consult your account manager before investing. Good luck!
Fibonacci
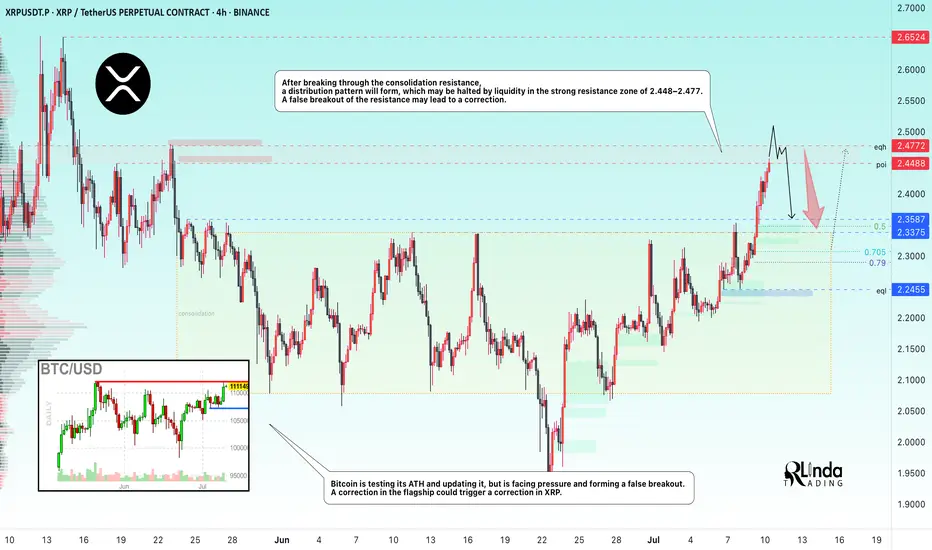
XRPUSDT → Resistance ahead. Correction before growthBINANCE:XRPUSDT is rising after breaking through consolidation resistance. Bitcoin's rally supported the overall market momentum, but a new resistance zone lies ahead...
Bitcoin is testing its ATH and updating it, but is facing pressure and forming a false breakout. A correction in the flagship coin could trigger a correction in XRP, but if Bitcoin continues to storm the 112K area without a pullback, followed by a breakout, the market could find support and continue to rise.
After XRP broke through resistance, the coin entered a distribution phase and is testing an important resistance zone of 2.4488 - 2.4772. The inability to continue growth, a false breakout, and price consolidation in the selling zone could trigger a correction.
Resistance levels: 2.4488, 2.4772, 2.6524
Support levels: 2.3587, 2.3375, 2.2455
Despite breaking through resistance, XRP is still in a local downtrend. Pressure on the market is still present. The formation of a false breakout will indicate that growth is limited for now. However, if the price consolidates above 2.4772 and begins to break out of the local structure, we can expect growth to continue.
Best regards, R. Linda!
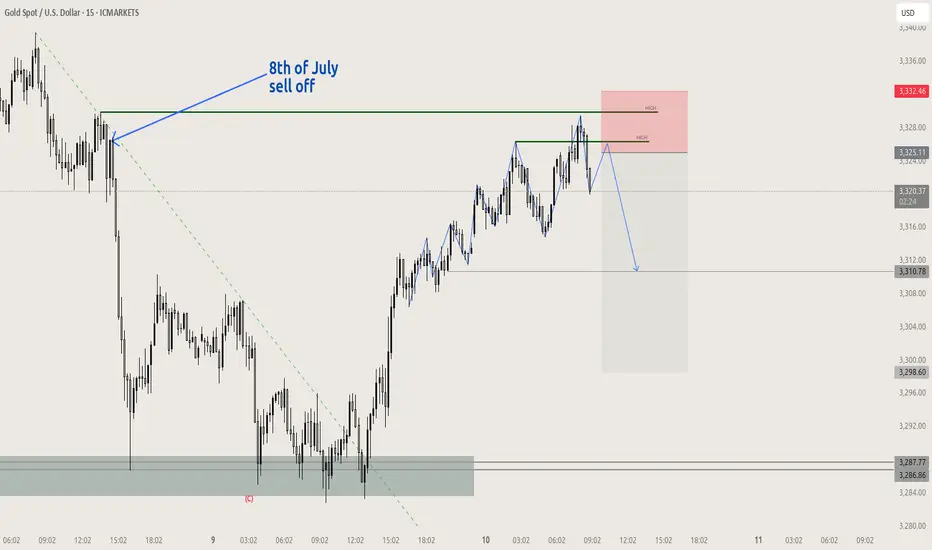
XAUUSD swing failure with FVGpotential short setup, loads of liquidity from 8th of july sell off, if no retest before reaching local new lows ( mid range of target) look for continuation buys
Ethereum Analysis – Vitalik’s Gas Cap Proposal Adds PressureToday, I want to show you the possible moves for Ethereum ( BINANCE:ETHUSDT ) this week.
Please stay with me .
Let’s first take a look at the important news that has come for Ethereum in the last 24 hours :
Ethereum’s Gas Cap Proposal Sparks Concerns
Ethereum co-founder Vitalik Buterin recently proposed EIP-7983 , introducing a gas limit cap to prevent potential DoS (Denial of Service) attacks on the network.
Bearish Takeaways:
This proposal reveals a current vulnerability in Ethereum’s infrastructure. If gas limits grow unchecked, nodes may fail to sync, leading to possible network instability.
Imposing a gas cap could temporarily reduce transaction throughput, affecting DeFi protocols and NFT platforms that rely on Ethereum’s scalability.
The market tends to react cautiously to core protocol changes, and this uncertainty could trigger short-term selling pressure.
Bullish Counterpoints:
The cap aims to strengthen the network’s long-term stability against spam and DoS attacks.
It’s still in the proposal stage, with no immediate impact on users or network performance.
Conclusion:
While the long-term impact may be positive, the short-term uncertainty and exposed risks provide a bearish narrative for Ethereum, especially amid growing competition from alternative chains.
--------------------------------------
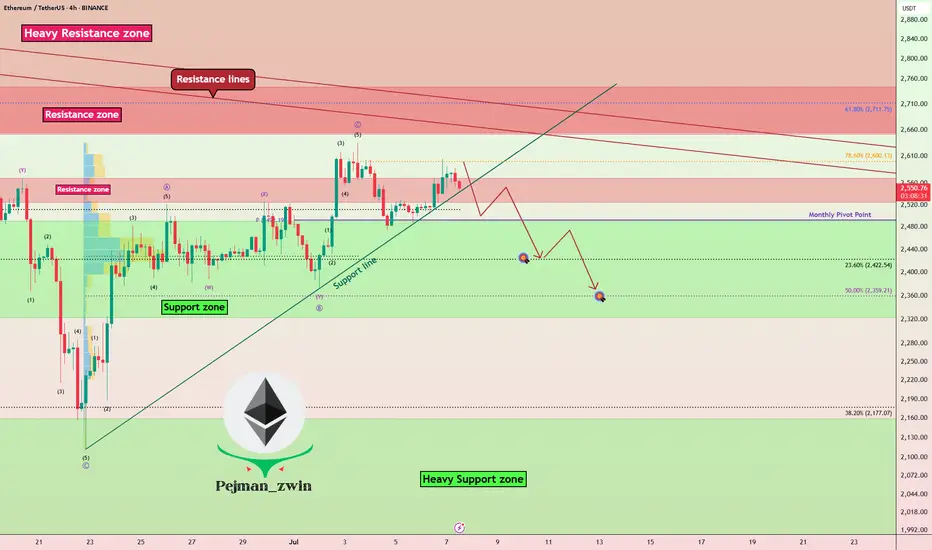
Now let's take a look at the Ethereum chart on the 4-hour time frame .
Ethereum is currently trading near the Heavy Resistance zone($2,929-$2,652) and Resistance lines , and is also trying to break the Support line .
In terms of the Elliott Wave theory , it seems that Ethereum has completed the Zigzag Correction(ABC/5-3-5) , so we can expect the next bearish wave .
I expect Ethereum to fall to at least $2,433 AFTER breaking the Support line, and if the Support zone($2,491-$2,323) is broken, we should expect further declines.
Second Target: $2,374
Note: Stop Loss (SL) = $2,689= Worst Stop Loss(SL)
Please respect each other's ideas and express them politely if you agree or disagree.
Ethereum Analyze (ETHUSDT), 4-hour time frame.
Be sure to follow the updated ideas.
Do not forget to put a Stop loss for your positions (For every position you want to open).
Please follow your strategy and updates; this is just my Idea, and I will gladly see your ideas in this post.
Please do not forget the ✅' like '✅ button 🙏😊 & Share it with your friends; thanks, and Trade safe.
USDJPY – Can the Dollar Squeeze Last?In FX markets, the USDJPY currency pair has moved more than most this week. Initially trading higher, rocked by President Trump’s unveiling of the tariff letter sent to Japan on Tuesday in a social media show outlining new tariffs on Japanese imports of 25%, supported by rising US 10 year treasury yields (+10 bps on week), which often can influence USDJPY prices, and a general squeeze on weak short US dollar positions across all G7/10 currency pairs. This all helped USDJPY to move from Monday’s opening level around 144.40 up to a 3-week high of 147.18 on Wednesday.
Then it was all change as USDJPY ran into a wave of fresh selling as traders took advantage of the squeeze to reopen short positions at higher levels, especially with various Bank of Japan board members discussing the potential for the Japanese central bank to raise interest rates again at some stage later in the year, and then President Trump unveiling more aggressive tariffs on countries such as Brazil (50% tariff), which renewed trader concerns that the US economy may be more negatively impacted by his trade policies. This sent USDJPY to a low of 145.75 this morning before recovering to slightly higher levels (146.25 0700 BST).
Looking forward, trade deals and Trump tariff headlines/social media posts may continue to influence where USDJPY moves into the Friday close, as could the technical outlook ahead of a busy week for scheduled events started on Monday July 14th.
Technical Update: USDJPY Back to Important Resistance?
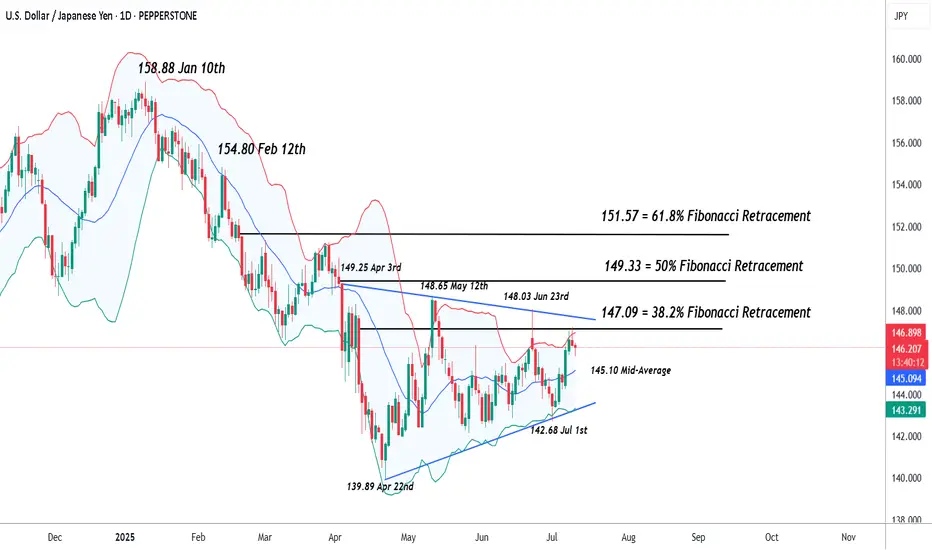
Since posting the 142.68 July 1st low, USDJPY has rallied strongly, seeing a more than 3% recovery in 6 sessions. This may mean some traders are looking for a more sustained price advance, but as the chart below shows, the latest price strength might only now be back to a resistance focus between the 147.09/147.64 levels.
These levels are equal to a combination of the 38.2% Fibonacci retracement of the January 10th to April 22nd decline at 147.09, and the downtrend that connects the highs seen on April 3rd, May 12th and June 23rd, which currently stands at 147.64. So far at least, this resistance area has capped the latest price strength.
Much will depend on future market sentiment and price trends, but it's possible closing breaks above the 147.09/64 resistance range may be required to suggest potential for a further phase of price strength towards 149.33, the higher 50%, even 151.57 the 61.8% retracements.
What if Resistance at 147.09/64 Continues to Hold?
Of course, the 147.09/64 resistance is currently holding price strength and could even prompt fresh weakness. As such, it could be suggested a more balanced sideways trading range is currently in place, with the latest price strength now back to the upper limit resistance at 147.09/64 .
If this is the case, it is possible price weakness might now emerge, with closing breaks under support at 145.10, the Bollinger mid-average, potentially suggesting further declines are possible towards 143.20, which is the uptrend connecting the recent lows, which also possibly marks the lower limits of the current sideways price range.
The material provided here has not been prepared accordance with legal requirements designed to promote the independence of investment research and as such is considered to be a marketing communication. Whilst it is not subject to any prohibition on dealing ahead of the dissemination of investment research, we will not seek to take any advantage before providing it to our clients.
Pepperstone doesn’t represent that the material provided here is accurate, current or complete, and therefore shouldn’t be relied upon as such. The information, whether from a third party or not, isn’t to be considered as a recommendation; or an offer to buy or sell; or the solicitation of an offer to buy or sell any security, financial product or instrument; or to participate in any particular trading strategy. It does not take into account readers’ financial situation or investment objectives. We advise any readers of this content to seek their own advice. Without the approval of Pepperstone, reproduction or redistribution of this information isn’t permitted.
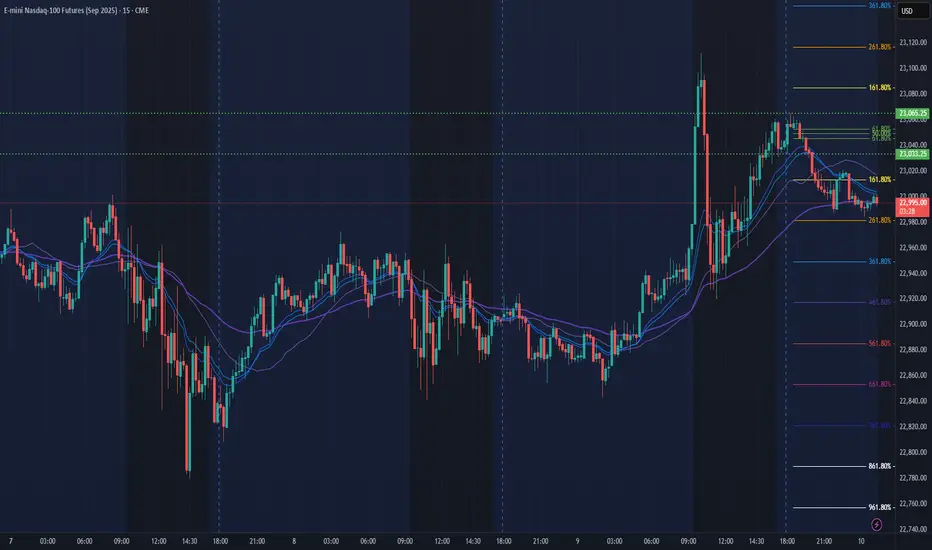
NQ Power Range Report with FIB Ext - 7/10/2025 SessionNQ Power Range Report with FIB Ext - 7/10/2025 Session
CME_MINI:NQU2025
- PR High: 23065.25
- PR Low: 23033.25
- NZ Spread: 71.5
Key scheduled economic events:
08:30 | Initial Jobless Claims
13:00 | 30-Year Bond Auction
Session Open Stats (As of 12:35 AM 7/10)
- Session Open ATR: 300.61
- Volume: 20K
- Open Int: 270K
- Trend Grade: Neutral
- From BA ATH: -0.4% (Rounded)
Key Levels (Rounded - Think of these as ranges)
- Long: 23239
- Mid: 21525
- Short: 20383
Keep in mind this is not speculation or a prediction. Only a report of the Power Range with Fib extensions for target hunting. Do your DD! You determine your risk tolerance. You are fully capable of making your own decisions.
BA: Back Adjusted
BuZ/BeZ: Bull Zone / Bear Zone
NZ: Neutral Zone
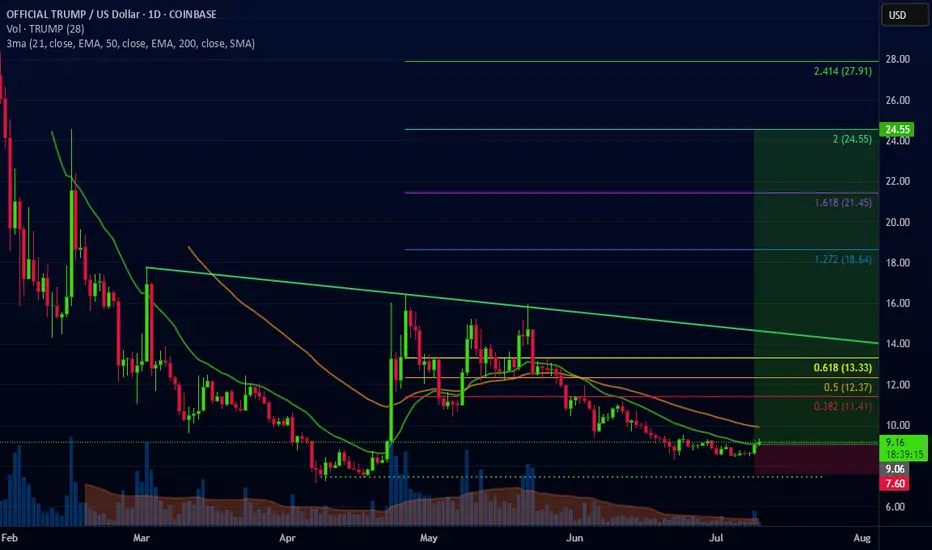
Trump closed green on line break chart daily
It's not often we see Trump close green on the line break chart but today's daily finally did. Trump has also yet to make a higher high on the daily and I believe once it does we'll see a big pump to the target I have placed.
Trump's ATR is currently 0.46 with a volatility of 6.13% possible movement in a day. Assuming things go south, I don't recommend holding more than 20% of your portfolio as Trump due to the volatility. This will help keep your portfolio safe via risk management should the line break green candle not result in a pump. That said I am quite bullish on Trump, let's see how this goes.
Bitcoin Longer: Clear Blue Skies for Wave 3 of 5As I explained in this video, I believe that we are currently in a wave 3 of 5 for Bitcoin and we should be breaching new highs as we have an undergoing wave 3. However, take note that the risk-reward is not good to go long. So I would recommend holding if you already have a position but to be very cautious if you are thinking of initiating a new long position.
The stop loss is $109,700. The near-term take profit is $113,923 before a potential pull back and then up to $115,000.
Good luck!

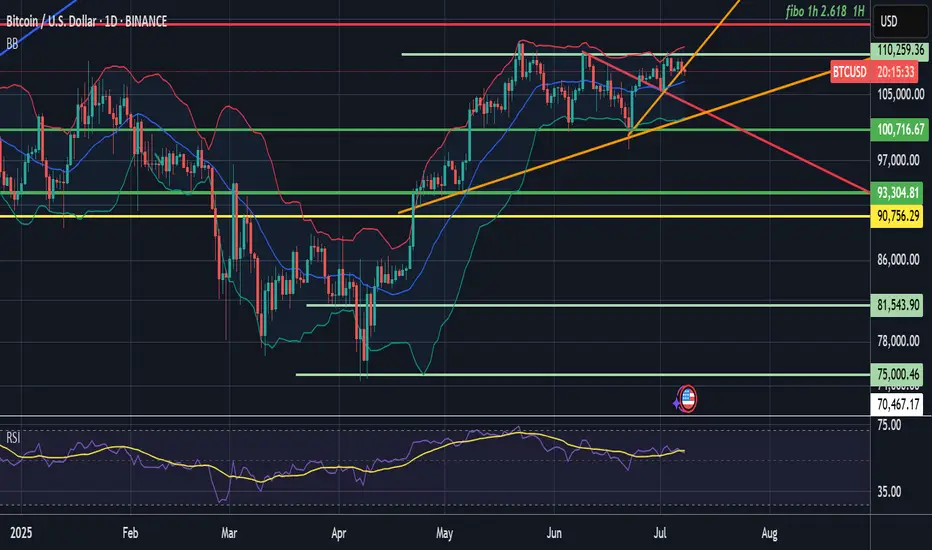
Price: ~$107,900 Trend: Consolidating after a breakout from a dCurrent Setup Analysis
BTC broke out of a falling wedge pattern (red trendline) and is holding above support near $100K.
Higher lows since June indicate bullish accumulation.
The price is riding above the ascending orange trendline.
Bollinger Bands suggest potential continuation; RSI isn’t overbought.
▶️ Buy Setup (Long Bias)
Entry (Buy): Between 107,500–108,000
Stop Loss: Below 104,000 (just under trendline and BB midline)
Target 1: 110,259 (key horizontal + BB upper area)
Target 2: 112,000 (psychological resistance)
Target 3: 114,266–116,000 (Fibo 2.618 + extension zone)
Sell Setup (Short Bias) – only if rejection
Entry (Sell): If there's a clear rejection candle near 110,000–112,000
Stop Loss: Above 114,500
Target 1: 100,716
Target 2: 93,304
This is a low-probability setup unless rejection is clear.
Final Recommendation
High probability of bullish continuation (above 60%)
Prefer a buy-the-dip strategy with stop under $104K
Watch 110K area — could act as a breakout or rejection point
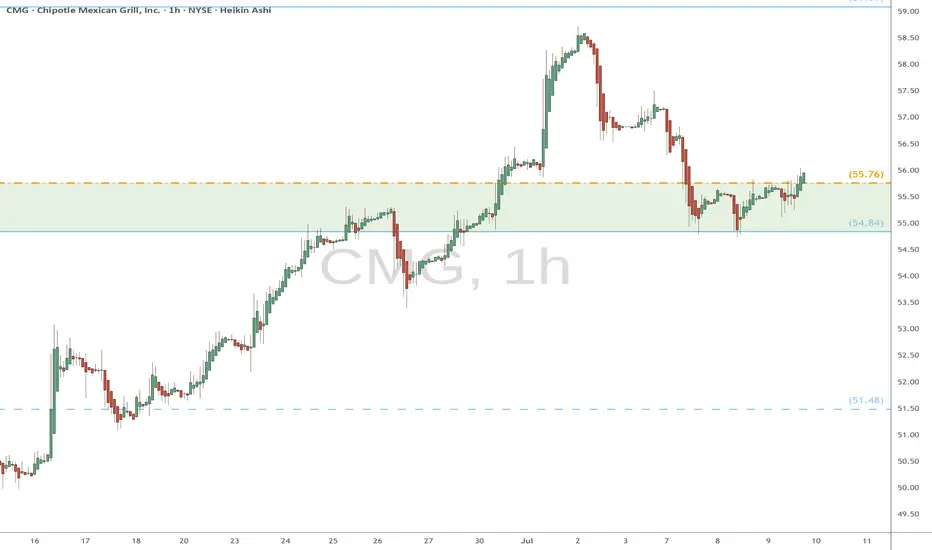
CMG watch $55.76: Golden fib maybe good support for Next Leg UPCMG trying to recover from loss of CEO and tariff worries.
Uptrend showing signs of strength, retesting a key support.
$55.76 a possible long entry with $54.84 fib for stop loss.
.
Previous analysis that caught THE BOTTOM:
====================================================
.
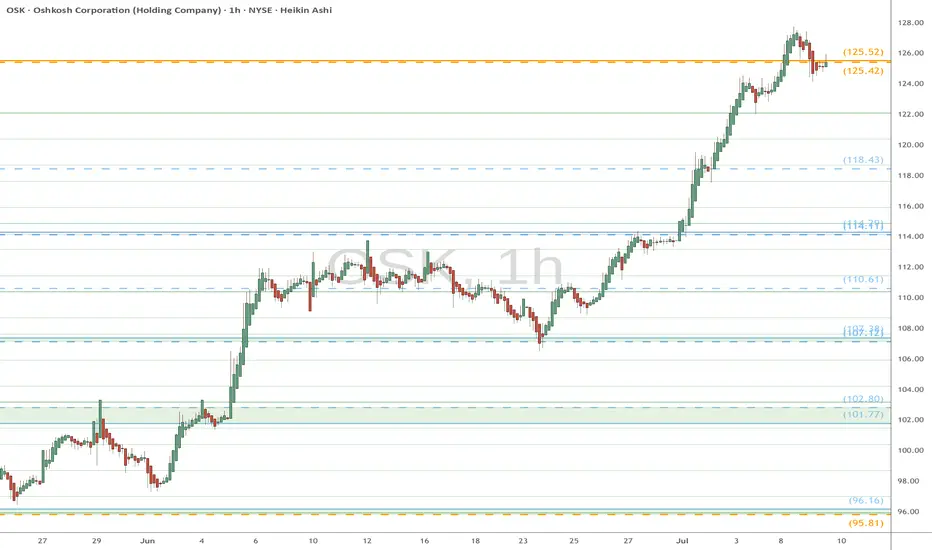
OSK eyes on $125.42/52: Double Golden Fibs likely to Orbit a bitOSK has been rising with the market and industrials.
It is hst just hit Dual Golden fibs at $125.42-125.52
Expecting a few orbits and possible dip from here.
.
This pair of Fibs called THE PREVIOUS TOP:
.
The smaller Golden Sisters also called THE BOTTOM:
Hit the BOOST and FOLLOW for more such PRECISE and TIMELY charts.
=============================================================
.
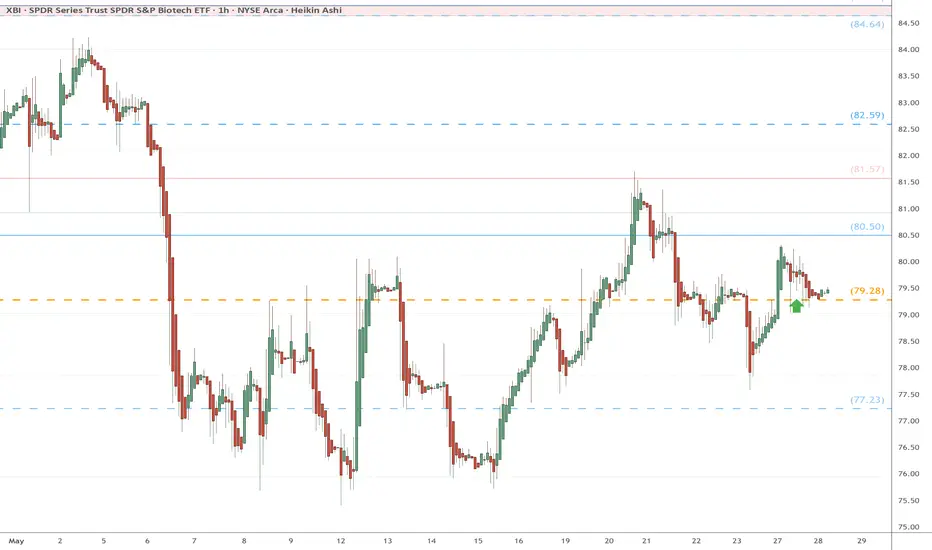
XBI eyes on $79.28: Golden Covid fib may mark the BioTech bottomXBI has been getting dumped since Trump and RFK
If biotech is to recover, it might start here and now.
Bulls need to hold or at least orbit this a few times.
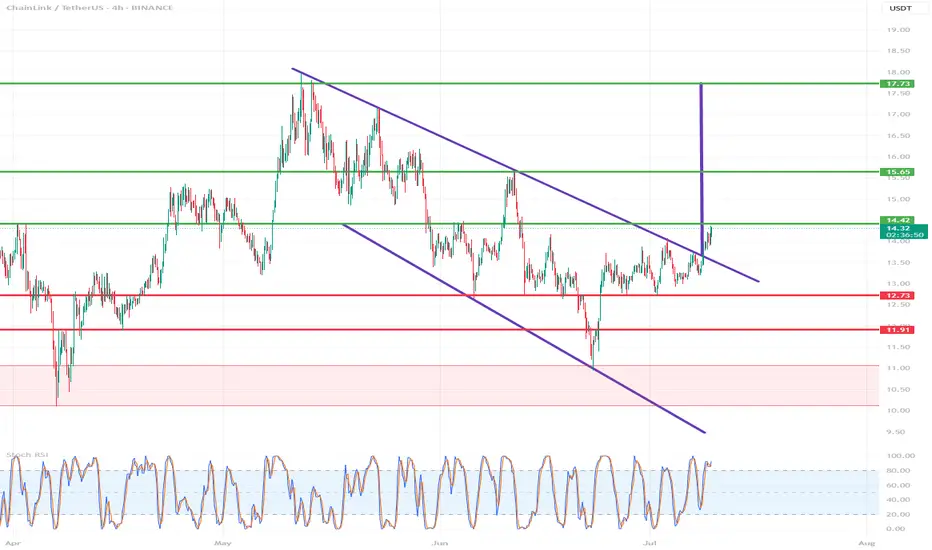
LINK/USDT (Chainlink to Tether) from the 4H interval⚡️ Technical situation – quick overview
✅ Breakout from the descending channel (purple lines)
✅ Resistance zone 14.42 – currently being tested
✅ Target within the breakout range – around 17.73 USDT
⚠️ Stochastic RSI in the overbought zone – local correction possible
🟪 Descending channel – broken!
The descending channel that has been in place since mid-May has been broken upwards.
Such breakouts often signal a change in the local trend.
Theoretical range of movement = channel height (~3.30 USDT) added to the breakout point (around 14.42) = ~17.73 USDT – perfectly aligned with your resistance level.
🟢 Key Resistance Levels (green):
Level Meaning
14.42 USDT Current tested resistance – psychologically significant
15.65 USDT Local high + June price gap
17.73 USDT Potential target after a breakout – range from the formation
🔴 Support Levels (red):
Level Meaning
12.73 USDT Support from the pre-breakout consolidation
11.91 USDT Key defensive level of the uptrend
11.07 / 10.12 USDT Historical support with strong demand reactions
📉 Stochastic RSI (oscillator):
Currently deep in the overbought zone (above 80).
This may indicate local exhaustion of momentum and a short correction before further upward movement.
However: in strong trends, the RSI may remain high for an extended period – it does not automatically provide a sell signal.
📈 Bullish scenario:
Retest of the 14.42 level as support → confirmation of the breakout
Then a move towards:
15.65 – local stop
17.73 – final target from the channel breakout
🟩 Stop-loss: e.g., below 12.73 USDT (loss of key support)
📉 Bearish scenario:
False breakout and decline below 14.42
Loss of the 12.73 level → possible quick decline to 11.91–11.07
🔴 In this case, a new swing low could open the way to 10.12 USDT.
📌 Summary:
Element Rating
Technical Pattern ✅ Breakout from a descending channel (bullish signal)
Current Level ❗ Test of Key Resistance – Decision Point
RSI (Momentum) ⚠️ Overbought – Correction Possible
Upside Potential (Target) 📈 17.73 USDT
Threat ❌ False breakout and return to below 12.73 USDT
🧠 My suggestion (not investment advice):
Observe the price reaction at 14.42 – if it holds above and consolidation forms → a signal to continue.
If the 4H/1D candle closes below, consider caution, as this could be a bull trap.
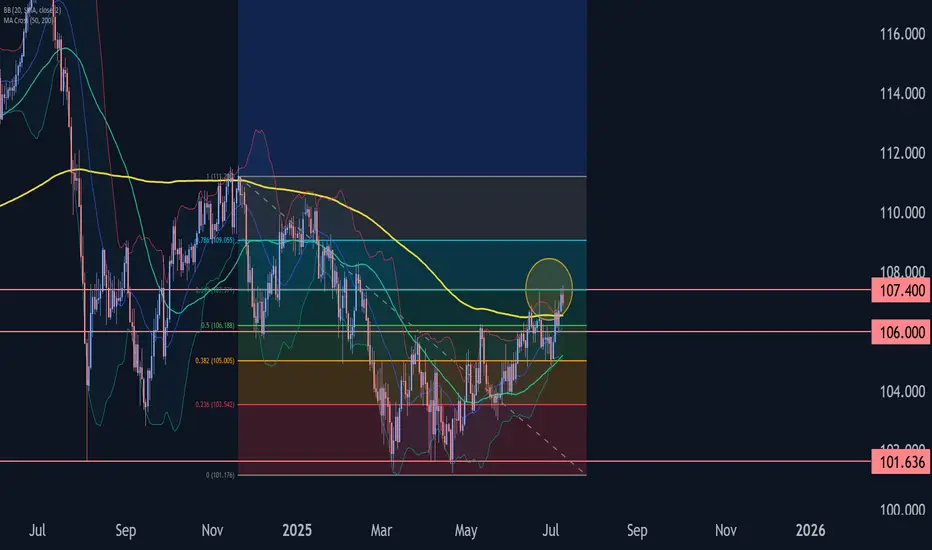
CADJPY Wave Analysis – 9 July 2025- CADJPY reversed from resistance area
- Likely to fall to support level 106.00
CADJPY currency pair recently reversed from the resistance area located between the resistance level 107.40 (former monthly high from June), upper daily Bollinger Band and the 61.8% Fibonacci correction of the downward impulse from November.
The downward reversal from this resistance area stopped the previous intermediate corrective wave (B).
Given the strength of the resistance level 107.40 and moderately bullish yen sentiment seen today, CADJPY currency pair can be expected to fall to the next support level 106.00.
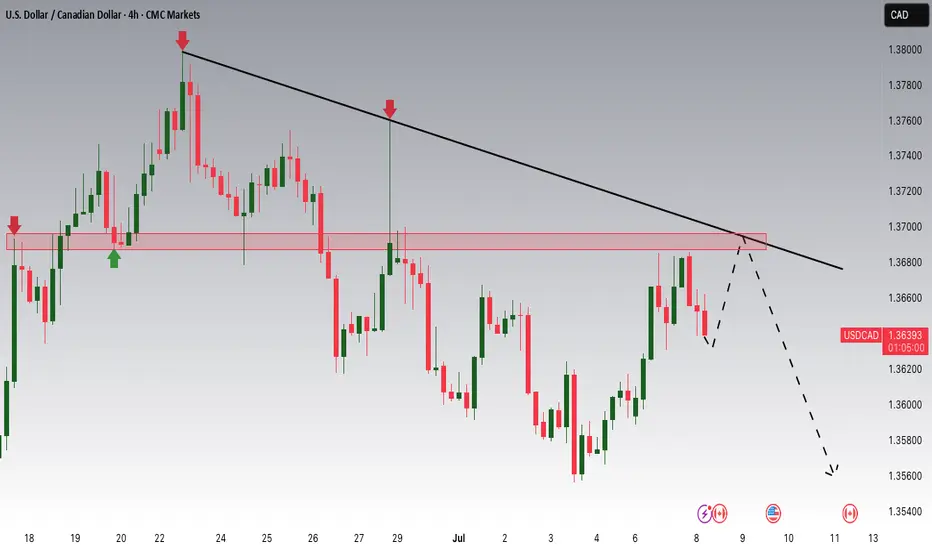
USDCAD Potential DownsidesHey Traders, in today's trading session we are monitoring USDCAD for a selling opportunity around 1.36900 zone, USDCAD is trading in a downtrend and currently is in a correction phase in which it is approaching the trend at 1.36900 support and resistance area.
Trade safe, Joe.
BTC about to cum?Just a reminder: These monthly candles may appear small, but they're all green for now. This doesn't look bearish; it looks like a buildup before an explosion.

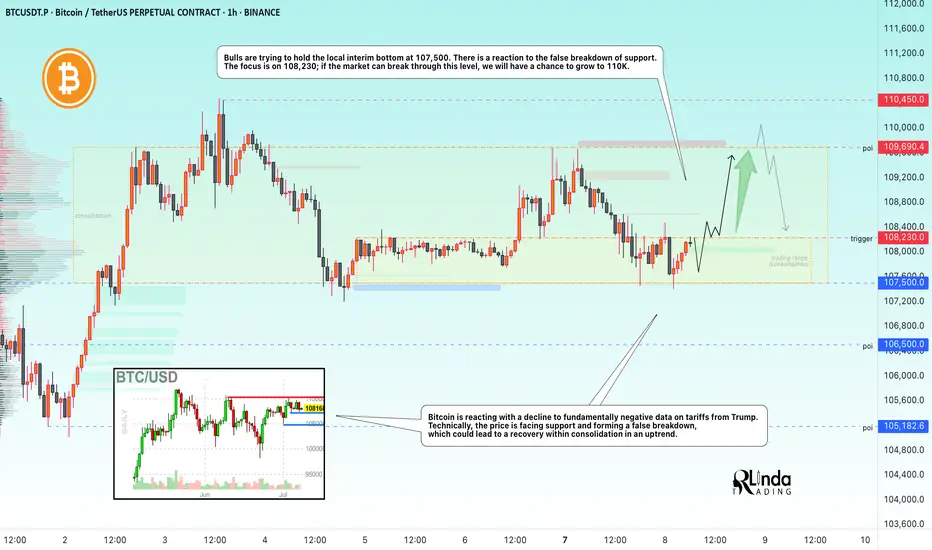
BITCOIN → Market manipulation. Chance for growth to 110KBINANCE:BTCUSDT , as part of a correction triggered by negative news from the US regarding tariffs, is testing liquidity in the support zone. There is a chance of recovery to 110K.
Bitcoin is reacting with a decline to fundamentally negative data on tariffs from Trump. Technically, the price is facing support and forming a false breakdown, the purpose of which was to capture liquidity. This could lead to a recovery within consolidation in an uptrend, but again, there are conditions...
Countries that have received notification of tariffs are responding positively to cooperation (if this trend continues, Bitcoin could receive a local bullish driver).
The market perceives this as positive, and after liquidity is captured, the price could recover to the resistance of the trading range.
Resistance levels: 108230, 109690
Support levels: 107500, 106500
Bulls are trying to hold the local interim bottom at 107500. There is a reaction to the false breakdown of support. The focus is on 108230; if the market can break through this level, we will have a chance to grow to 110K.
Best regards, R. Linda!
AUD/USD Struggles at ResistanceAUD/USD is now nearly 1.6% off the highs with the weekly opening-range taking shape just below Fibonacci resistance- looking for a potential breakout in the days ahead.
A look at Aussie price action shows AUD/USD reversing pitchfork resistance with the weekly opening-range taking shape just below resistance at the 61.8% retracement of the 2024 decline / weekly open at 6550/53- looking for a reaction off this mark.
A top-side breach of the weekly opening-range exposes the upper parallel again, currently near ~6600. Ultimately, a close above the September low at 6622 is needed to fuel the next major leg of the advance with subsequent resistance objectives eyed at the 2019 low at 6671 and the 78.6% retracement near 6723.
Initial support rests with the June low-day close (LDC) at 6458- note that the 75% parallel converges on this threshold into the close of the week and a break / close below would threaten a larger Aussie pullback. Subsequent support objectives rest at the 200-day moving average (currently ~6411) and 6332/62- a region defined by the 38.2% retracement of the yearly range, the April / August 2024 lows, and the May swing low. Losses beyond this threshold would suggest a more significant high is in place / larger reversal is underway.
Bottom line: The Aussie rally failed into the trendline resistance with the monthly opening-range taking shape just below. While the broader outlook is still constructive, the advance remains vulnerable here and the immediate focus is on a breakout of the weekly range (6486-6553) for guidance. From a trading standpoint, losses would need to be limited to 6458 IF Aussie is heading for a breakout on this stretch with a close above 6622 needed to mark uptrend resumption.
-MB

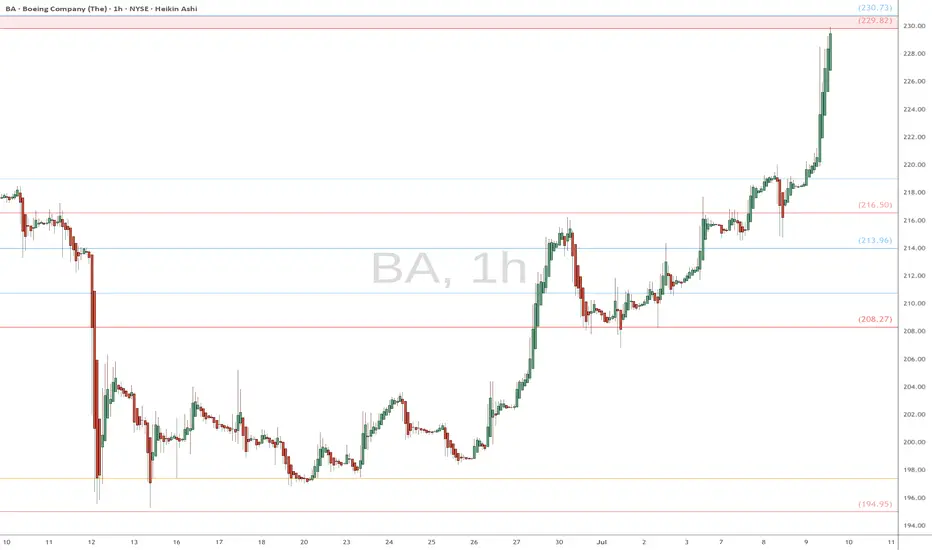
BA heads up into $230: Strong fib zone might cause a serious dipBA has been flying (lol) from its last crash caused crash.
About to test a signrificant resistance at $229.82-230.73
Expect at least some "orbits" or a pullback from this zone.
.
Previous analysis that caught THE BOTTOM:
==================================================
.
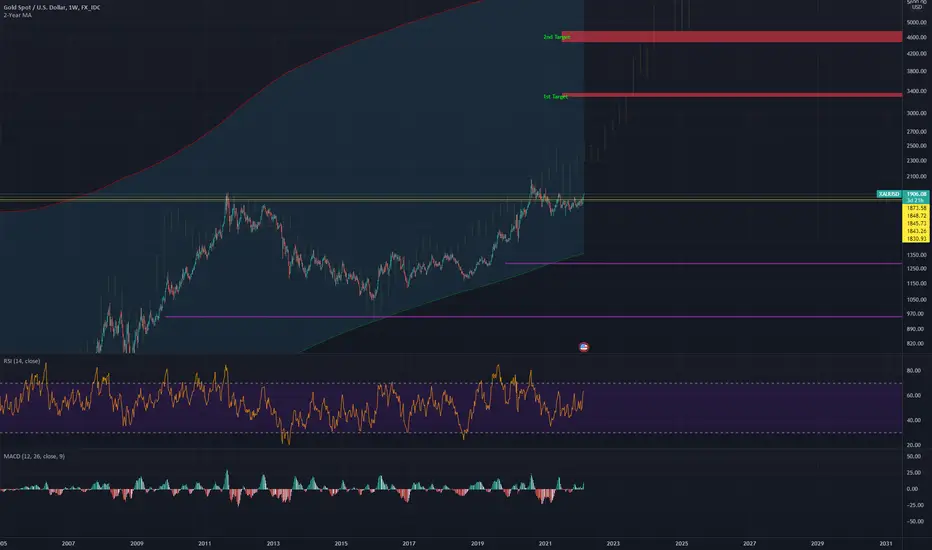
XAU/USD to $3300Historical price action, fractals, and fib extensions suggest $3300 target for XAU/USD
Gold’s Bullish Range Holds – Is This the Dip to Buy?With tensions easing in the Middle East and risk appetite moderating, gold has settled into a bullish daily range. The metal recently broke a key high, confirming its upward momentum, but now appears to be consolidating. The central question is whether gold will break lower for a deeper correction or whether this is merely a pause before the next leg higher.
Reduced geopolitical risk has tempered the “risk-on” rally in gold, but the metal remains firmly within a bullish daily range. This indicates that the underlying bid has not disappeared—only short-term speculative flows have adjusted.
Gold recently breached a protected high—likely a higher high or significant resistance level—reinforcing the prevailing bullish momentum. A pullback into imbalance or demand zones is anticipated; however, if a catalyst emerges, price could resume its advance from current levels, with the 0.328 Fibonacci retracement acting as a strong support.
Meanwhile, the DXY is exhibiting signs of a pullback but lacks the fundamental drivers necessary to sustain a broader rally.

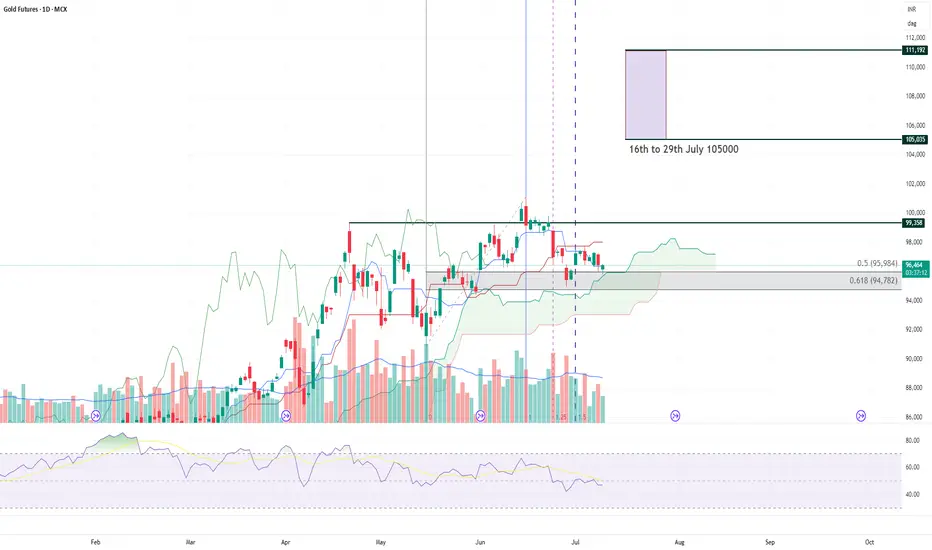
Gold MCX Bullish MoveGold as long as it is staying above the ichimoku cloud it can show a bullish move from here within a few days.. this month we can expect some movement on the upside clearing highs.
Stop loss can be kept near 94700-95300 levels with target of 102000 - 105000 with this month.
Bullish time on December this year 2025be ready for a price drop and bearish volume, the chart showing how it keep reject that down trend (green line) I don't think we will break through this time, just be ready for the market tricks.
