30M Insight: EURUSD Buy Limit ReadyGood Mornıng Traders;☀️
Based on a 30-minute analysis, I’ve identified a shift in EURUSD market structure. I’ll be waiting for price to reach my level with a buy limit order.
📥 BUY LIMIT ORDER: 1.17180
🛑 STOP LOSS: 1.16946
🎯 TP1: 1.17275
🎯 TP2: 1.17412
🎯 TP3: 1.17649
📊 Risk / Reward Ratio: 2.00
Patience meets precision. Let the market come to you.
🧠 Master your mindset with iron discipline.
Never fear the trade—let the trade fear you.
Keep your motivation high and your focus sharper than ever.
-----
Your likes and support are what keep me motivated to share these analyses consistently.
Huge thanks to everyone who shows love and appreciation! 🙏
Fibonacci

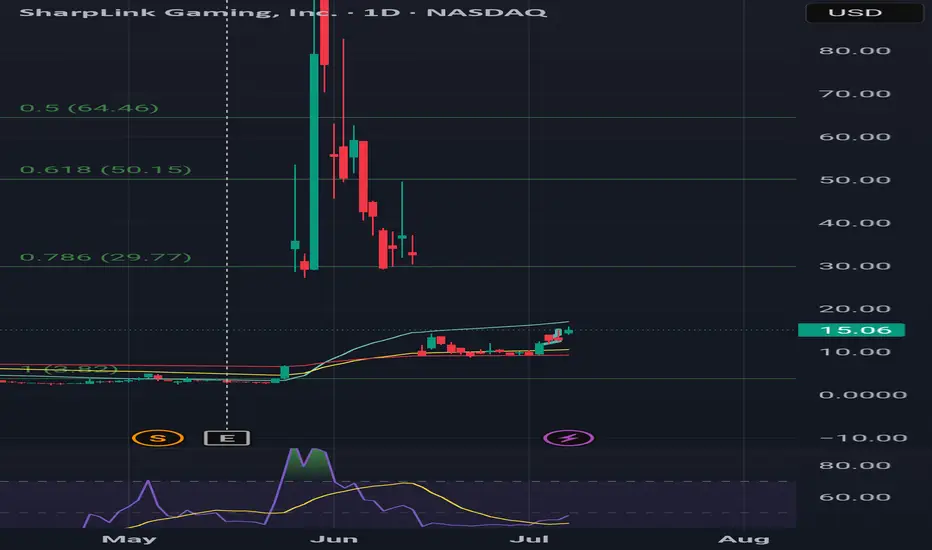
$30 easy by 2026I'm holding the 1/16/26 25C those are the highest and furthest out options you can get on hood. Bought at 1.55 on 7/2 now worth 3.30 good entries if eth pulls back would be 12 and 10 best case. I see this running quick I will sell atleast half at 30. They hold and are staking over 500M worth of eth largest amount for any publicly traded company, yeild will be great for them but they are obviously selling shares to purchase eth so there's plenty of risk company only has 5 employees according to hood still under 1B last time I checked. 50ma is around 16 should be a clear path to 30 maybe psychological resistance at 20.
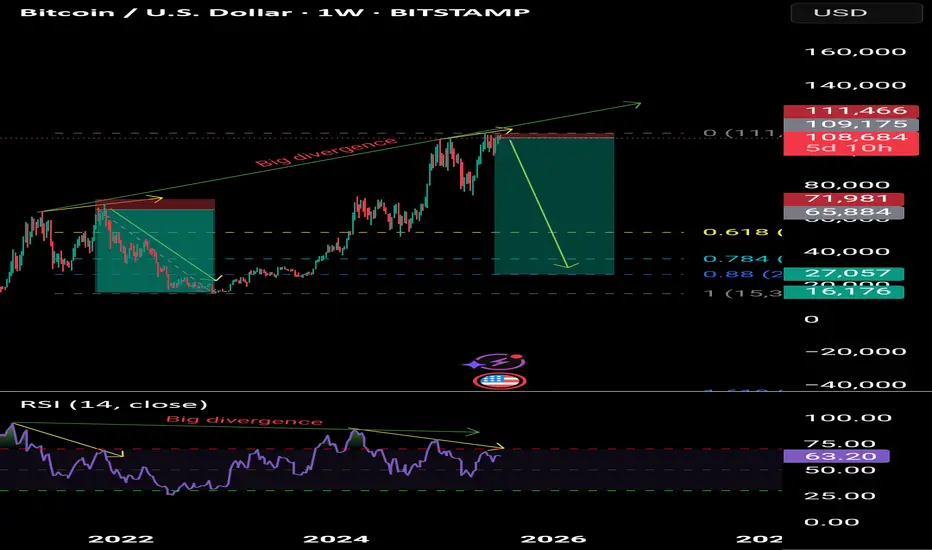
Bitcoin to the 30,000 levelBitcoin to the 30,000 level
On the weekly time frame, there is a negative divergence of Masoud and the winner is the one who keeps her sell trade below 30,000.
Gold Long: the video explanationHere I discussed how I came out with the completion of the correction for Gold and explain why it may be a good idea to set the stop loss slightly lower.

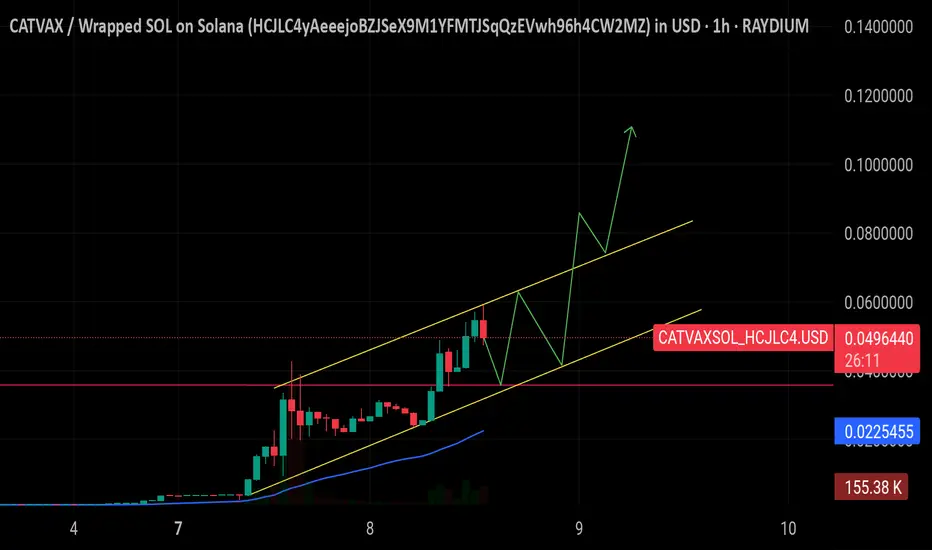
$CATVAX – The Unstoppable Meme Monster! 🚨
Against all odds and without a single active dev, $CATVAX has exploded +6000% in just two weekly candles, powered purely by its insanely bullish community. 📈 With no dev wallets, there’s zero rug risk, making it one of the purest community-driven pumps we’ve seen in the Solana ecosystem. 🔥
Currently riding a perfect ascending channel with strong bullish continuation signs, this is now the hottest meme pair on DEXTools — and price action suggests there’s still more upside to come. As long as it respects the lower trendline, the rocket’s still fueled. 🚀
This isn’t just a pump — it’s a movement. $CATVAX is the meme coin to watch right now. 💥
🔗 Live Chart : dexscreener.com
📜 Token CA: EVDoPXkWNRMc7fQirg7emNdc17KNqsCyzVi4mWPmDvni
🚨🚨DYOR and buy at your own risk. ⚠️🚀
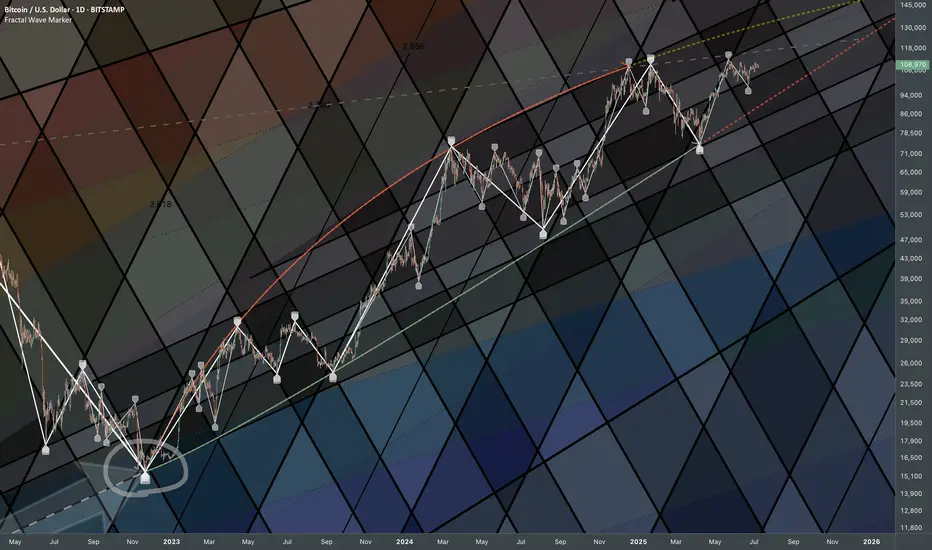
Bitcoin: Integration of Major BottomsUpdating former discovered connection from closeup.
Covid Low - 2022 Bottom
Using direction for fib channels
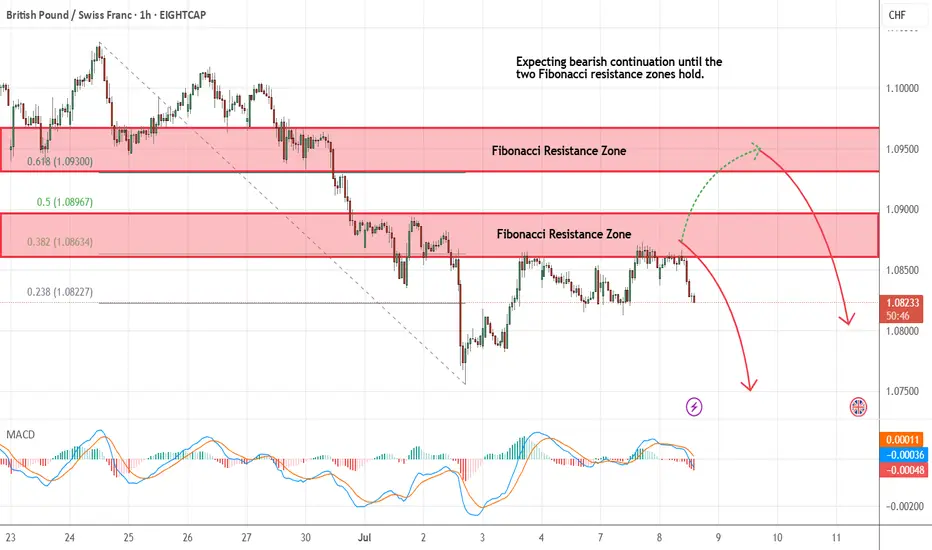
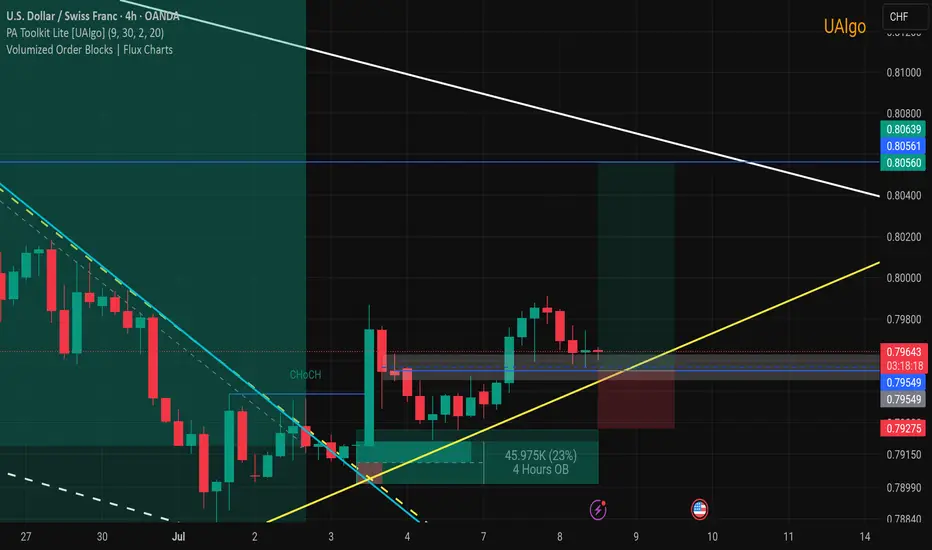
GBPCHF - Looking To Sell Pullbacks In The Short TermM15 - Strong bearish move.
No opposite signs.
Currently it looks like a pullback is happening.
Expecting bearish continuation until the two Fibonacci resistance zones hold.
If you enjoy this idea, don’t forget to LIKE 👍, FOLLOW ✅, SHARE 🙌, and COMMENT ✍! Drop your thoughts and charts below to keep the discussion going. Your support helps keep this content free and reach more people! 🚀
--------------------------------------------------------------------------------------------------------------------
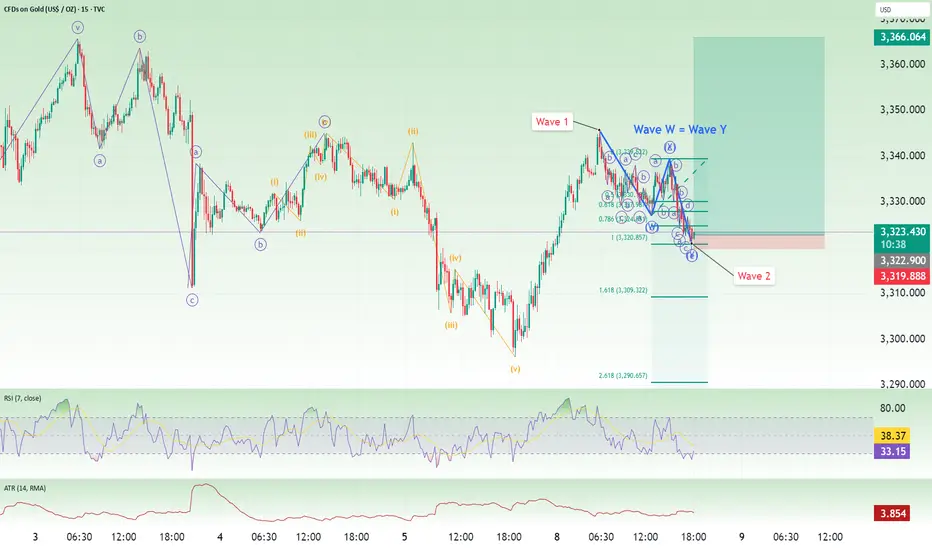
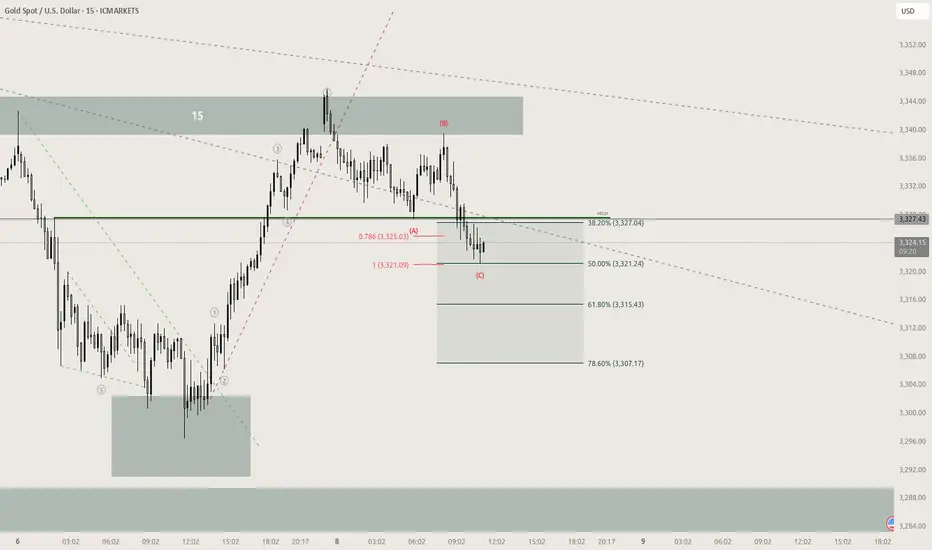
GOLD continuation setupGold reached the 100% extension for a C wave correction after a 5 wave move to the upside, additionally 50% retracement of that 5 wave move 2 very good confluences for a continuation buy
Bulls buyNB: Overall trend is still sells as we have a resistance line for sell area. Currently we ride the buys as its forming a flag. Any break bellow the flag resistance line indicate end of the flag hence we enter sells.
Trade cautiously
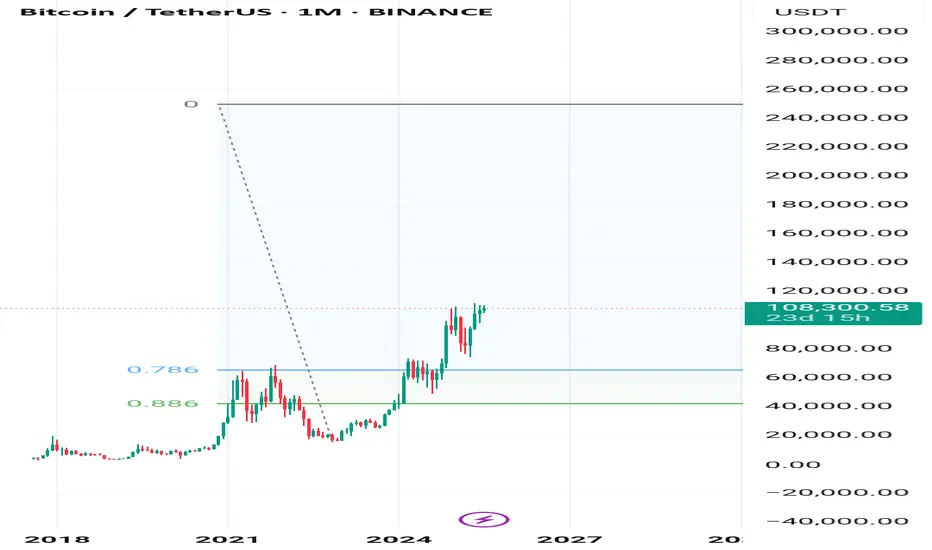
Like the previous cycles!Our basis is the Fibonacci retracement with 78%. The 78% level should be aligned with the previous peak.
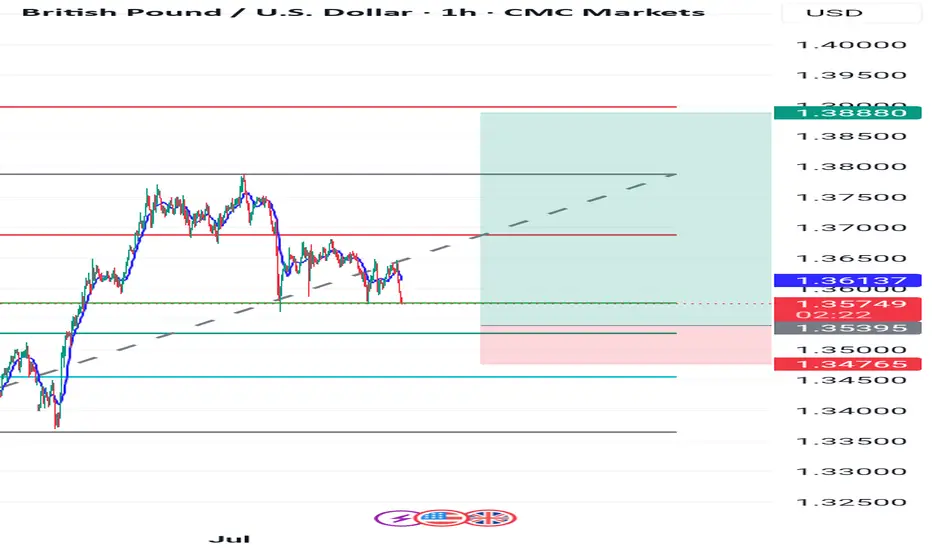
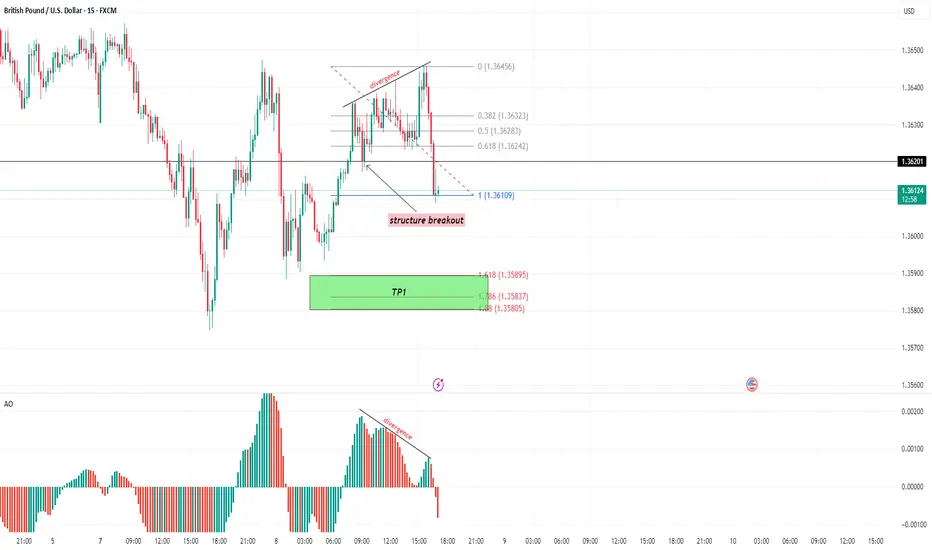
GBP/USD – Bearish Shift Confirmed | Structure Breakout + AO DiveThe market just gave us a textbook setup on GBP/USD!
🔍 Analysis Overview:
A clear bearish divergence has formed between price and the AO (Awesome Oscillator), signaling potential trend exhaustion at the top.
We saw a rising wedge break to the downside, with a structure breakout confirming a shift in momentum.
Price decisively broke below the 1.36109 support level, indicating bearish control.
📊 Technical Confluence:
AO shows bearish divergence, confirming weakening bullish momentum.
Structure breakout from the wedge pattern aligns with AO signals.
Fibonacci retracement and extension levels give a clear target zone:
🎯 TP1 area: 1.35805 – 1.35895 (Fib 1.618–1.786 extensions)
⏳ What I'm Watching:
I'm now waiting for a pullback to retest the broken structure (possibly around the 0.382–0.618 Fib levels: 1.36242–1.36323). A bearish reaction here could provide a high-probability reentry opportunity.
💡Trade Idea Summary:
Bias: Bearish
Signal: Divergence + Structure Break
TP Zone: 1.35805 – 1.35895
Watch for: Pullback to retest broken structure before continuation
📈 Stay alert and manage your risk wisely!
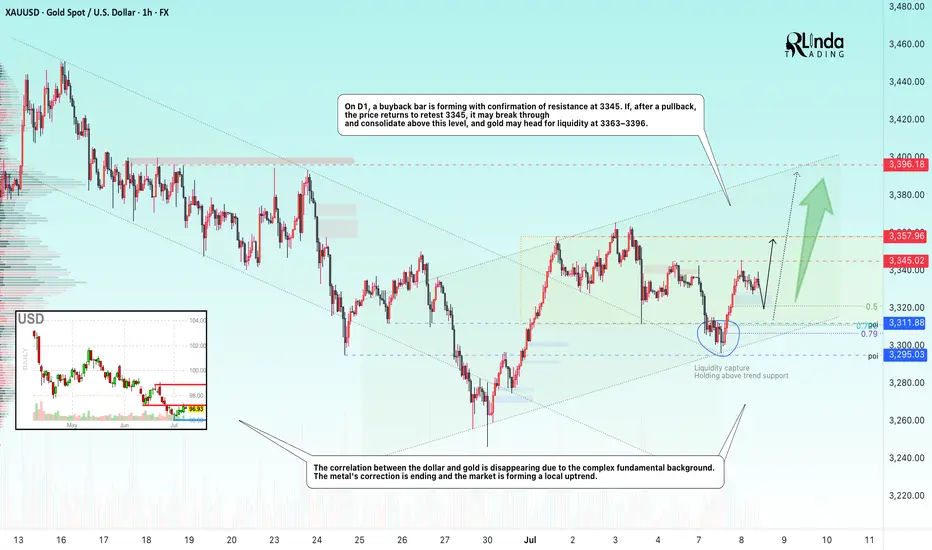
GOLD → Correction for confirmation before growthFX:XAUUSD is recovering due to increased demand as a safe-haven asset. After breaking through local trend resistance, an upward channel is beginning to form on the chart.
On Monday, gold tested the 3295-3300 zone (liquidity zone) and, against the backdrop of incoming economic data, is buying back the decline, forming a rather interesting pattern that could lead to continued growth, but there is a but!
Investors are reacting to President Trump's threats to impose tariffs on imports from a dozen countries starting August 1. In addition, the main question is the Fed's interest rate decision. The regulator is likely to leave the rate unchanged due to inflation risks.
Uncertainty surrounding tariffs is supporting interest in gold as a safe-haven asset. The market is awaiting further news and the publication of the Fed minutes on Wednesday.
Resistance levels: 3345, 3357, 3396
Support levels: 3320, 3311, 3295
A correction to support is forming. If the bulls hold their ground within the upward channel and above the key areas of interest, the focus will shift to 3345, a resistance level that could hold the market back from a possible rise. A breakout of this zone would trigger a rise to 3357-3396.
Best regards, R. Linda!
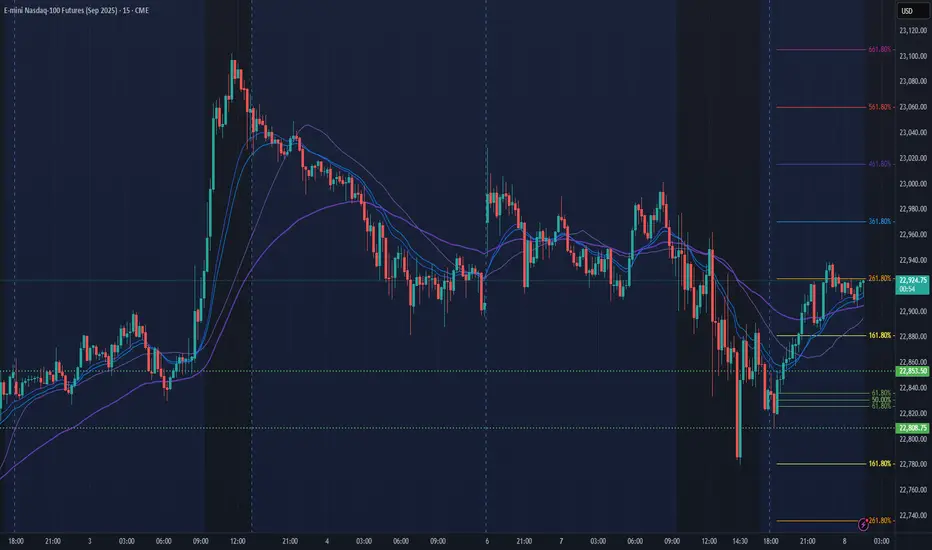
NQ Power Range Report with FIB Ext - 7/8/2025 SessionCME_MINI:NQU2025
- PR High: 22853.50
- PR Low: 22808.50
- NZ Spread: 100.5
No key scheduled economic events
Session Open Stats (As of 12:25 AM 7/8)
- Session Open ATR: 318.85
- Volume: 24K
- Open Int: 269K
- Trend Grade: Neutral
- From BA ATH: -0.8% (Rounded)
Key Levels (Rounded - Think of these as ranges)
- Long: 23239
- Mid: 21525
- Short: 20383
Keep in mind this is not speculation or a prediction. Only a report of the Power Range with Fib extensions for target hunting. Do your DD! You determine your risk tolerance. You are fully capable of making your own decisions.
BA: Back Adjusted
BuZ/BeZ: Bull Zone / Bear Zone
NZ: Neutral Zone
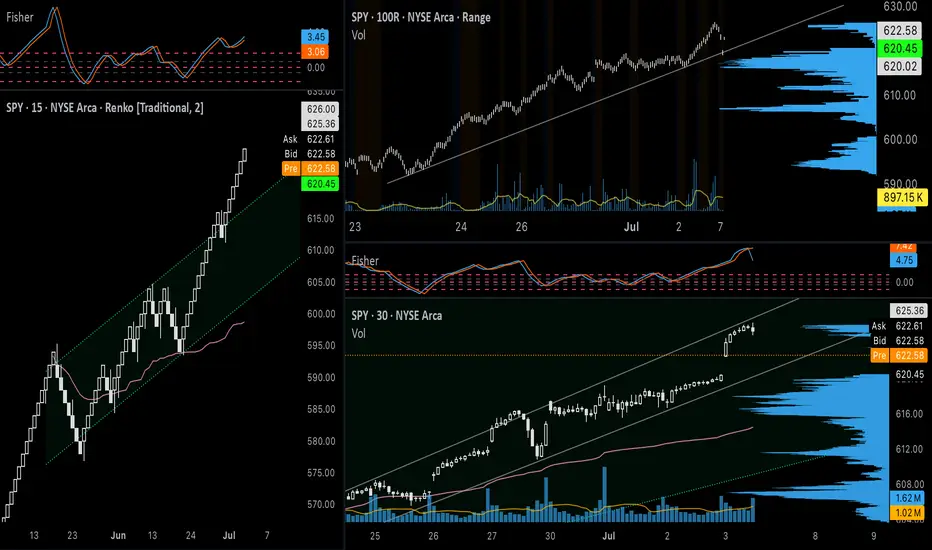
SPY July 7th 2025SPY July 7th 2025
Day 1 of journaling my day trades on SPY. I am going to start journaling my ideas every night if possible in order to fine tune my setup and to analyze my wins and losses. I will be using Renko (Traditional, 2 box size, 1m) as my main chart, Range Bars (50R, 100R, 200R, or 500R), and candle sticks (various timeframes) to identify supply/demand, price ranges, and trends - placing a high emphasis on volume as it applies to the Wyckoff Method. I will also occasionally refer to real time options charts and VIX, however I will primarily use those for my entries during the day.
Each day I will provide setups for a bullish and bearish bias, which should help minimize instances where the price moves against me - with slow reactions leading to holding losing trades and hesitating to enter a trade on the side of the new trend. I’ll try to come up with a consistent format as time goes on. For today, I will go down the list of my indicators and provide notes that fit the bias of each trading strategy.
+++++++++++++++++++++++++++
Bullish Analysis
Renko: Strong breakout from ascending channel on June 30. Fisher Transform is signaling continuation. A retest of the top of the channel would take the price back to ~$618.
100R ($1) Chart: Price is in an uptrend being supported by high volume. 34VWMA (purple) is above 200MA (green). The bounce on July 2nd (around $616) was supported by a high volume node, indicating genuine interest pushing the price higher.
30m Chart: Price closed on July 3rd at the top of an ascending channel inside of a larger ascending channel. Since the larger ascending channel is one of strength, it can be assumed that the smaller one is a sign of strength as well. A break too far below the lower end of this smaller channel would be a sign of weakness, which does not seem to fit the current market structure after last week’s breakouts, but it is still possible that the trend fails. Fisher transform is forming a “hook” pattern that can signal continuation.
+++++++++++++++++++++++++++
Bearish Analysis
On a smaller scale, the price appears due for a pullback, which can fit both the bullish and bearish trading ideas depending on where the market opens.
Renko: The price closed at the top of an ascending channel on July 2nd and will find more buyers upon a test of the lower band and the anchored VWAP.
50R (50¢) Chart: If the price pulls back to the bottom of the channel (around $620) this would coincide with a retracement of 0.618 - which is a key fib level. A break below the 1.00 extension ($616) could signal a break of the uptrend - a $9+ drop if an entry can be found near the top of the channel, not too bad.
5m Chart: The price left a gap down to $620 on July 3rd. Filling this gap could provide important liquidity to propel the price higher. Additionally, The high volume at the start and end of Thursday’s flat trading day (with low volume in between) could be a sign of accumulation or lack of sellers.
1DTE ATM Put, 2m: If a more prolonged (and profitable) downward move is expected from smart money, we should see volume increase for ATM puts during the session. Depending on where things open, we could see a potential spring/false bearish breakout (below $2.20), or a true bullish breakout (above $2.80). Using an options calculator, $623.75 on AMEX:SPY would set up the Spring and a drop below $622.50 could confirm the put breakout.
+++++++++++++++++++++++++++
Targets
Calls: Enter $618-$620, Target $625-$628, Stop Loss $617.75
Puts: Enter $623-$625, Target $620, Stop Loss $626.25
To conclude, overnight action on CME_MINI:ES1! and the gap up on TVC:VIX shows that the price is already retracing. The top of the wedge for VIX would be just above $20 - a key level to watch for a reversal. Unless the upper part of the channel on SPY is tested and rejected again after the open, I will sit out and wait to hit the bullish targets. We are still in a strong uptrend after last week’s breakouts, so going short is the riskier bet anyway, as buyers could step in at any time.
Looking at ATM calls and puts side by side (bottom two charts), it is clear that calls were not heading into today with a good setup. It would be worth taking a chance on puts if a Spring forms (below $2.20), which, again, would correlate with AMEX:SPY hitting $623.75 during the session - and not much higher.
My main idea for the start of this week is to look for a good pullback for calls, so I will be patient and will try not to force anything. If smart money has a bullish sentiment, there will still need to be a short accumulation phase for calls so I will watch to see what the chart is doing for ATM calls around $620.
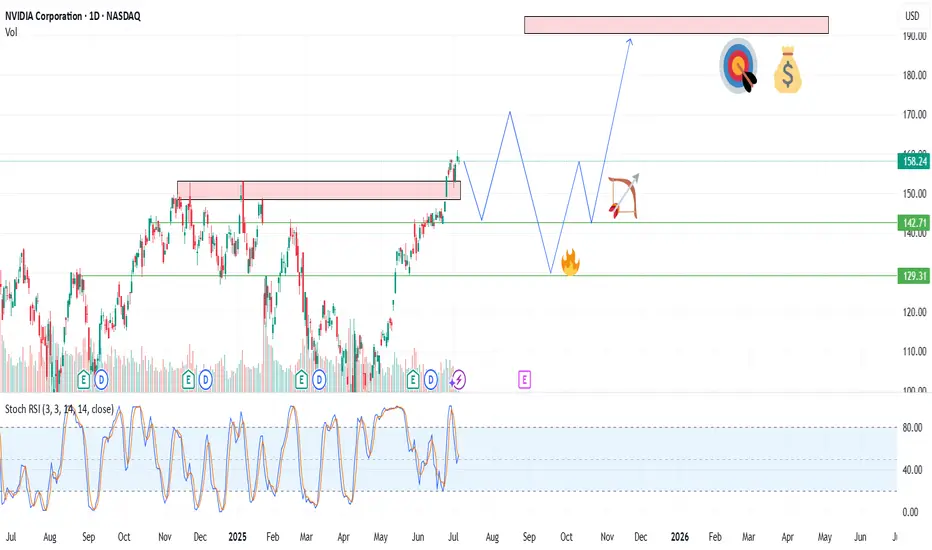
NVIDIA (NVDA)-Trade PlanNVDA, After an explosive run powered by GenAI infrastructure and bullish earnings, the chart is setting up for either a bullish continuation or a healthy pullback.
With volatility tightening and volume compressing, this is a great moment to prepare for either breakout or breakdown scenarios.
🎯 Trade Plan – Tiered Long Setup
📌 Entry Zones (Tiered Buying):
🔹 $150
🔸 $140
🔻 $120
📈 Profit Targets:
TP1: $160
TP2: $175
TP3: $200+ – Long-term continuation play if AI macro momentum persists
📌 DISCLAIMER: This idea is for educational purposes only. Always use proper risk management and assess your own strategy
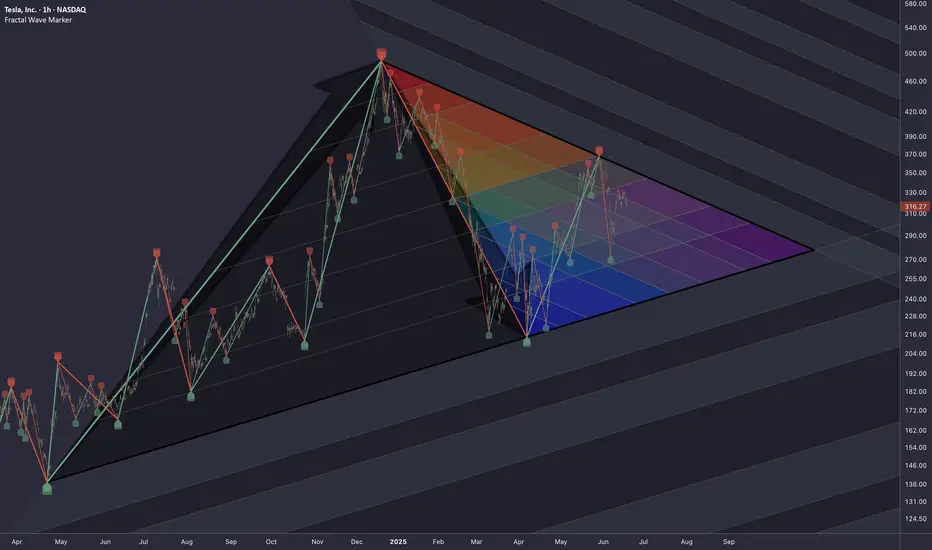
TSLA: Triangle PatternResearching the market through structural lens, particularly the topology of trapped liquidity buildup and compression of volatility, that leads to a proportionally heavier move once a breakout occurs.
Raw compression area derived from waves of higher degrees (2nd, 3rd)
The longer price consolidates within boundaries of a triangular formation, the more significant the breakout tends to be.
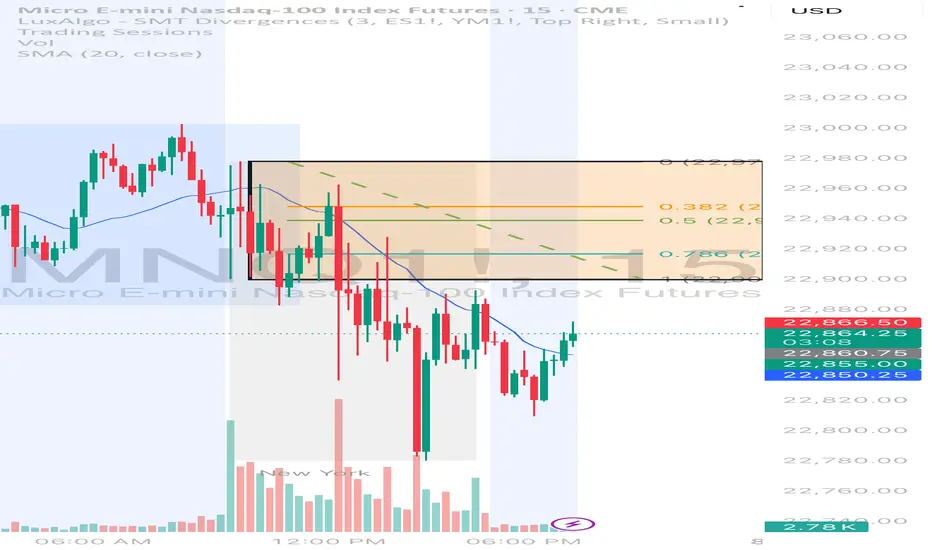
From daveteaches 001Waited 9am - 10am
Give a 9am 1 hr candle zone with Fibonacci level.
Slight pullback from 0.3 and all the way down.
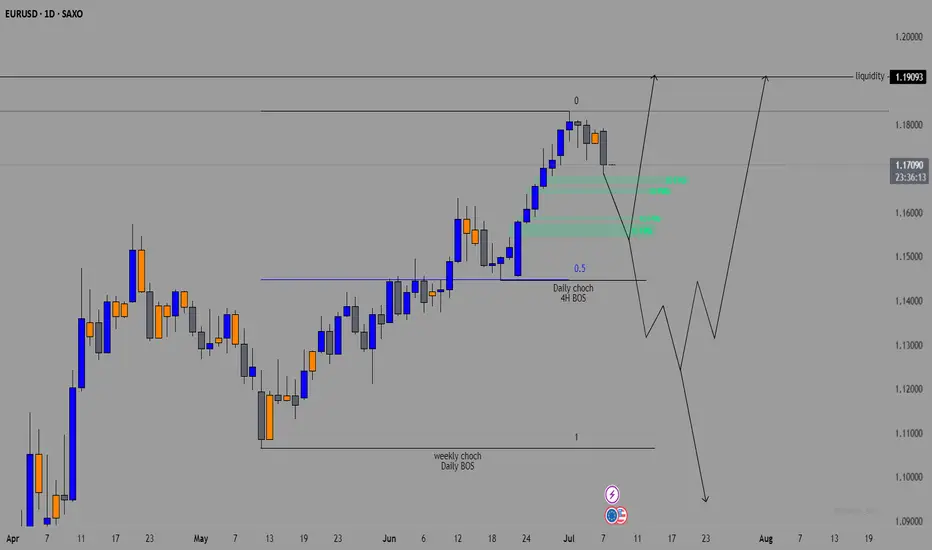
EURUSD OUTLOOK 8 - 11 JULYNFP and unemployment rate came out bullish for the dollar which caused that big push to the down side. The job market is still holding well thus we are less likely to see the FED cut rates.
Other economic data is still showing that the dollar is weaker against the euro so I'm not going to change my direction bias just yet. Technical analysis also clearly shows that we are still bullish on EURUSD.
We don't have much fundamental data coming out this week so I'm anticipating price to continue lower to give a deeper pullback off of last weeks data, Then next week depending how CPI, PPI and Retails sales go we will get a clearer picture on how to trade the pair.
Last week's 4H outlook is still valid and is more useful when looking to execute trades. This daily Analysis just gives the bigger picture for more of a swing setup analysis
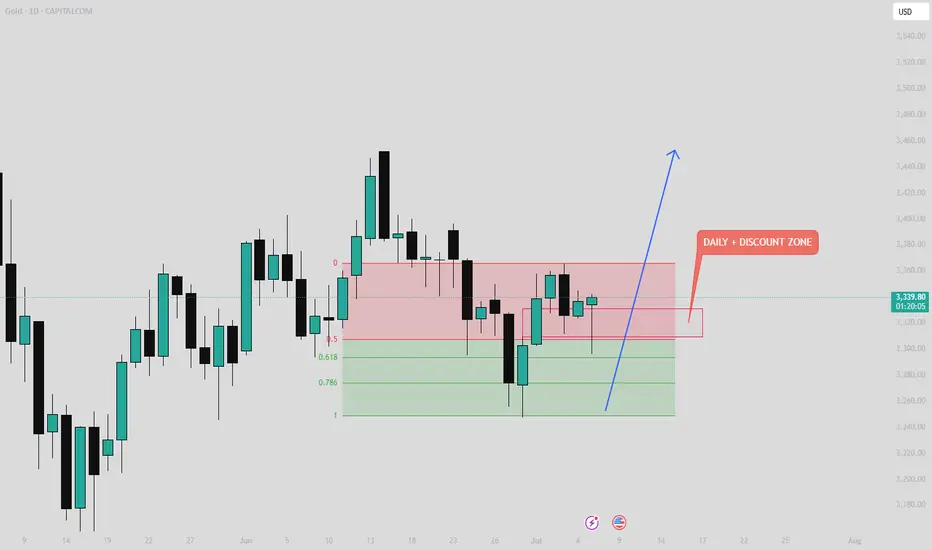
GOLD Analysis – Weekly Outlook GOLD Analysis – Weekly Outlook 🟡📈
Price has just tapped into our Daily PD Array, precisely the Fair Value Gap (FVG), which was clearly marked. It also entered the discount zone, aligning with our bullish bias.
Additionally, we’ve seen a liquidity sweep, followed by a strong bullish reaction — a classic sign of smart money accumulation.
📍 Key Targets:
First Target 🎯: 3396
Second Target 🎯: 3451
As long as price holds above this zone, we expect the bullish move to continue. Let’s see how it unfolds over the coming sessions.
🔔 Follow for more weekly insights.
📊 See you next time!
#Gold #XAUUSD #TradingView #SmartMoneyConcepts #FVG #LiquiditySweep #PriceAction #MarketAnalysis
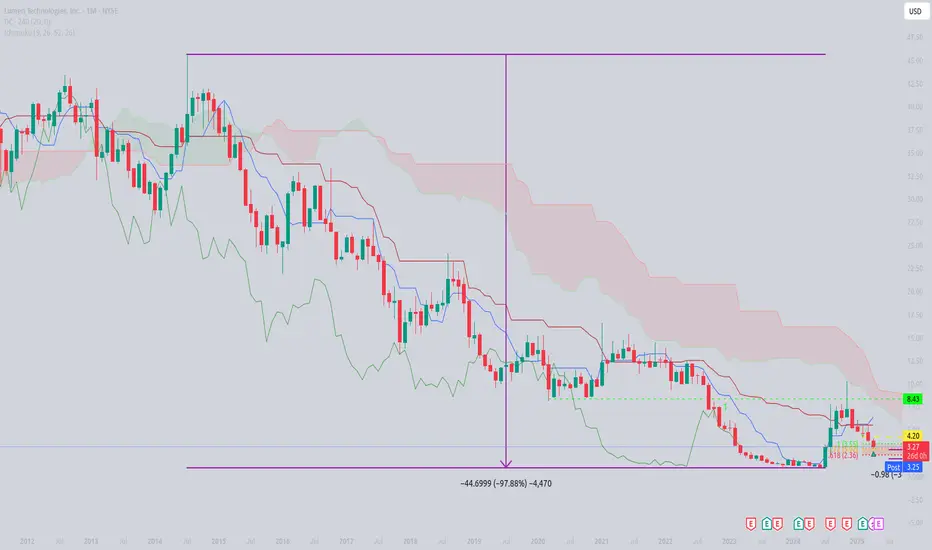
Outbreak RetracedA 9 months bottom building was followed by a stormy rise and almost tripled prices.
This rise was to fast and could not digested by the market, i.e. it was followed by an also fast retracement down.
Now the market may be in an equilibrium and we can have a closer look to the long term picture.
Since 2014 the stock has lost over 97 % of its value. From a respectable stock it has turned into a penny stock.
This may open chances for buyers. Of course Idon't see an upward correction of the 11 year long loss but even if we only can test the November 2024 level and reach the Ichimoku cloud this would be a gain of far over 100 %. By the way this would also be the previous bottom of 2022 and a natural resistance.
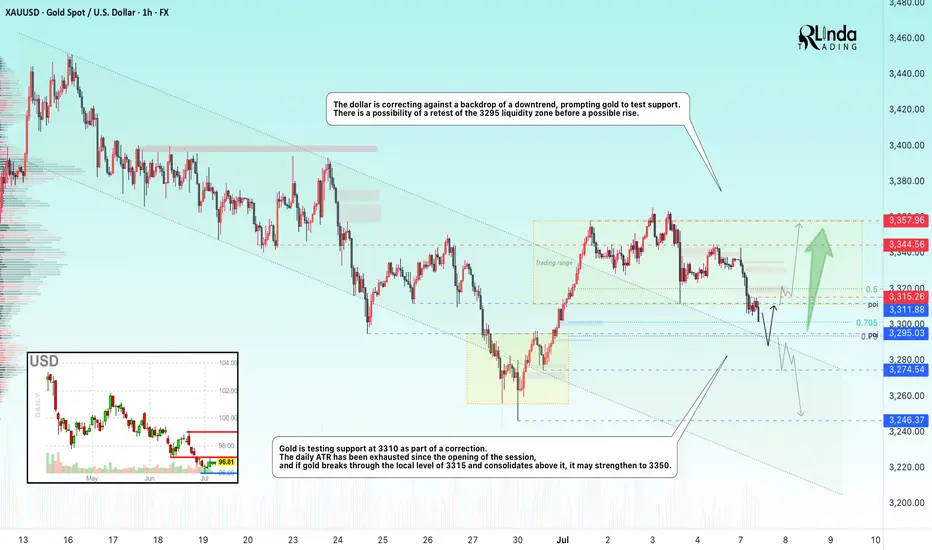
GOLD → Buyers are hesitant due to new tariffsFX:XAUUSD continues its correction phase after updating local highs and breaking through trend resistance. The dollar is making traders nervous...
After rising 2% last week, gold started Monday with a decline to $3,300 amid a stronger dollar due to the risk of new tariffs from Trump, who sent letters to 12 countries threatening to impose duties of up to 70% if no agreements are reached by July 9. This boosted demand for the dollar as a safe-haven asset.
Gold is also under pressure from strong US employment data, which has dampened expectations of a rate cut. The market is focused on news on tariffs and the publication of the Fed minutes on Wednesday, which may clarify the outlook for monetary policy.
Technically, the correction may end in the 0.7 Fibonacci zone, in the range of 3295-3300. After the formation of a reversal pattern, the market may strengthen to 3350-3360.
Resistance levels: 3315, 3344, 3358
Support levels: 3300, 3295
Locally, the price is trying to consolidate below the range, which could lead to a decline to 3300-3295. If, during the correction from support, the market manages to consolidate above 3315, we can expect growth. Otherwise, a weak reaction at 3295 could lead to a retest of 3275 and consolidation in the selling zone, which could lead to a further decline to 3245 .
BUT! We are closely monitoring the position of the US and Trump on tariffs, as he is once again issuing ultimatums to countries, to which the markets are reacting...
Best regards, R. Linda!