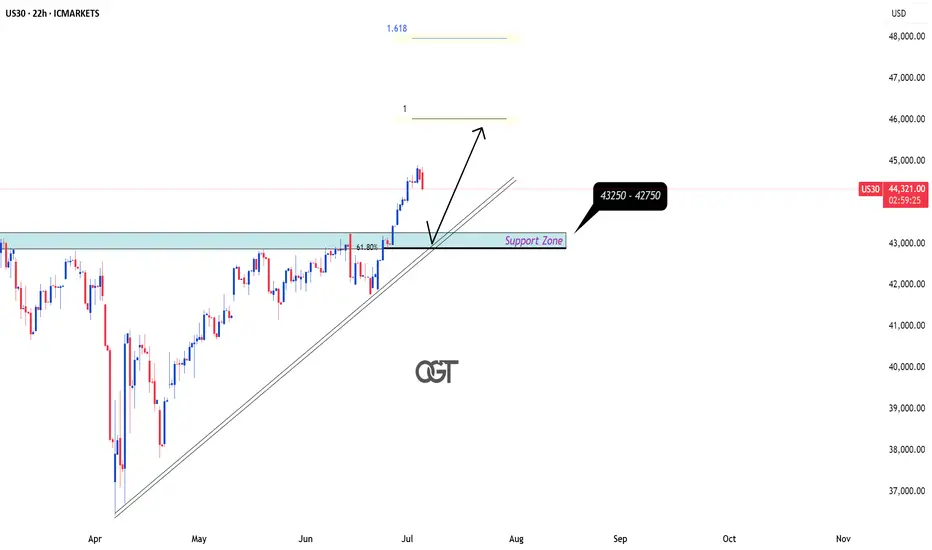
US30: Market in Rally Mode – Prepare for the Next OpportunityWelcome back! Let me know your thoughts in the comments!
** US30 Analysis !
We recommend that you keep this pair on your watchlist and enter when the entry criteria of your strategy is met.
Please support this idea with a LIKE and COMMENT if you find it useful and Click "Follow" on our profile if you'd like these trade ideas delivered straight to your email in the future.
Thanks for your continued support! Welcome back! Let me know your thoughts in the comments!
Fibonacci
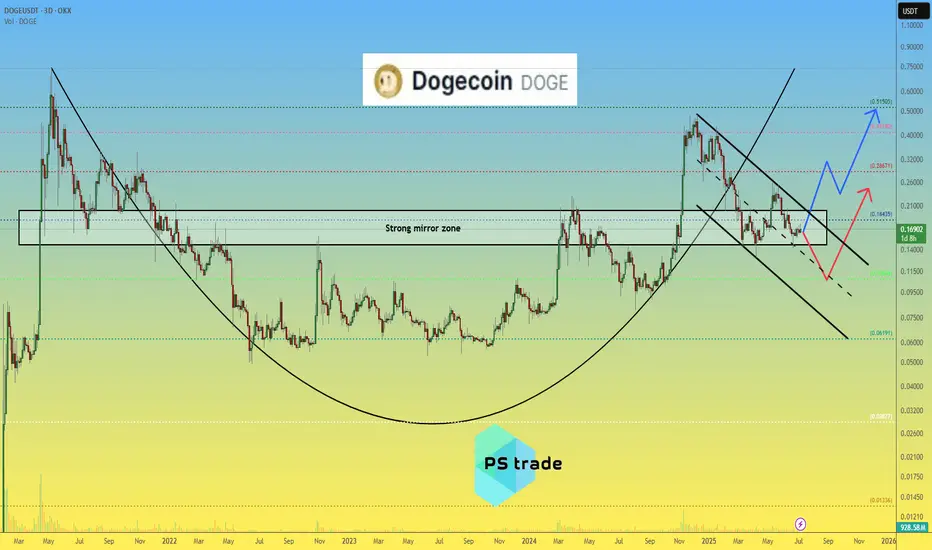
Dogecoin DOGE price analysisCRYPTOCAP:DOGE price is now in the middle of a strong mirror zone of $0.15-0.20
📈 It looks like the position is now accumulating, forming a "double bottom" and then, only a way for growth, to the highs in the region of $0.45-0.50
🐻 On the other hand, the scenario of another "leg" down fits perfectly into the TA canons. That is, it is very likely that if the price of OKX:DOGEUSDT drops below $0.15, then it is already fall to $0.10)
P.S.:
#Doge is an interesting asset, it is worth watching with one eye, and with the other eye, watch how the "battle" between Trump and Musk (who is the main influencer and "pumper" of #Dogecoin) will end.
💡 And then put the two pieces of information together and make a trading decision - "easy money" !)
_____________________
Did you like our analysis? Leave a comment, like, and follow to get more
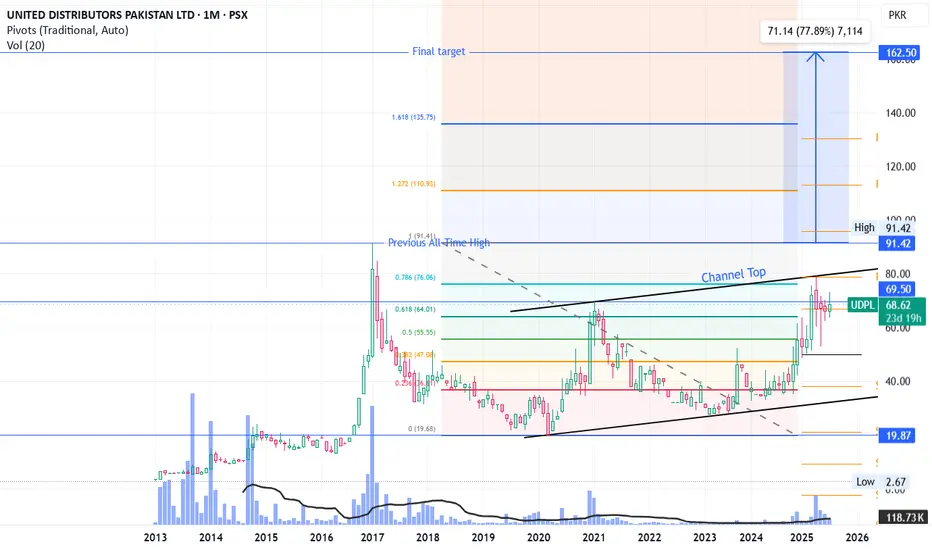
UDPL LongUDPL has very strong fundamentals (P/E: 2.3, EPS: ~30)
Its a dividend paying stock as well.
It is building cup and handle formation with the channel top line working as major resistance.
It took a correction from Fib 0.786 level of previous all-time high.
Once 80 (Channel top line) is broken, we can see it moving towards 91 which is its previous all-time high.
Ultimate targets are shown in the chart.
Monthly RSI is ~70 and ADX in 30s, showing a building momentum.
Its not a buy / sell call, just my personal opinion.
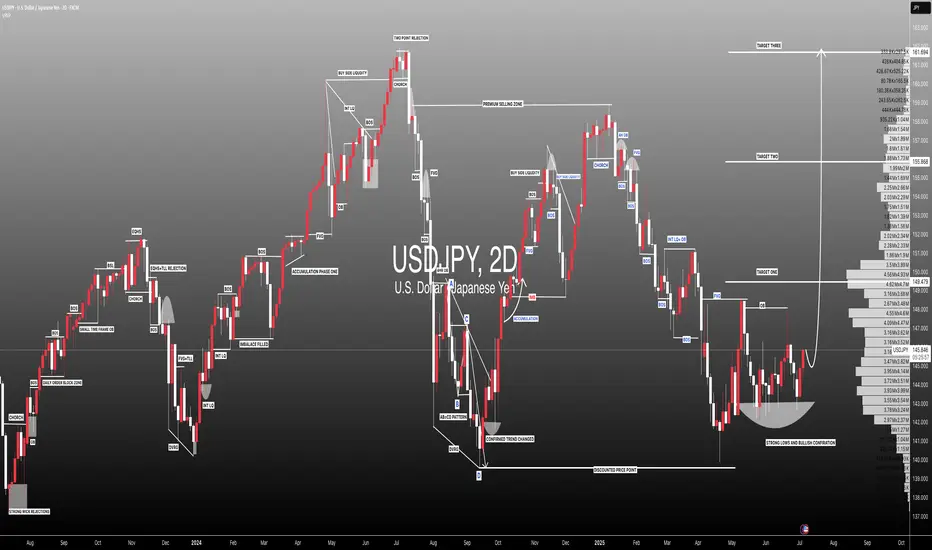
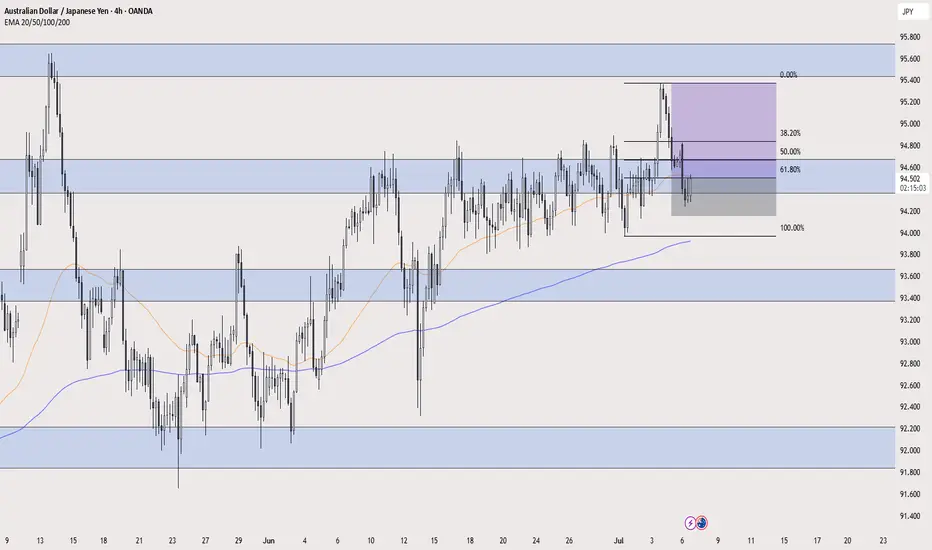
USDJPY Price Accumulated|Time For Bullish Distribution|Setupsfx|The price has accumulated nicely and is now distributing. We have three targets in mind, but set your own based on your analysis. Our approach is purely technical, but also includes a basic fundamental approach. This analysis concludes over 1500 pips and is a swing move. Please use this analysis as educational purposes only, as it does not guarantee that price will move exactly as predicted.
If you like our idea, please consider liking and commenting on it.
Good luck and trade safely!
Team Setupsfx_
AUDUSD - RBA Rate Cut and Tariff Deadline in FocusIn a week that is light on economic data and events, with a heavy emphasis towards what happens next once President Trump’s 90-day tariff pause ends on Wednesday (July 9th), the AUDUSD currency pair has more than most for traders to focus on.
This is due to the fact the RBA, the Australian central bank, decides early Tuesday morning (0530 BST) whether to cut interest rates for the third time in a row from 3.85% to 3.6%, as is widely expected by markets, given that inflation has eased in recent months back into the RBA’s 2-3% target range. This announcement is closely followed by the RBA press conference (0630 BST), which could also be an important influence on the direction of AUDUSD depending on the comments Governor Bullock makes regarding future rate moves, economic growth and tariffs.
In terms of trade tariffs, President Trump last week suggested that he is unlikely to extend the 90 day pause, although he has changed his mind before. He also indicated that letters are being sent to trading partners outlining tariffs of between 10-70% on imports depending on whether he believes the country has been negotiating in good faith or not. These new tariffs are due to go into force on August 1st, so there is potentially still time for more twists and turns in this story and AUDUSD volatility may well increase across the trading week ahead as it plays out.
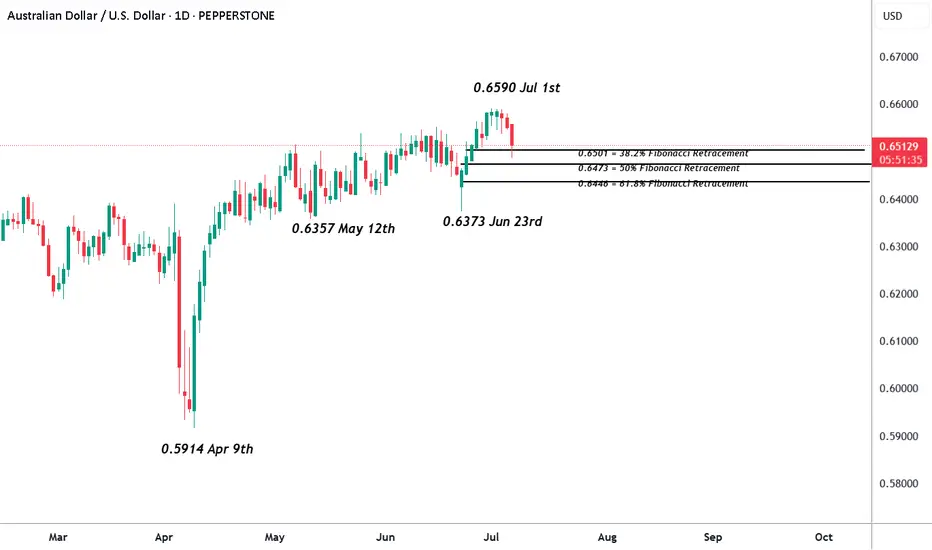
AUDUSD touched an 8 month high at 0.6590 last Tuesday (July 1st) before running into a wall of profit taking and eventually closing the week at 0.6550. Given the risk events facing traders that were just outlined above, this type of price action may not be that surprising.
Looking at how this week has started for AUDUSD, early trading in Asia has seen fresh selling to potential support around 0.6500 (see technical update below), which at the time of writing (0730 BST), is still holding, although bounces have so far been limited.
Technical Update: Preparing For The Week Ahead
With potential for a rate cut in Australia and concerns over tariff news this week, it perhaps isn’t too much of a surprise AUDUSD price corrections are materialising as a reaction to recent strength. While this decline may continue over the short term, traders are perhaps more focused on the potentially positive pattern of higher price highs and higher price lows that have materialised since April 9th 2025, which the chart below shows.
Of course, there is no guarantee this pattern will continue over coming sessions but being aware of support and resistance levels that may hold or exaggerate future price moves may be useful to know in advance.
Potential Support Levels:
After price strength, especially if new recovery highs within an uptrend pattern have been posted, it may prove to be Fibonacci retracement levels that act as support to any future price weakness. Calculating these on the period of price strength seen between May 12th up to the July 1st high, the 38.2% retracement level stands at 0.6501.
With the current setback now moving towards 0.6501 this morning, traders may be watching how this potential support level performs on a closing basis, as confirmed breaks lower might lead to a more extended phase of weakness that could prompt tests of 0.6473, the 50% retracement, even 0.6446, the deeper 62% retracement level.
Potential Resistance Levels:
Having seen new highs recently posted, which was the highest AUDUSD trade since mid-November 2024 (see the chart below), we can look at the weekly perspective to establish the next possible resistance levels.
As the chart shows, the latest AUDUSD activity has recently tested weekly resistance at 0.6550, which is equal to the 61.8% Fibonacci retracement of September 2024 to April 2025 weakness. It should be noted, in a similar way to last week, that it is possible AUDUSD may see trading activity above this 0.6550 resistance, but as we are using a weekly timeframe, it is this upcoming Friday's weekly close above this level that is required to suggest possibilities of a successful upside closing break.
Much will depend on future market sentiment and price trends, but weekly closes above 0.6550 if seen, may lead to further price strength towards 0.6688, the November 2024 high.
The material provided here has not been prepared accordance with legal requirements designed to promote the independence of investment research and as such is considered to be a marketing communication. Whilst it is not subject to any prohibition on dealing ahead of the dissemination of investment research, we will not seek to take any advantage before providing it to our clients.
Pepperstone doesn’t represent that the material provided here is accurate, current or complete, and therefore shouldn’t be relied upon as such. The information, whether from a third party or not, isn’t to be considered as a recommendation; or an offer to buy or sell; or the solicitation of an offer to buy or sell any security, financial product or instrument; or to participate in any particular trading strategy. It does not take into account readers’ financial situation or investment objectives. We advise any readers of this content to seek their own advice. Without the approval of Pepperstone, reproduction or redistribution of this information isn’t permitted.
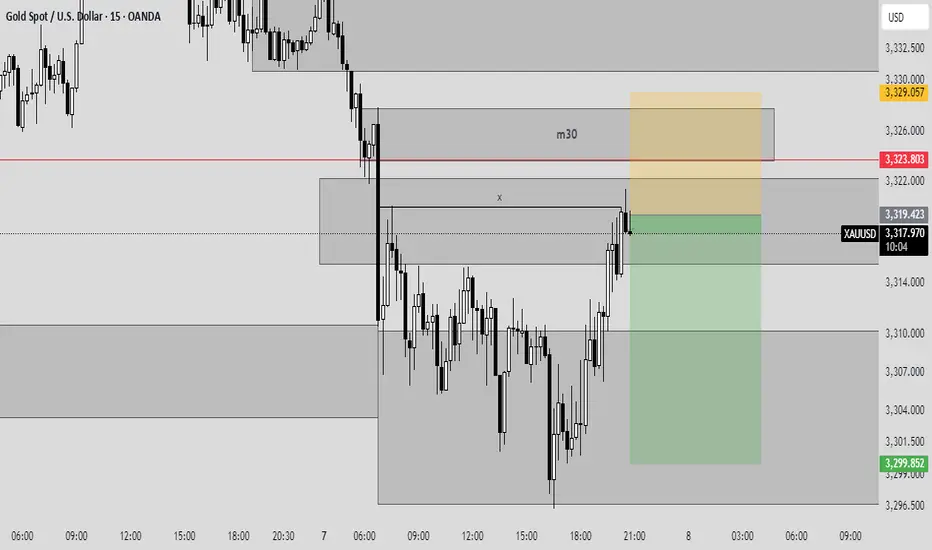
XAUUSD SEllhere the price retested our zone at 3319-3321 so we enter sell .
Please do risk and money management and your own analysis before entry.
Please follow to support me .
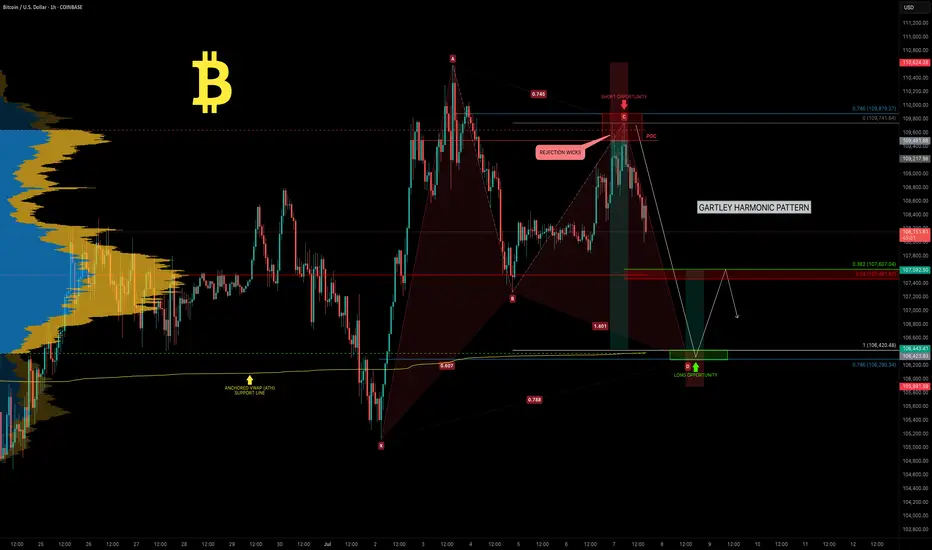
BTC — Weekend Pump Fades.. All Eyes on the Gartley Reversal ZoneBitcoin has been consolidating in a tight range between $110K and $105K over the past two weeks. This weekend’s attempted breakout stalled out quickly! BTC was rejected at the Point of Control (POC) of the previous range and came close to the 0.786 retracement of the recent drop.
🧠 Reminder: Weekend pumps are notorious for being unreliable, especially without strong volume.
Now, the charts point toward something much more structured — a potential Gartley harmonic pattern forming, with multiple levels of confluence suggesting the next key decision zone is just around the corner.
🧩 Gartley Completion Zone: $106,290–$106,400
This price zone is loaded with confluence:
✅ 0.786 Fib retracement of the XA leg sits at $106,290
✅ 1.0 trend-based Fib extension of the BC leg is at $106,370
✅ Anchored VWAP from all-time high aligns precisely at $106,370
✅ VAL (Value Area Low) sits at the same level
✅ Imbalance (Fair Value Gap) from earlier price inefficiency lies in this exact region
All of this stacks up into a high-probability reaction zone.
🎓 Educational Insight: How to Trade a Gartley Harmonic
The Gartley pattern is one of the most powerful harmonic setups — a structured form of retracement and extension that captures exhaustion before reversals. Here's how it works:
🔹 XA: Impulse leg
🔹 AB: Retracement of 61.8% of XA
🔹 BC: Retraces 38.2%–88.6% of AB
🔹 CD: Extends to 78.6% retracement of XA and aligns with a 1.0–1.272 Fib extension of BC
🟢 Point D is the entry zone — your reversal opportunity.
📉 Stop-loss sits just below invalidation (Point X).
💰 Targets usually lie at 0.382 and 0.618 of the CD leg.
🔎 Why It Works: It traps late traders and captures price exhaustion at natural Fibonacci ratios. Combined with other tools — like VWAP, liquidity zones, and order flow — it becomes a high-conviction strategy. These patterns are most effective on higher timeframes like 4H or daily.
_________________________________
💬 If you found this helpful, drop a like and comment!
Want breakdowns of other charts? Leave your requests below.
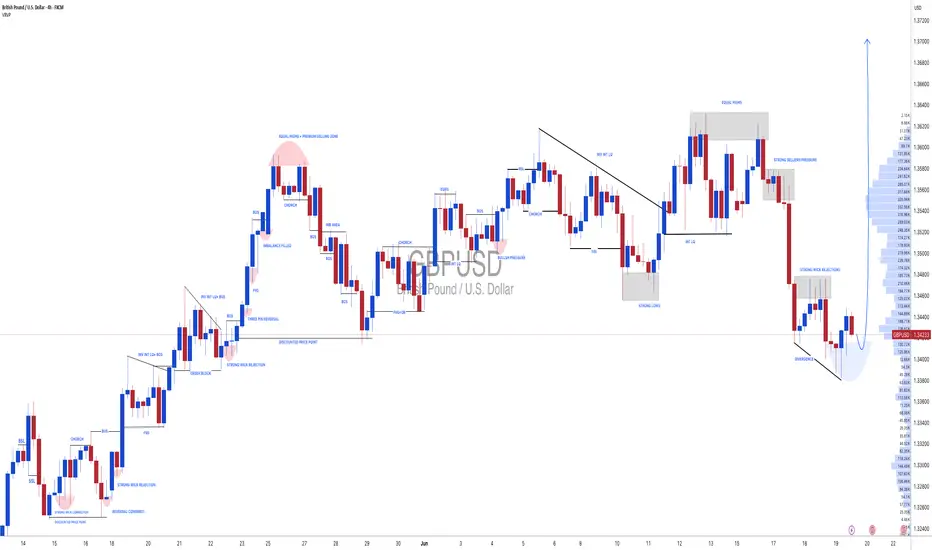
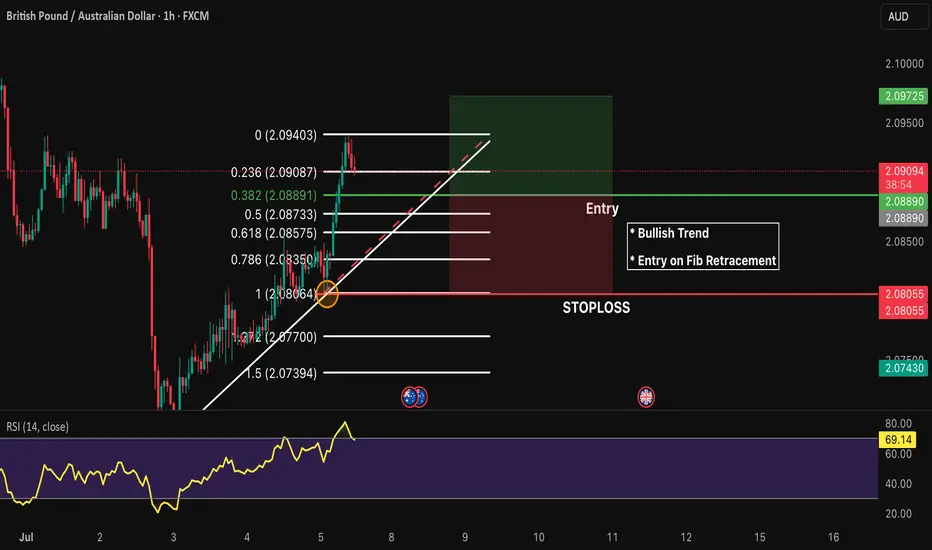
#GBPUSD: A strong bullish move incoming, comment your views The price has shown a possible price divergence, which could lead to a long-term move to 1.37. We expect the US dollar to weaken, which will likely push the price of GBPUSD to our target. Key economic data will be released later today and tomorrow, which could shape the price pattern.
Good luck and trade safely!
Team Setupsfx_
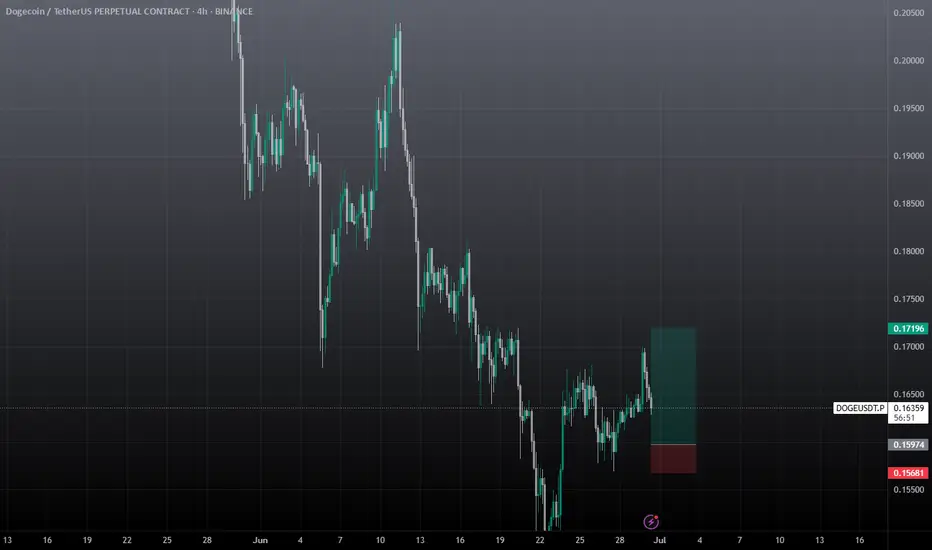
DOGEUSDT Buy Long SetupWait for entry, if the tp hits first, then ignore the trade, I will share new entry.
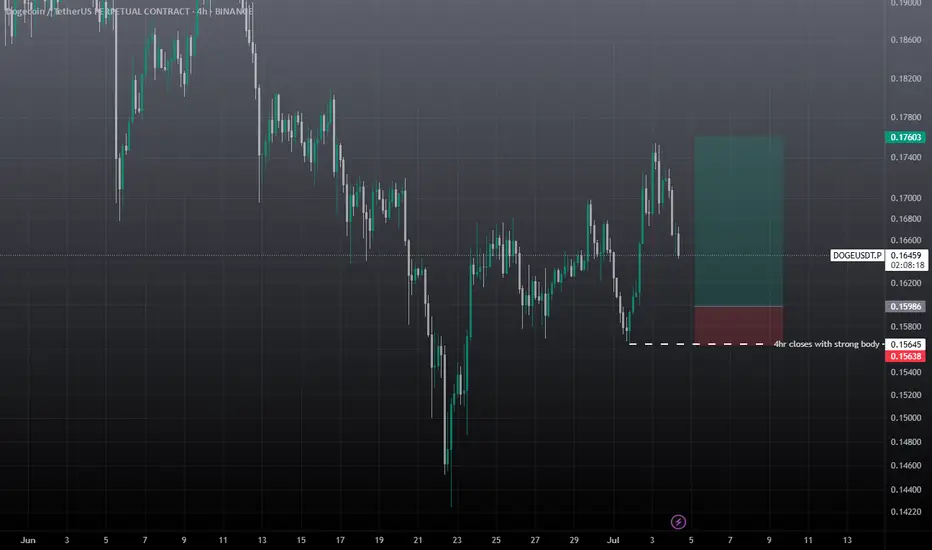
Doge Buy / Long SetupDoge has some Bullish Momentum, Invalidation if 4hrs closes below the mentioned point, then close on entry, otherwise wick doesn't matter. If tp achieved first then Cancel the trade.
Gold intraday waiting to buyGold waiting to buy at 3290-32295, and 32753280 with target 3340 and 3360.

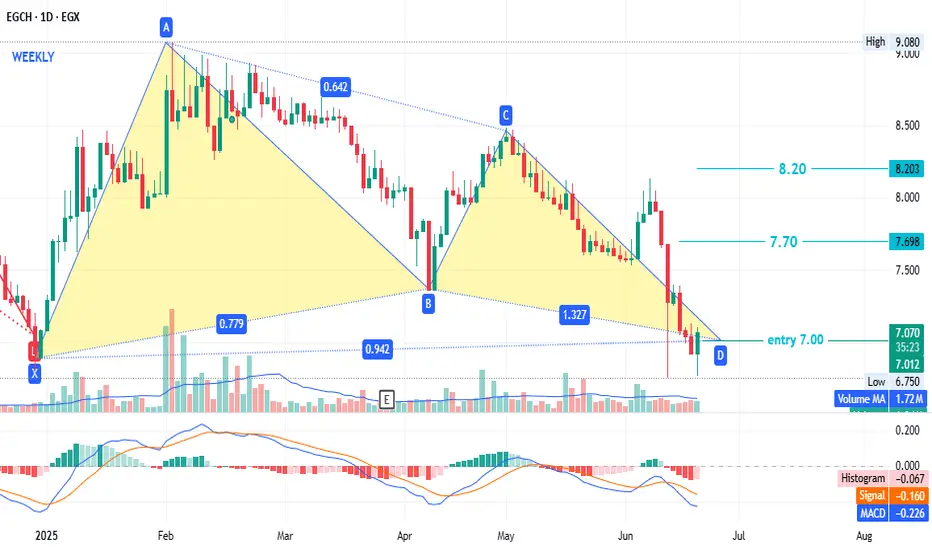
EGCH - old enemy - low riskConsider a long position with the following parameters:
Entry: 7.00
Stop loss: 6.80
Targets: 7.70 (T1), 8.20 (T2)
This is not investment advice but my analysis based on chart data. Consult your account manager before investing. Good luck.
AUD/JPY LONGAUD/JPY LONG "break of a resistance area and retest + 61.8% fib retracement + 50 ema dynamic support "
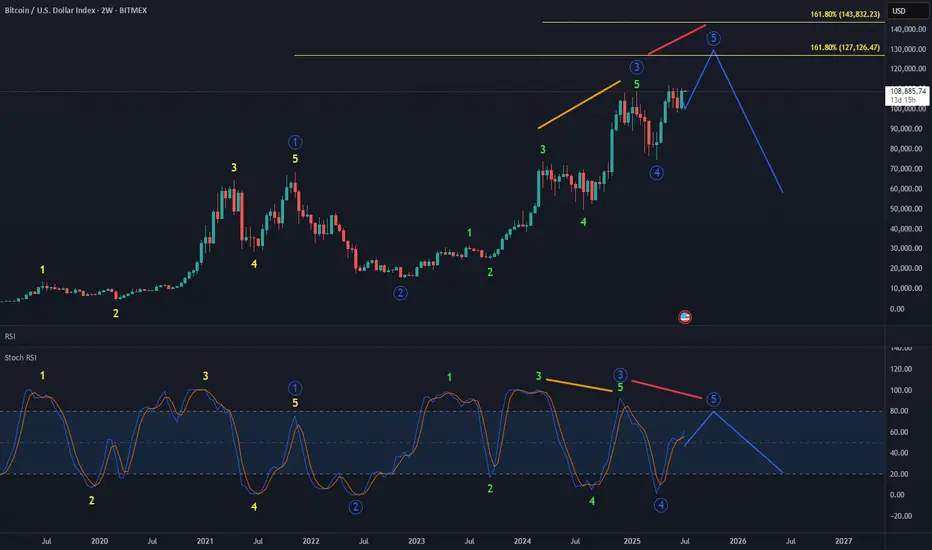
Bitcoin Bullish Continuation in Progress🔵 Bitcoin Weekly structure confirms higher highs & higher lows, reinforcing the bullish trend.
📈 As long as CRYPTO:BTCUSD holds above key support near $106K, the next leg could target $127K–$143K within the coming 2 months.
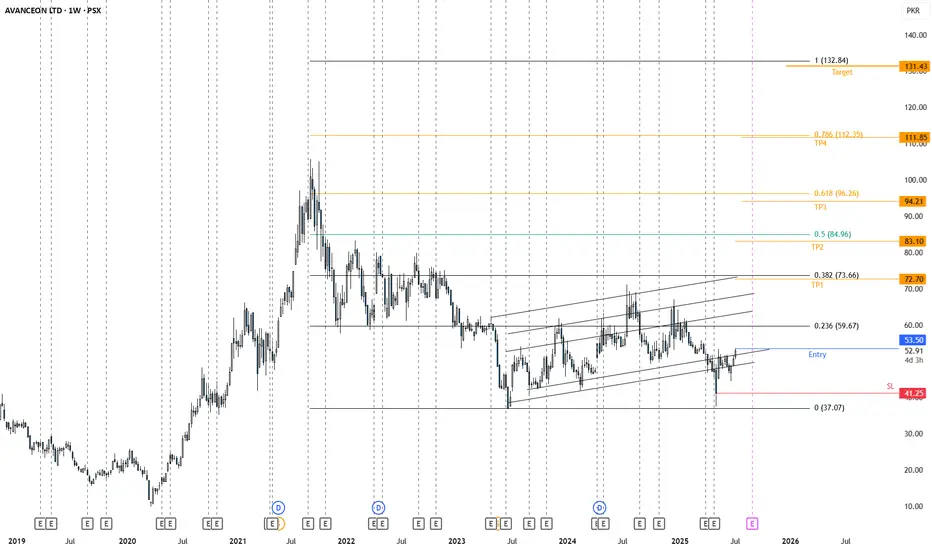
AVN can become volcanic anytime...AVN can become volcanic anytime...
Currently, it is in a rising channel, being accumulated slowly in a rising channel.
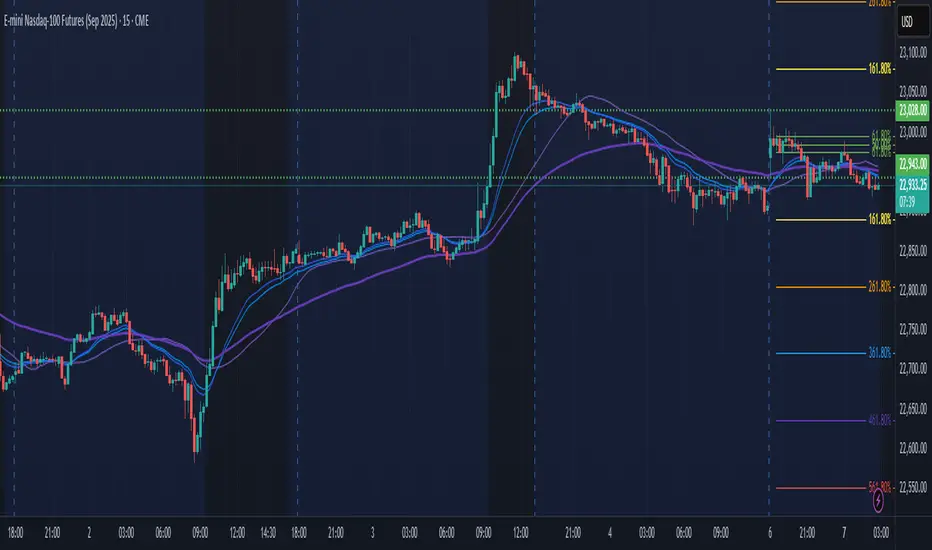
NQ Power Range Report with FIB Ext - 7/7/2025 SessionCME_MINI:NQU2025
- PR High: 23028.50
- PR Low: 22943.00
- NZ Spread: 191.25
No key scheduled economic events
First full trading day following long holiday weekend
Session Open Stats (As of 12:45 AM 7/7)
- Session Open ATR: 323.71
- Volume: 33K
- Open Int: 271K
- Trend Grade: Neutral
- From BA ATH: -0.6% (Rounded)
Key Levels (Rounded - Think of these as ranges)
- Long: 23239
- Mid: 21525
- Short: 20383
Keep in mind this is not speculation or a prediction. Only a report of the Power Range with Fib extensions for target hunting. Do your DD! You determine your risk tolerance. You are fully capable of making your own decisions.
BA: Back Adjusted
BuZ/BeZ: Bull Zone / Bear Zone
NZ: Neutral Zone
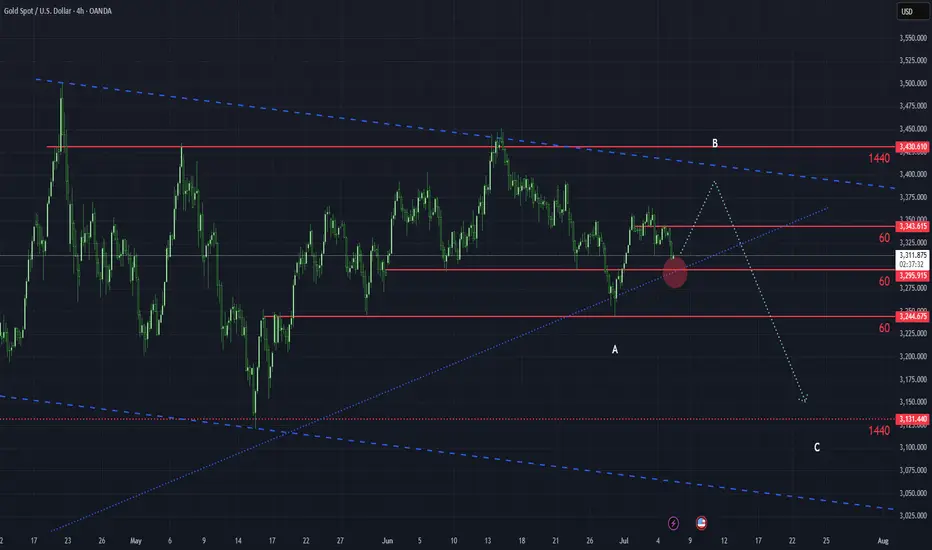
20250707-XAUUSD IdeaAn upward movement is expected at the price level of 3295, followed by a downward continuation after reaching the 0.618 retracement of wave A, completing the ABC wave pattern.
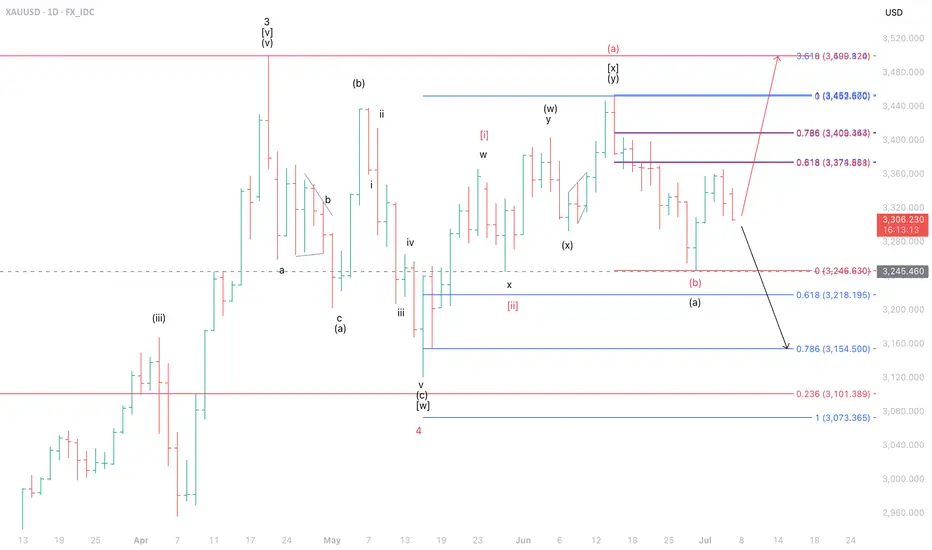
XAUUSD at a CrossroadsOn the daily timeframe, we identify two possible scenarios for XAUUSD. Under the red label, as long as XAUUSD remains above the 3,245 level—serving as a stop-loss—there is potential for further upside to test the 3,378–3,500 area.
However, in the worst-case scenario illustrated by the black label, if XAUUSD breaks below its key support, the next downside target would be in the 3,154–3,218.
Gold Long: Stop loss at 3305, TP at 3426Over in this video, I did a quick revision on the cycle level Elliott Wave counts for Gold before delving down to the lower timeframes.
I discussed the alternate counts for Gold and explained how the latest 5-waves up made me retain what you see as the primary count. Essentially, what is important over here is that the stop loss is $3305 and the potential take profit is #3426.
Remember to keep your risk tight and good luck in your trading!

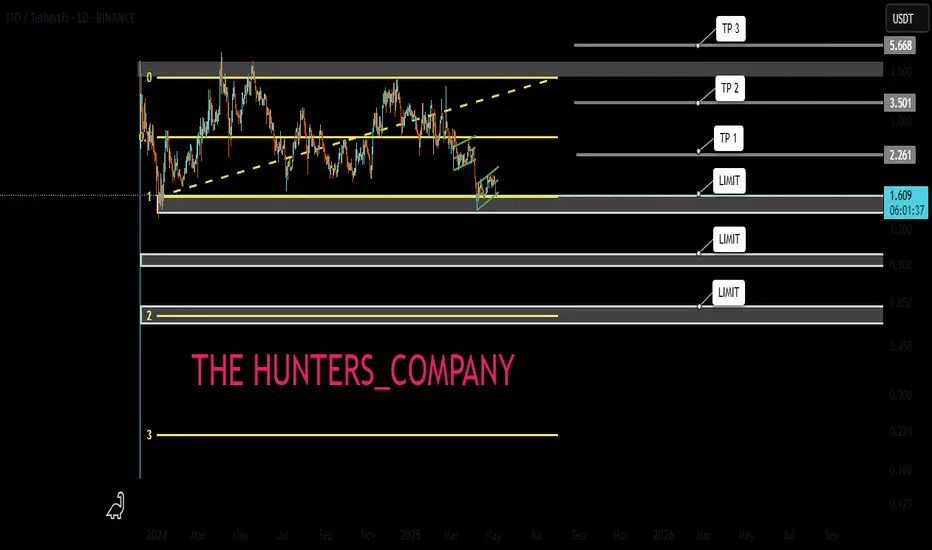
JTO : Price at a critical point: Falling or rising?Hello friends
Given the long-term range that this currency has made, the price has now reached the bottom of the range, which is very sensitive, and this currency also has a token release, which can be a warning.
In case of a drop, we have identified important supports for you, so that you can buy with risk and capital management.
*Trade safely with us*
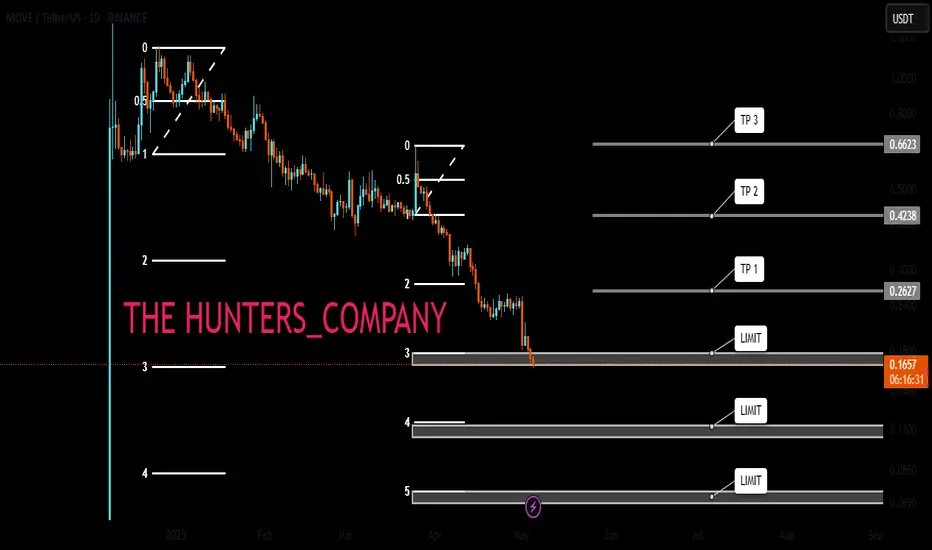
MOVE : Where to buy ?Hello friends
Given the upcoming token release, the price is expected to continue to fall, so be careful.
In case of a fall, we have identified important support levels for you, where you can buy with capital and risk management.
*Trade safely with us*
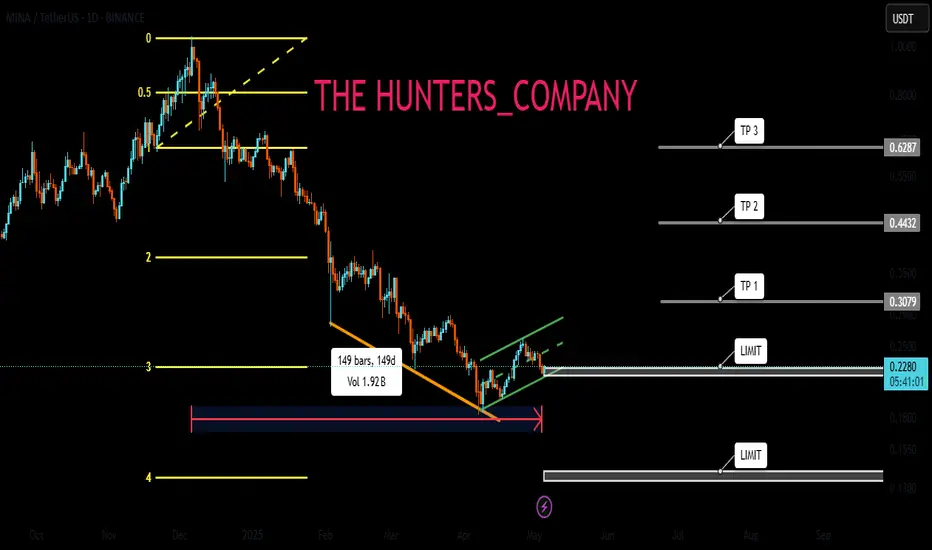
MINA : Is the shedding over ?Hello friends
Given the heavy fall of this and the prolonged price correction, you can now see that the price is supported within the specified support range, which is a good sign...
We have identified important support areas for you, where you can buy in steps and with risk and capital management.
We have also identified targets.
*Trade safely with us*