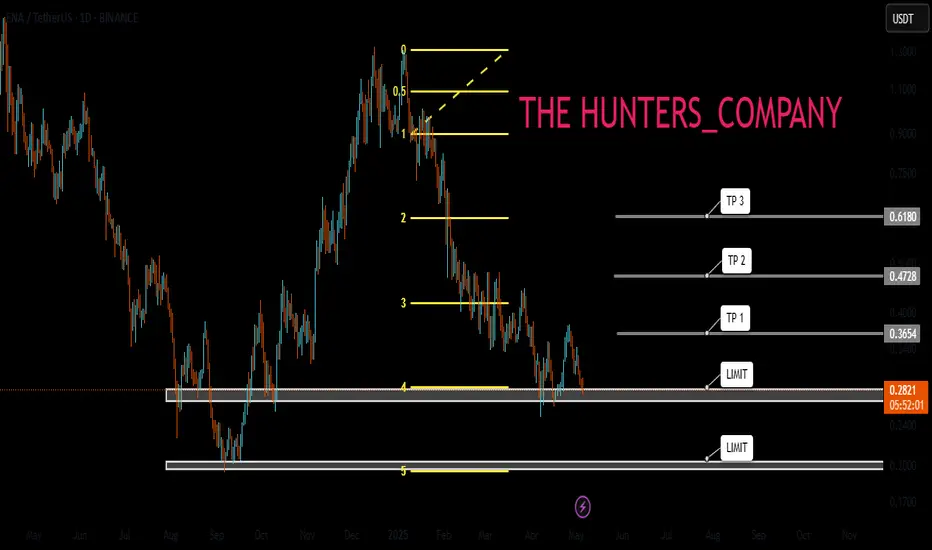
MINA : Is the shedding over ?Hello friends
Given the heavy fall of this and the prolonged price correction, you can now see that the price is supported within the specified support range, which is a good sign...
We have identified important support areas for you, where you can buy in steps and with risk and capital management.
We have also identified targets.
*Trade safely with us*
Fibonacci
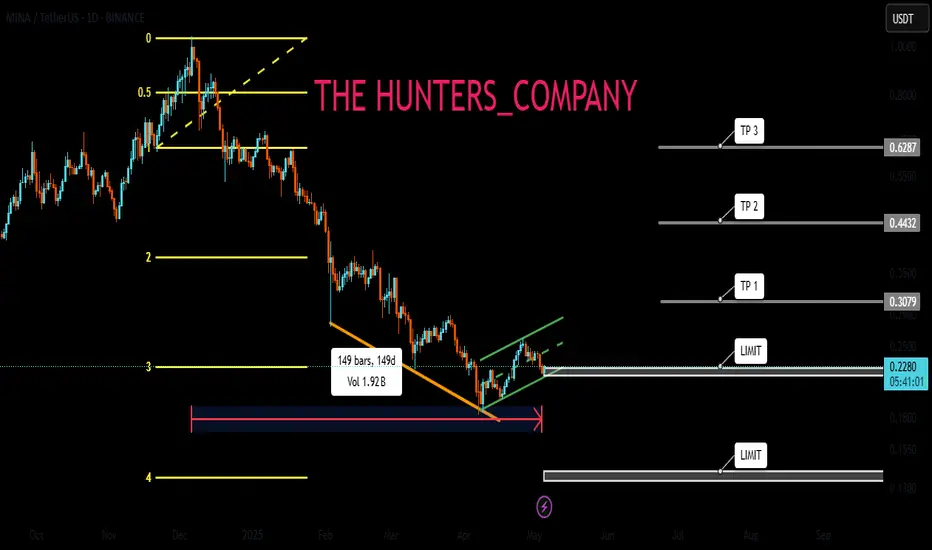
ENA : The largest token release...Hello dears
Given the long-term price decline that we have witnessed, it has now been announced that this currency is going to do a token release, which will naturally cause the price to fall, so be careful.
In case of a fall, we have identified important supports for you so that you can buy with risk and capital management.
The target has also been identified.
*Trade safely with us*
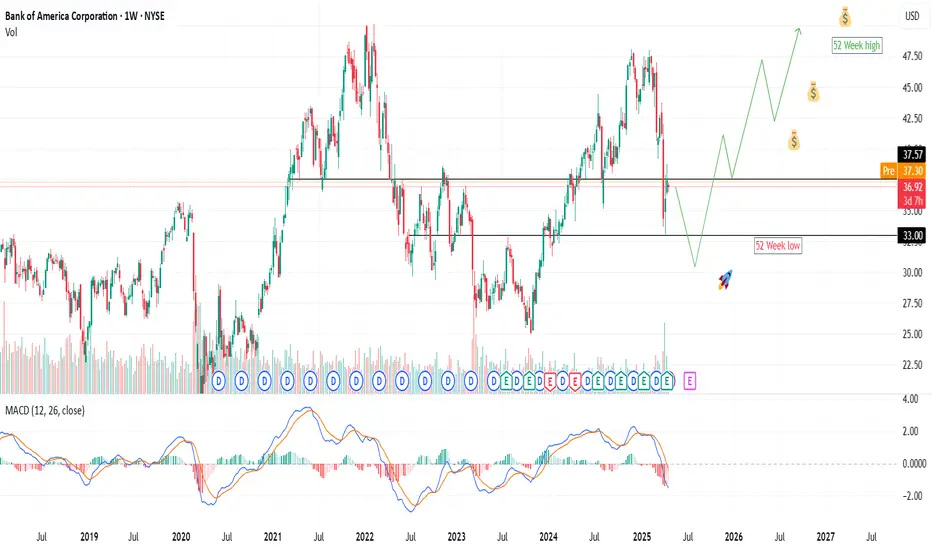
BAC – Building the Base for a Breakout?Bank of America (BAC) has been consolidating quietly, attracting attention as it sits near a key mid-range level. With a 52-week low of $33.06 and a 52-week high of $48.08, the stock currently trades around $36.92 – roughly 11% above its low and 23% below its high.
This setup could be the calm before the move.
💥 Technical Outlook & Strategy
With financials holding steady and macro headwinds softening, BAC might offer a solid swing trade or medium-term positioning opportunity.
📌 Entry Points to Watch
$36.90 – Market price, if volume picks up near support
$33.30 – Prior breakout area and potential pullback support
$30.50 – Strong support and near the 52-week low for aggressive buyers
🎯 Target Levels
$39.80 – Short-term resistance; previous rejection zone
$43.50 – Fib retracement from the high, medium-term target
$47.50–48.00 – 52-week high retest, bullish scenario
🧠 Narrative to Watch
With potential Fed pauses on rate hikes, improving margins, and relative stability in U.S. banks, BAC could be positioning for a slow grind higher. Watch for earnings momentum and bond yield trends.
⚠️ Disclaimer
This analysis is for informational and educational purposes only and does not constitute financial advice. Always do your own research or consult with a licensed financial advisor before making trading decisions.
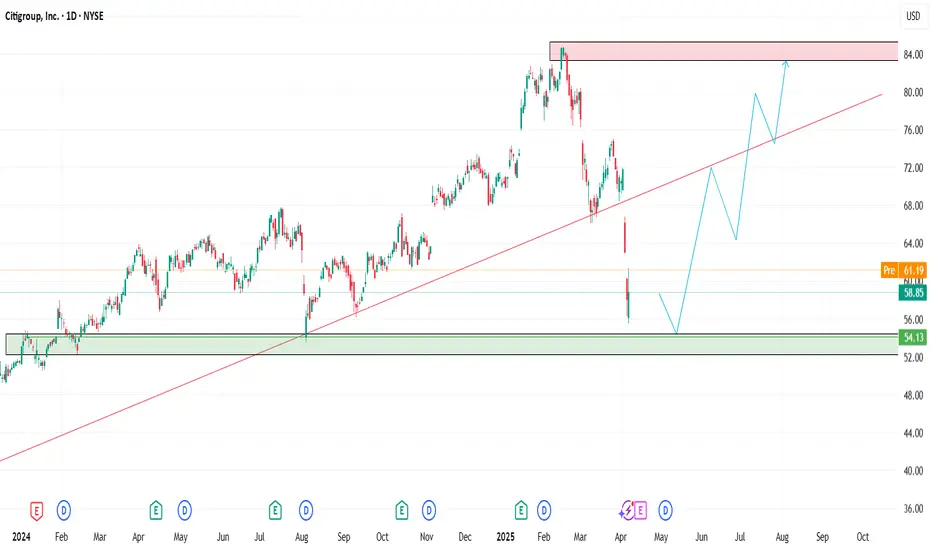
Is Citigroup (C) the Most Undervalued Big Bank Right Now?🔥Let’s talk numbers:
🧮 P/E: 9.78x
💸 P/S: 0.66x
That’s deep value — Wall Street’s sleeping on this one. While everyone's chasing AI, Citigroup is trading at garage sale prices.
🧠 The Setup:
If you're into swing plays with strong R/R and macro upside, C is worth a look.
🔑 Entry Zones: 1️⃣ Market price — for early bulls
2️⃣ $55 — breakout confirmation
3️⃣ $48 — bargain bin steal
🎯 Targets:
TP1: $70 🟢
TP2: $78 🚀
TP3: $84 💰
💬 Why it matters:
Citi has been lagging behind peers like JPM, but it’s still a beast. If the Fed holds or cuts, banks could catch a serious bid — and this one’s ready to pop from a value base.
📌 Watching volume at $55 and any macro shifts as catalysts.
👀 Don’t ignore this one just because it’s not trending. That’s where smart money hides.
📢 Disclaimer:
This is not financial advice. Just sharing ideas and setups I’m watching. Always do your own research and manage your risk.
#Citigroup #C #Undervalu
#Citigroup #C #UndervaluedStocks #SwingTrade #TradingSetup #DeepValue #Banking #PEratio #SmartMoneyMoves #StockMarket #Financials #Watchlist
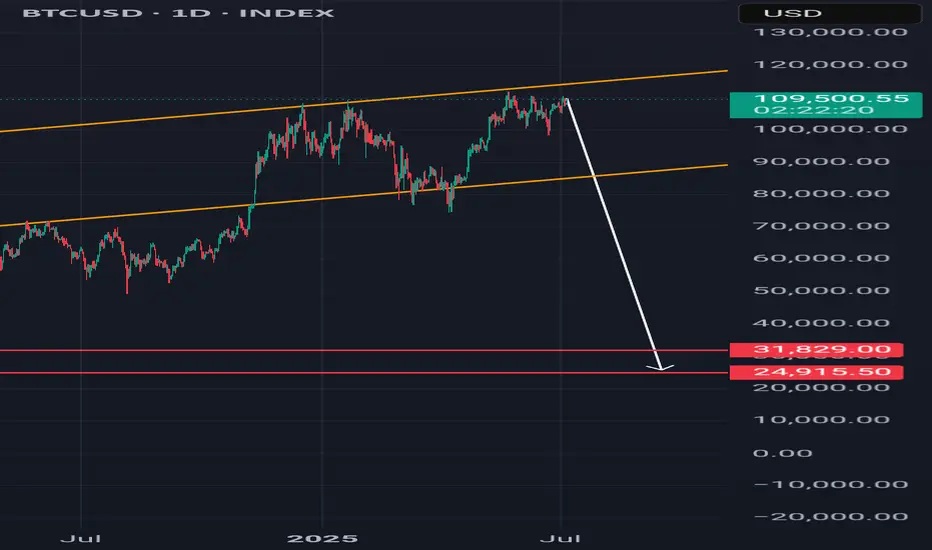
#btc #btcusd #elliottwave short sell setup wave 4 7Jul25This count is based on my assumptions so anything can happen not a trading or financial advice just for educational purposes only kindly do your own ta thanks trade with care good luck.
Gold (XAUUSD): Potential Short from Bearish OPotential Short Opportunity After Reaction at OB-
The chart shows a potential short setup on Gold Spot / U.S. Dollar. Price has recently moved upwards, labeled as swing "1", and is approaching a bearish order block (OB-) identified in the $3,344 - $3,353 area.
We could see a reaction at this OB- level, leading to a downward move as indicated by the arrow. The next potential target for this downward move could be the Point of Interest (POI) which aligns with a bullish order block (OB+) around the $3,283 - $3,288 zone.
Alternatively, if price pushes through the initial OB-, the next bearish OB- around $3,375 - $3,385 could act as further resistance, potentially leading to a reversal as shown by swing "2".
Traders could look for confirmation signals around these OB- levels to initiate short positions, targeting the POI OB+ as a primary target. A break below the POI OB+ could open the way for further downside.
Consider price action and volume at the highlighted zones for better entry and exit decisions.

Is BTC getting ready for a new ATH?🔍 1. Key Support and Resistance Levels (Horizontal Lines):
🟢 Resistances (Green Lines):
114,295.54 — strong resistance resulting from previous highs.
112,767.65
111,009.00
110,685.35 — current key level that price may try to retest after a potential breakout.
🔴 Supports (Red Lines):
108,496.55 — current level being tested, also coinciding with local resistance from the past.
107,687.57
105,888.74
102,909.85
100,848.07
98,208.22 — strong long-term support; in the past, this level was reacted with a strong bounce.
🔶 2. Downtrend channel marked with orange lines:
The upper downtrend line acted as resistance.
The lower uptrend line acted as support.
The price recently broke above the upper line, but is now testing it again - this could be a retrospective retest.
➡️ If the close of the H4 candle is above this line - a possible confirmation of the breakout.
📊 3. Stochastic RSI indicator (at the bottom of the chart):
Currently in the uptrend phase after a bounce from the oversold level (<20).
The %K line (blue) is crossed upwards by the %D line (orange) - a bullish signal.
Still below the overbought zone, which suggests that the potential uptrend still has room to develop.
🧠 4. Market structure and price action:
Price broke above the 108.496 level, but is currently struggling to stay above this zone.
A retest of the broken triangle could be a healthy move, provided that support is maintained in the 108k–107.6k area.
A break below and a close below 107.6k could mean a false breakout and a possible decline towards 105.8k or even 102.9k.
🧭 5. Possible scenarios:
✅ Bullish scenario:
Maintaining the 108.496 level and closing the candle above the upper orange line → continued growth.
The nearest targets are:
110.685 (first resistance),
111.009 and 112.767 next.
❌ Bearish scenario:
The price will not stay above 108k and will fall below 107.687.
Possible return to the previous consolidation range with the target:
105.888,
and then 102.909 or 100.848.
🧮 Summary:
Currently, the decisive moment is underway: a test of support after breaking out of the convergent triangle.
The Stoch RSI indicator gives a bullish signal, but the price must confirm the movement by behaving above 108k.
Retest and bounce - this is a bullish scenario.
A breakdown and return under the trend line - means that the breakout was false.
XAUUSD SELLthe setup has been given with all the necessary analysis given .
follow and support for more analysis .
Thank you !
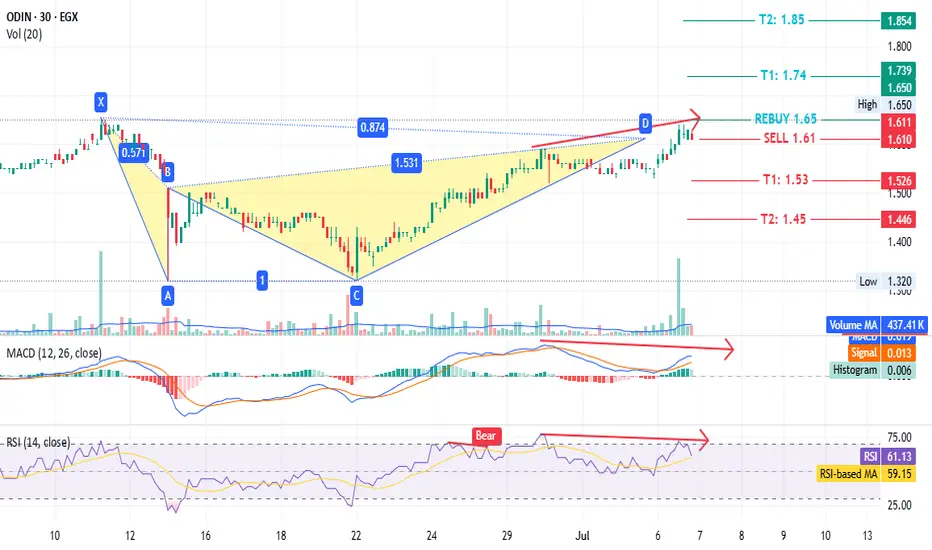
ODIN - confused but easy NGM:ODIN timeframe: 1 hour
Identified a bearish Gartley pattern with:
- Sell point: 1.61
- Targets: T1 at 1.53, T2 at 1.45
- Stop loss/rebuy: 1.65
If rebuy is triggered:
- New targets: T1 at 1.74, T2 at 1.85
- Stop loss: 1.61
MACD and RSI indicators do not support the recent price rise, aligning with the bearish pattern.
Disclaimer: This is not investment advice, only an analysis based on chart data. Consult your account manager before making any decisions. Good luck.
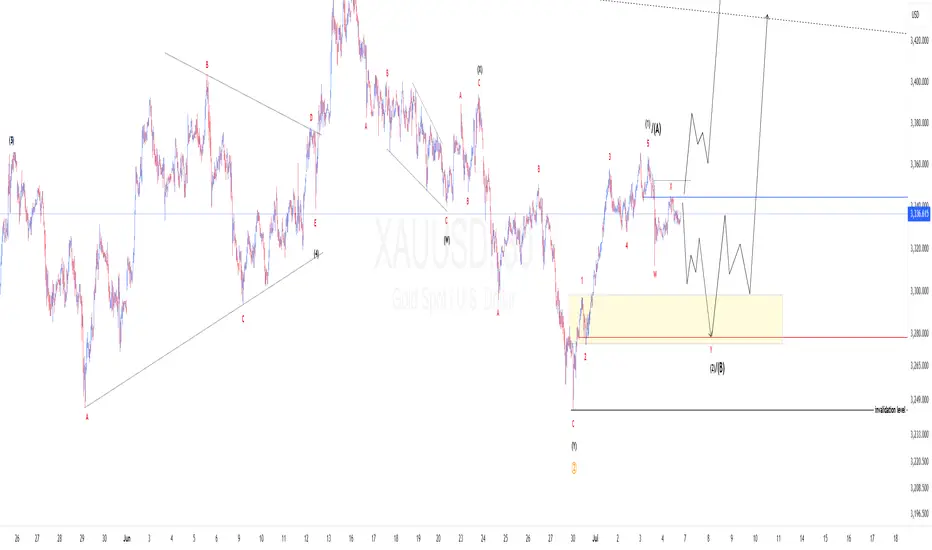
XAUUSD Elliotwaves update: Is wave 4 complete?The view we had in past three weeks was a possibility of complex 4th wave and our short term bias was bearish. But price reacted and closed above 61.8 Fibonacci retracement level and therefore changed our bias to bullish(Technically 4th wave is complete). Another confluence was a clear 5 waves after the reaction on the 61.8 fib. Now two possibilities, either wave 2 is complete and we should expect price to continue up from current price level or a possibility of double 3 to push price down to atleast 61.8 Fib before continuation to the upside. To take advantage of this anticipated move a trader should either wait for price to drop to the golden zone or wait for price to breach the immediate high and retest.
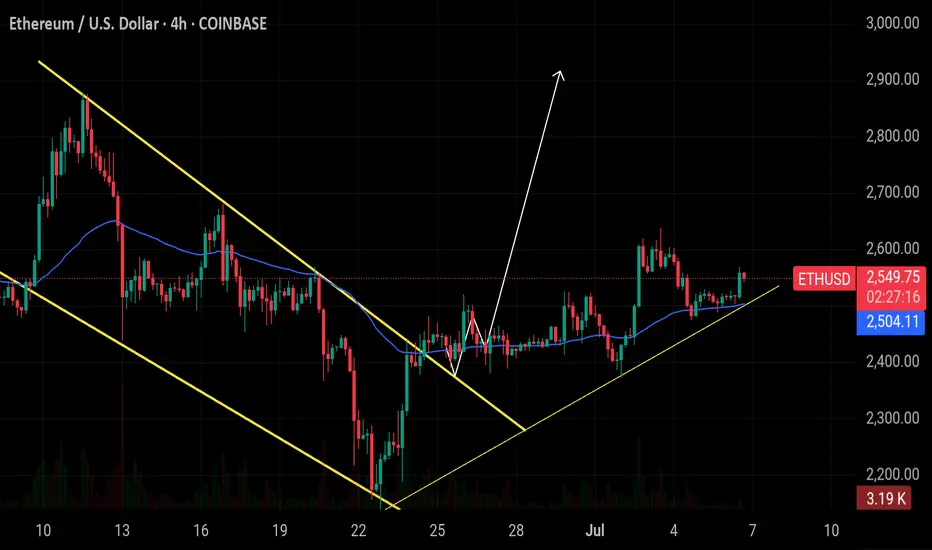
$ETH 4H Update: Target 1 hit! Ethereum has reached the $2,600 . CRYPTOCAP:ETH 4H Update:
Target 1 hit! Ethereum has reached the $2,600 level after a clean breakout from the falling wedge. Holding above support confirms bullish momentum — next key target is $2,800 as long as price stays above $2,400
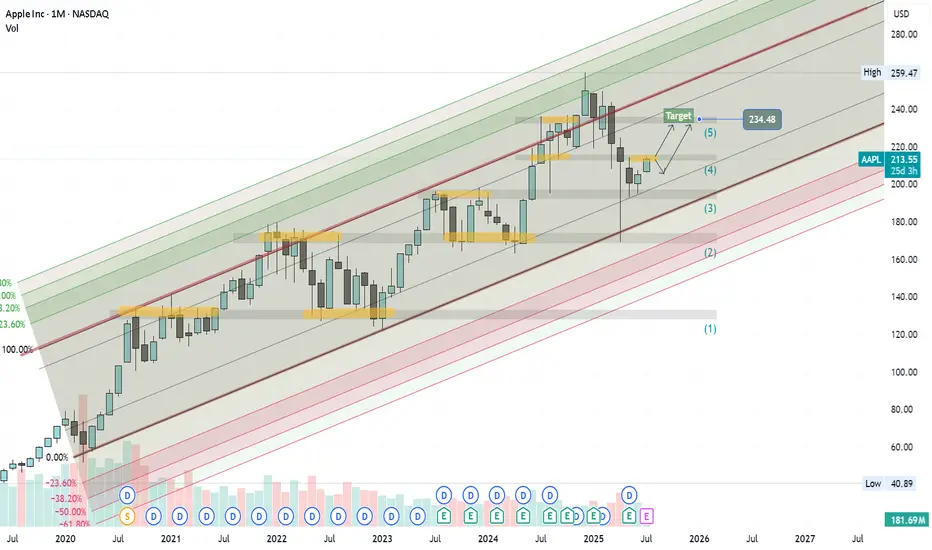
Apple Is Climbing the Fibonacci Channel Ladder – Step 5 Ahead?On the monthly chart, Apple (AAPL) is steadily moving within a well-defined ascending Fibonacci channel, like climbing a ladder — step by step.
The price is currently testing Step 4 , a zone that has acted as a strong resistance barrier.
Despite the pressure here, the structure still appears bullish, and even a minor pullback might simply be a pause before the next move.
If momentum picks up, we could soon see a breakout toward the next step — targeting 234 at Step 5.
The trend remains technically intact unless the channel is broken, and the overall formation still leans toward continuation.
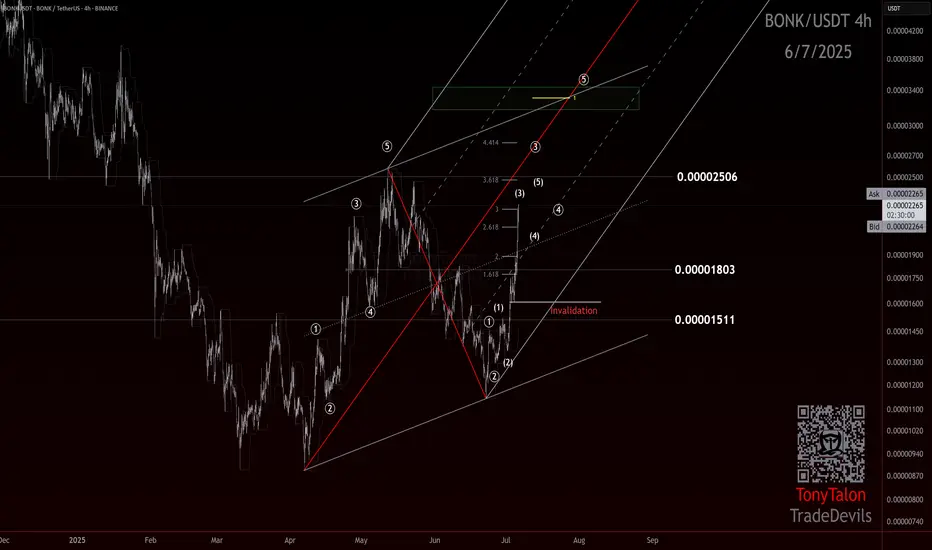
From BONK to Boom: Is This a Full Impulse?If you find this information inspiring/helpful, please consider a boost and follow! Any questions or comments, please leave a comment!
BONK: Watching the Impulse Unfold
Looks like BONK may have bottomed at 887, where it kicked off what appears to be an impulsive move up.
The retrace that followed was suspicious—plenty of ways to count it depending on your lens—but price action eventually started hinting at a 12-12 or zigzag-style crossroad. That indecision resolved quickly once BONK cleared 1511, shifting the structure firmly back into bullish territory.
Now trading around 2242, the behavior is aligning with what you'd expect from a wave 3: strong momentum, vertical lift, and minimal resistance. It’s moving like a third wave should.
That said, there’s some heavy resistance sitting overhead at 2506, and it could stall or even reject price short-term. If it does, the next thing I’ll be watching is how price reacts—specifically looking for a clean wave 4 pullback and a final push into wave 5.
If we see that 4–5 structure play out at multiple degrees, it would go a long way toward confirming this whole move as a completed impulse off the low.
For now, this one stays on watch for the next setup.
Trade Safe!
Trade Clarity!
Wait for all currencies to fall further and sell your tokens.There is currently no news of growth in Ethereum and altcoins, and every time it goes up, there is an opportunity to exit and it is a trap. Ethereum and altcoins are only for sale. Soon Cardano will be 0.08, Ethereum 600,
Dogecoin 0.003,
Shiba 0.0000001,
and the rest will fall, and they will only release tokens and swallow your dollars in the name of Alt Season.
SOLANA → Pre-breakdown consolidation may lead to distributionBINANCE:SOLUSDT is declining and testing the support of the trading range as Bitcoin pauses after strong growth and enters a correction phase...
SOL looks a bit weaker than Bitcoin technically, but SOLANA has some positive fundamentals, though that might not be enough.
After forming a false breakout of key daily resistance, Bitcoin is moving into a correction phase. An update of local lows on the chart could trigger a drop across the entire cryptocurrency market.
In SOL, the focus is on the two nearest levels of 148.75 and 145.64. A breakdown of support could trigger the distribution of accumulated energy within the specified range as part of a downward momentum.
Resistance levels: 148.75, 151.2, 153.88
Support levels: 145.64, 138.59
The ideal scenario would be a false breakout of 148.75 (liquidity capture) and a retest of 145.64, followed by a break of support. Consolidation below 145.65 could trigger a drop to the zone of interest at 138.59.
Best regards, R. Linda!
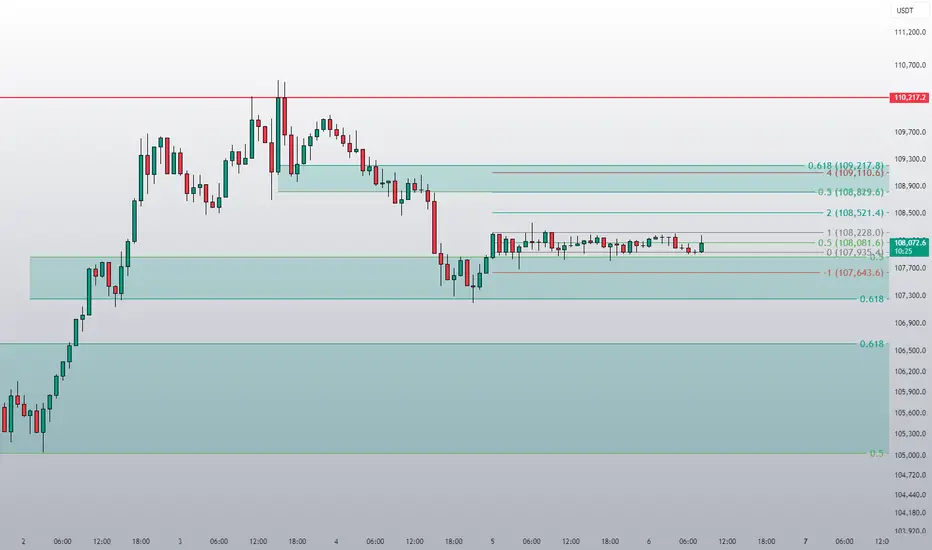
Bullish?This range looks like it wants to break to the upside. Maybe one more drop to 107.6K as a fakeout — but that remains to be seen.
VISHNUSURYA INFRA techno-funda analysisVishnusurya Projects & Infra Ltd. is a Chennai-based construction and infrastructure company involved in civil contracting, roadwork, bridges, and earthmoving services. It also undertakes bitumen supply and mining contracts for state and national authorities. The stock is currently trading at ₹178.65 after a strong recovery from its recent base and is beginning to show structural trend formation.
Vishnusurya Projects & Infra Ltd. – FY22–FY25
Snapshot Sales – ₹232 Cr → ₹276 Cr → ₹321 Cr → ₹367 Cr – Consistent growth, healthy execution pipeline
Net Profit – ₹4.8 Cr → ₹7.1 Cr → ₹10.6 Cr → ₹14.8 Cr – Accelerating profitability, scale benefits emerging
Company Order Book – Moderate → Moderate → Strong → Strong – Increasing traction from infra contracts Dividend Yield (%) – 0.00% → 0.00% → 0.00% → 0.00% – No distributions, reinvestment-focused
Operating Performance – Weak → Moderate → Moderate → Moderate – Improving EBITDA visibility
Equity Capital – ₹27.55 Cr (constant) – Stable ownership base
Total Debt – ₹92 Cr → ₹88 Cr → ₹81 Cr → ₹75 Cr – Deleveraging progressing cautiously
Total Liabilities – ₹184 Cr → ₹196 Cr → ₹210 Cr → ₹225 Cr – Proportionate to execution scale
Fixed Assets – ₹88 Cr → ₹94 Cr → ₹101 Cr → ₹108 Cr – Ongoing capex to support order execution
Latest Highlights
FY25 net profit rose 39.6% YoY to ₹14.8 Cr; revenue up 14.3% to ₹367 Cr
EPS: ₹5.37 | EBITDA Margin: 13.6% | Net Margin: 4.03%
Return on Equity: 9.74% | Return on Assets: 6.58%
Promoter holding: 72.08% | Dividend Yield: 0.00%
Major road and civil contracts under execution in Tamil Nadu and Andhra Pradesh
Continued capex toward machinery, bitumen handling, and project mobility infrastructure
Technical Snapshot Vishnusurya is trading at ₹178.65 with an RSI of 50.76, showing early-stage trend strength near a long-term base. Volume activity is increasing steadily, pointing to institutional accumulation. Support levels are visible near ₹222.92, ₹156.98, and ₹273.60, while upside breakout zones exist at ₹397.60, ₹463.50, and ₹547.50 if the upward trend sustains.
Business Growth Verdict Yes, Vishnusurya is expanding its business on solid foundations
Profitability and margins are strengthening with better project mix
Debt is being managed conservatively amid revenue growth
Fixed asset expansion is paced well with project pipeline visibility
Final Investment Verdict Vishnusurya Projects & Infra Ltd. offers a compelling infrastructure turnaround story from the South Indian EPC space. The company’s rising revenue, expanding margins, and stable debt profile suggest disciplined execution and improving scale efficiency. Although dividend returns are absent, the reinvestment approach underlines long-term growth intent. For investors seeking a high-ROA infra bet with rising order flow and technical momentum, this stock merits active tracking for staggered accumulation.

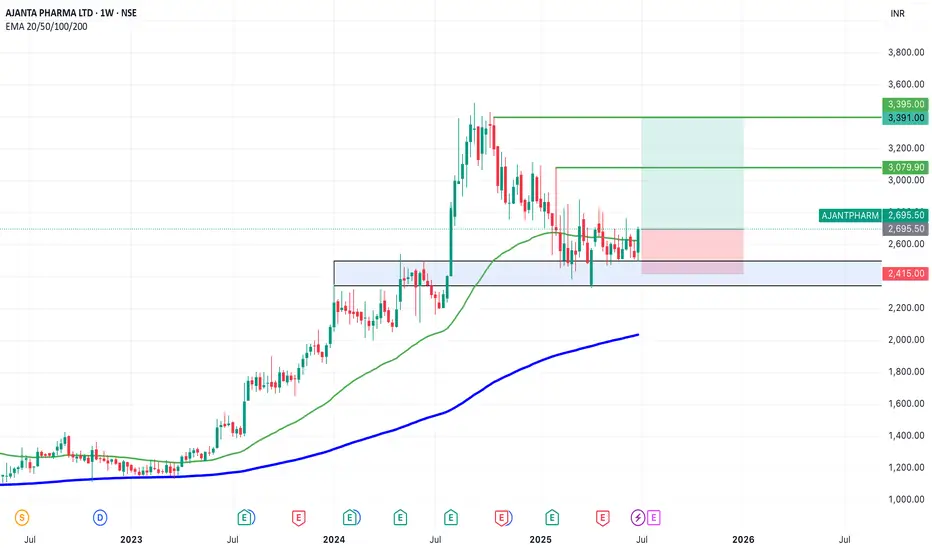
SWING IDEA - AJANTA PHARMAAjanta Pharma , a mid-cap pharma player with strong branded generics in ophthalmology, dermatology, and cardiology, is showing a compelling swing trade setup backed by a high-probability technical breakout.
Reasons are listed below :
Bullish engulfing candle on the weekly timeframe, indicating reversal strength
2,500 zone acting as a crucial support
Holding above 0.382 Fibonacci retracement level , suggesting healthy correction
Price trading above 50 & 200 EMA on the weekly chart – long-term strength intact
Breakout from narrow consolidation near the 50-week EMA
Target - 3080 // 3400
Stoploss - weekly close below 2415
DISCLAIMER -
Decisions to buy, sell, hold or trade in securities, commodities and other investments involve risk and are best made based on the advice of qualified financial professionals. Any trading in securities or other investments involves a risk of substantial losses. The practice of "Day Trading" involves particularly high risks and can cause you to lose substantial sums of money. Before undertaking any trading program, you should consult a qualified financial professional. Please consider carefully whether such trading is suitable for you in light of your financial condition and ability to bear financial risks. Under no circumstances shall we be liable for any loss or damage you or anyone else incurs as a result of any trading or investment activity that you or anyone else engages in based on any information or material you receive through TradingView or our services.
@visionary.growth.insights
Insiders are selling Roblox ! Heres the levels you need to knowIn this video I lay out a solid plan for a move to the downside for Roblox after a 100% move to the upside since April of this year .
I demonstrate why I believe we will take a 30% retracement and provide confluent evidence to support this theory.
There are some fundamental reasons that I also did include alongside the technical analysis which is not my regular style but important given the context.
Tools used in the video 0.382 Fib , Standard Fib pull, Trend based fib and pivots .

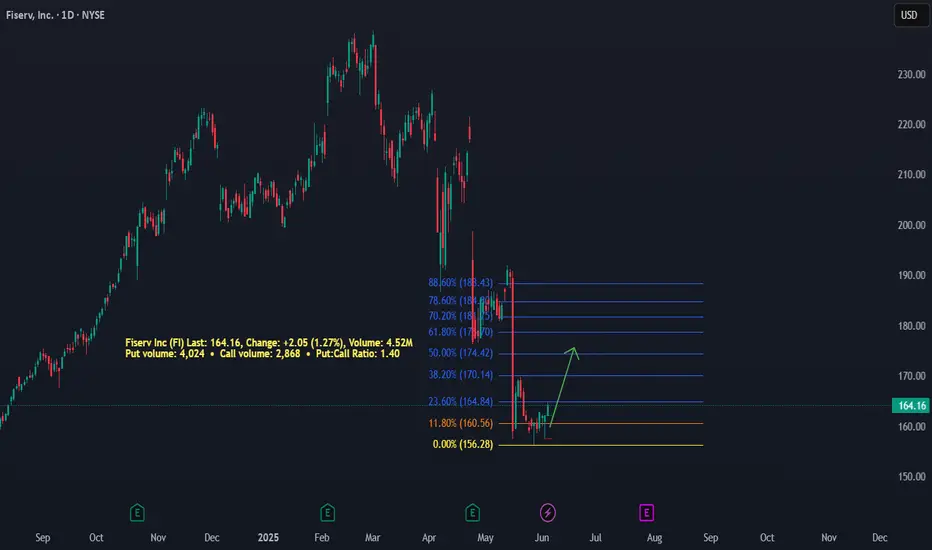
FiservInsiders have sold $239 Million shares on MAY 29TH. We expect price to rally from these lows to visit the 50% Fib levels. This is a contrarian play as 4,024 Puts are in play which means more Bears are betting on a drop. This means a lot of Stop Loss orders are prime above the $170 level. This will be a Fade the market play.
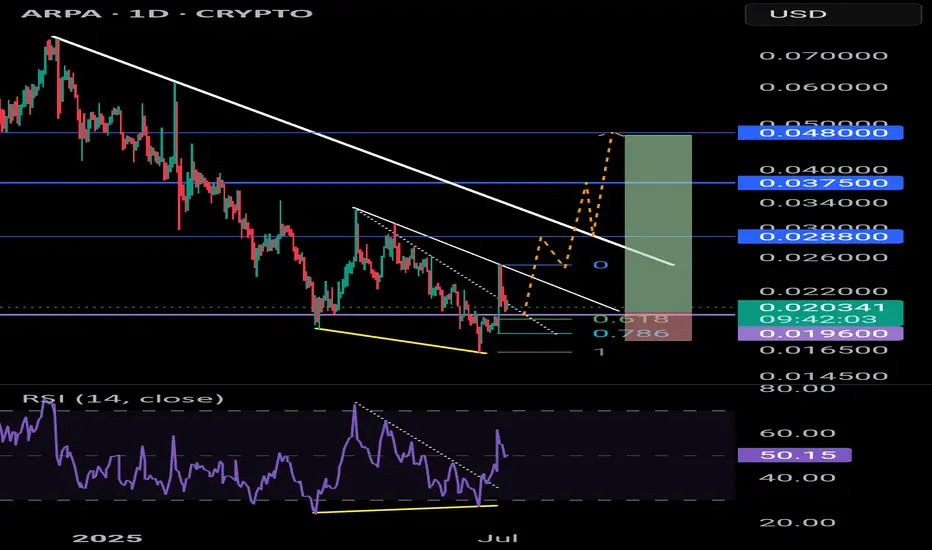
ARPA - long position1D timeframe
Bullish divergence
Entry around the 618 fib
Targets rely on a breakout of 2 x downtrends
Entry: 0.0196
TP1: 0.0288 (+47%)
TP2: 0.0375 (+91%)
TP3: 0.0480 (+138%)
SL: 0.0173 (-13%)
R:R - 10:1