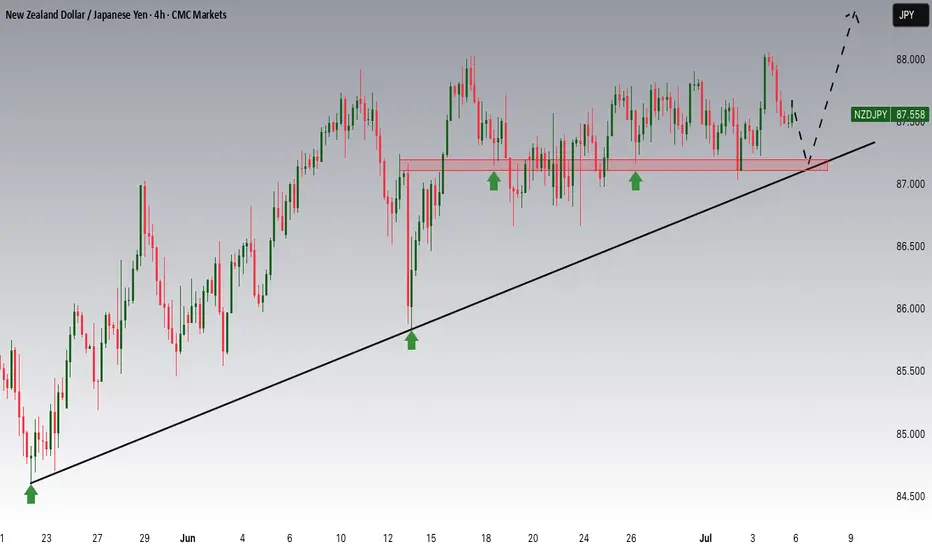
NZDJPY Potential UpsidesHey Traders, in the coming week we are monitoring NZDJPY for a buying opportunity around 87.200 zone, NZDJPY is trading in an uptrend and currently is in a correction phase in which it is approaching the trend at 87.200 support and resistance area.
Trade safe, Joe.
Fibonacci
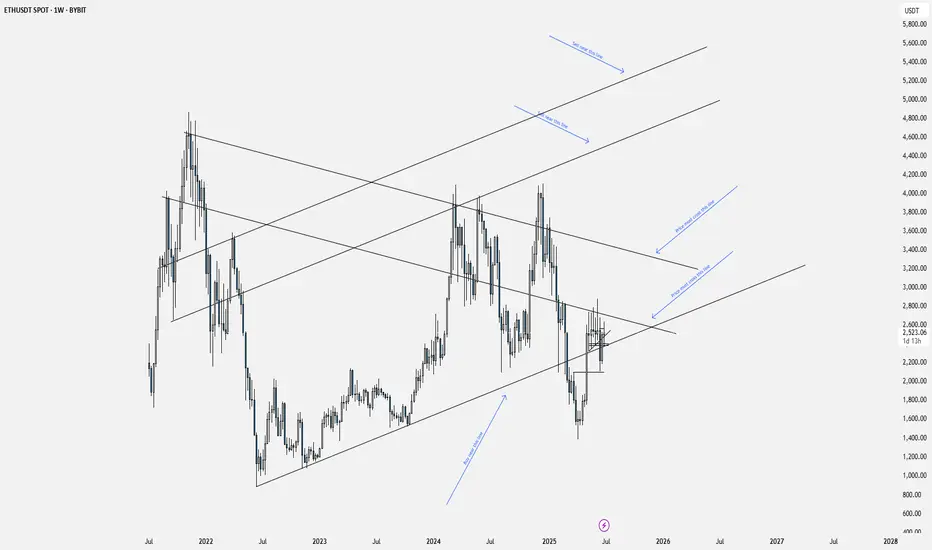
Eth revealed If you want to know the simplest way to trade in ETH for the next few years.
This is how Eth is moving.
We will discuss this further in January 2027.
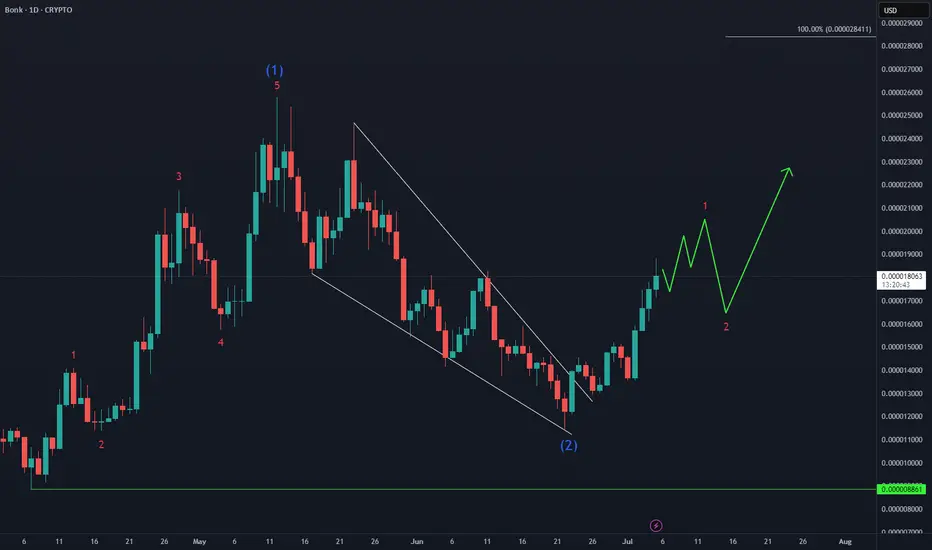
BONK Bullish Reversal in PlayAfter a clean 5-wave advance from the April low, CRYPTO:BONKUSD corrected 55%, then carved out a higher low last month. Now it’s eyeing a breakout above the May peak as the next leg higher begins.
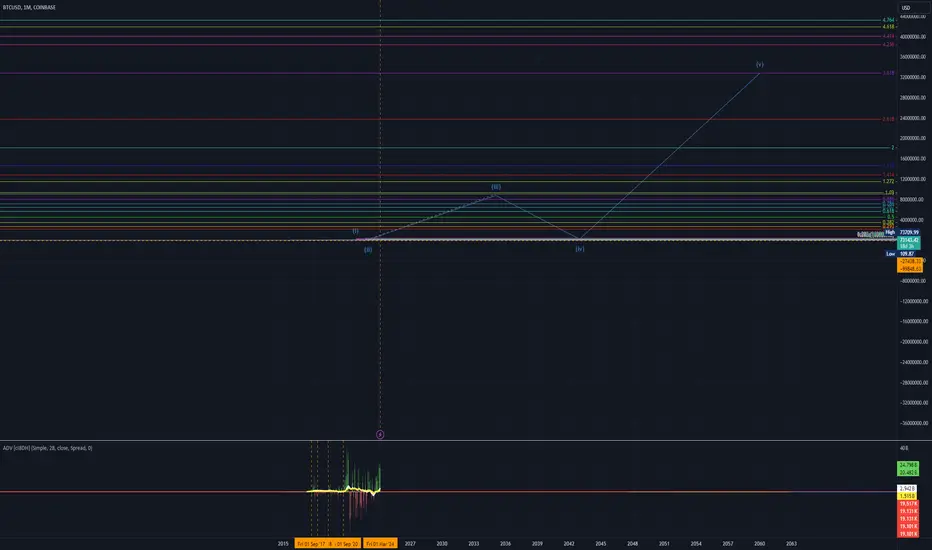
40 Year Rough EstimateThis chart looks silly, I know. Turn on log to see it a bit better. It sounds absurd, but so does just about any market.
The only thing I can see stopping this is a return to the gold standard. As long as money can be printed for free, it will. Bitcoin can't.
I suspect we'll start seeing the qSAT (quadrillionSAT) shorthand or something, because you can always add more zeroes.
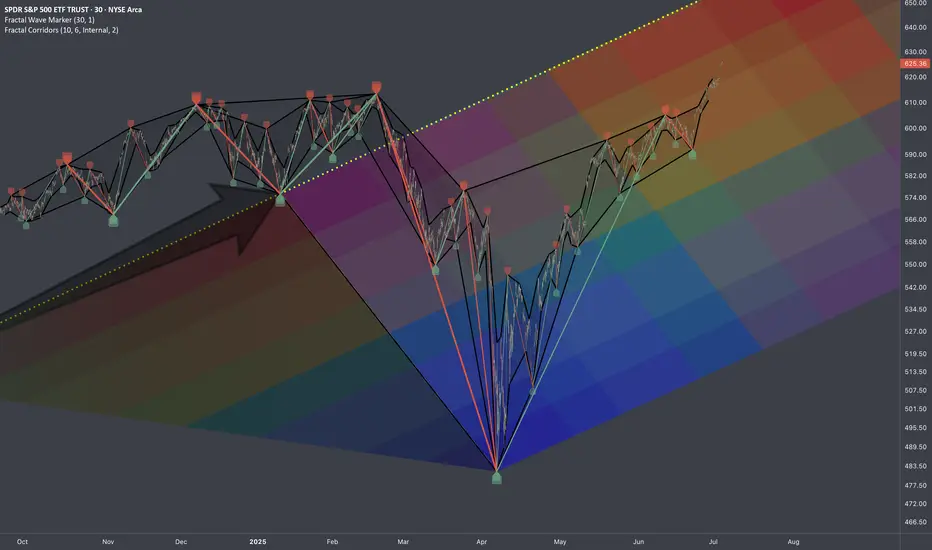
SP500: Fib Channels on Fractal Corridors Research Notes
Testing angle of trendline which acts as support then defines resistance.
Structural reference
Pattern expressed in Fibonacci:
Ascending:
Descending:
Fib Channels on Fractal Corridors supposed to show alternative mapping method which differs from following approach.
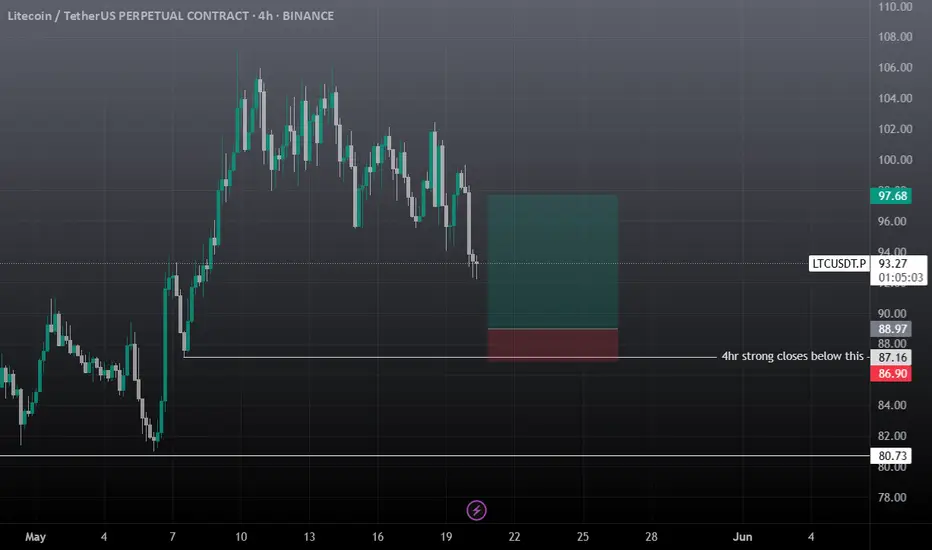
LTC Buy / Long SetupAs price wants to move in a range, SO that's another setup for LTC, invalidation is same as for short setup, candle closing below the mention zone immediately close the trade otherwise wick doesn't matter, wick do the damage body tells the story.
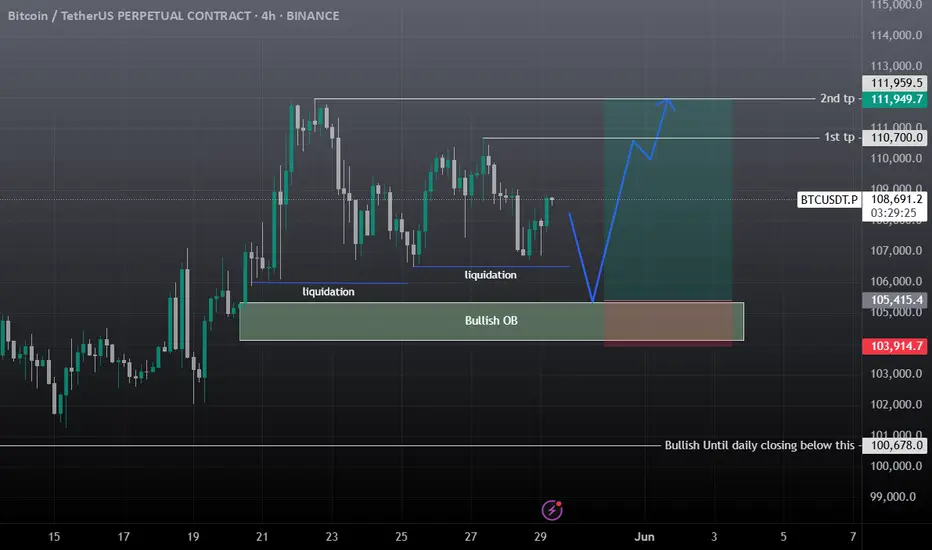
BTC Scalp Long / Buy SetupWait for the entry first, BTC must sweep the liquidation levels below side first then it should start pumping towards the tp, if it takes 2nd tp first then trade is not valid, if it takes first tp and then come back at entry level trade is still valid. if 4hr candle closing below the Bullish OB then close the position otherwise wick doesn't matter.
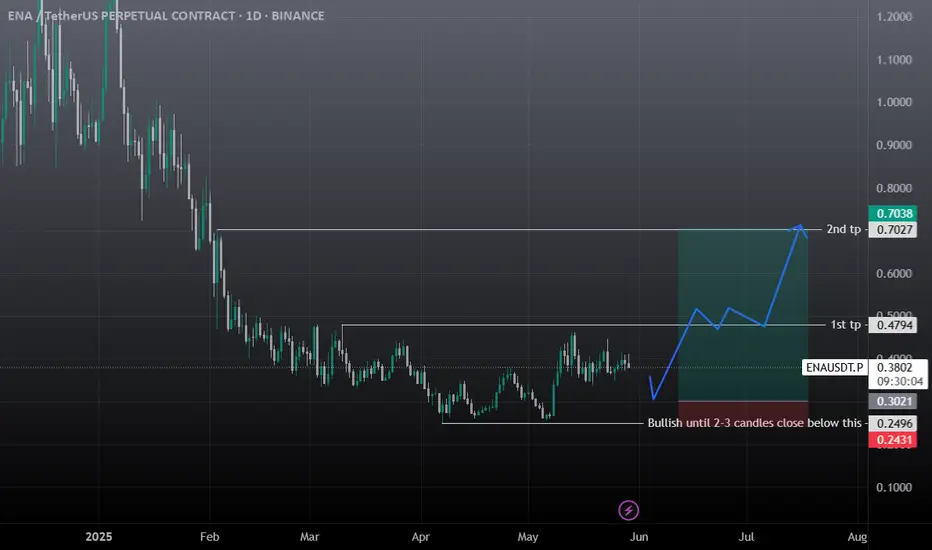
ENA Long / Buy Swing SetupENA Looking Good here, daily closing above 1st tp guaranteed tp 2. Ena can be the next SUI, Ondo. Below 0.31$ buying is a good choice and hold till 1st and then 2nd tp. While for the long term investors it has the potential to hit 2-3$ mark.
ETHUSDT Swing Trade AnalysisEth still struggling to break weekly bearish fvg, rather it's bullish or bearish, it must revisit the orange line which is daily bearish fvg, if it taps this and drops then a good sign , if it doesn't tap this and drops then it's a bad sign for eth, 3rd scenario is if we get any 4hr closing above the green line then I will not take the short and close short on the entry price, then I will short from the 3k area till 2.8k for scalp, if eth rejects from orange line 2583 then I will hold the trade till tp2. short only from the mention zone, if it doesn't tap the bearish fvg i will share another short trade with extended tps. remember that that yellow zone is important eth must retest it or break it to be bullish, without tapping this and drops then it's not a good sign for eth.

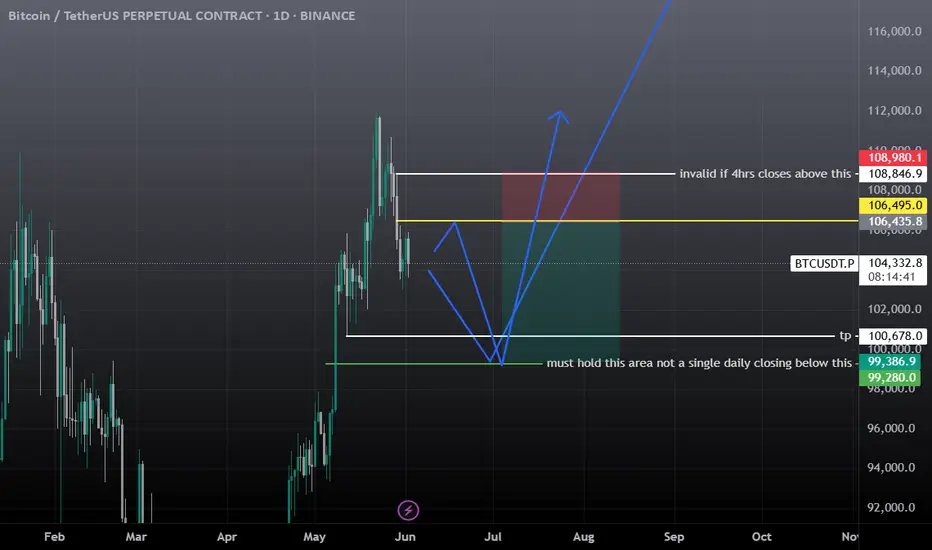
BTC Analysisfor here no trade zone, short from mentioned zone and keep the sl tight, I would prefer long from the 100k zone, if we get daily closing below the mentioned zone then will long from 92-90k area, target still remains the same 112k-120k
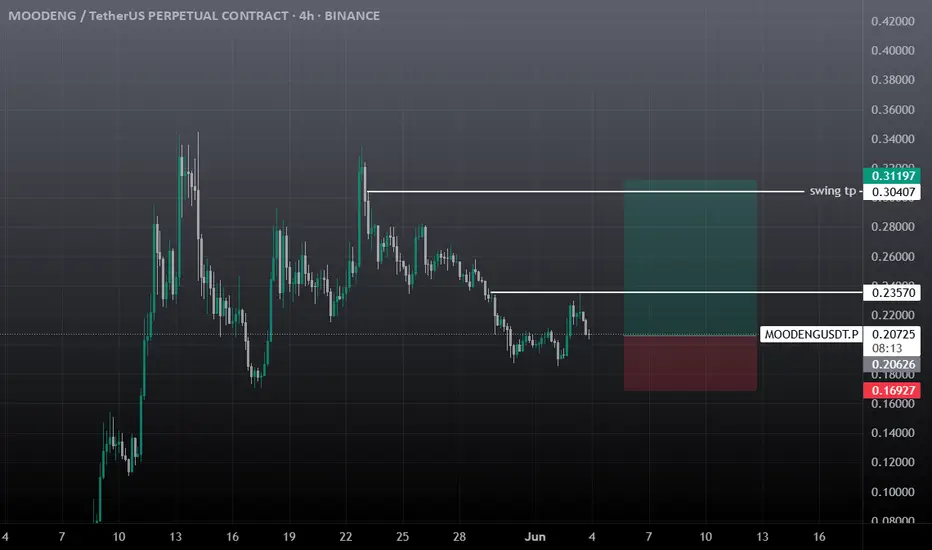
moodeng buy setup scalp & swingIf btc stays sideways till fri-sat it can hit swing tp, also during eid days I won't recommend you to take any trade due to dry volume, less volatility. It's a meme token so use tight sl and don't use high margin on this trade. Good Luck.
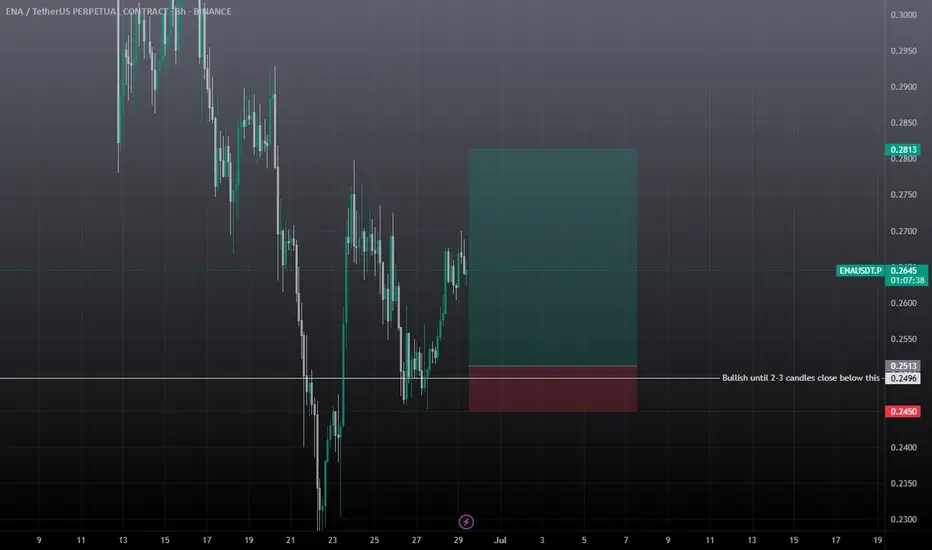
ENAUSDT Long / Buy SetupOn lower tf ena showing bullish momentum, while previous setups went bad due to war, but ena still holding the previous marked area, this is a short term setup not long term, still expecting another low for whole market. Will share swing setups if found strong momentum. Must use SL as btc as it's peak.
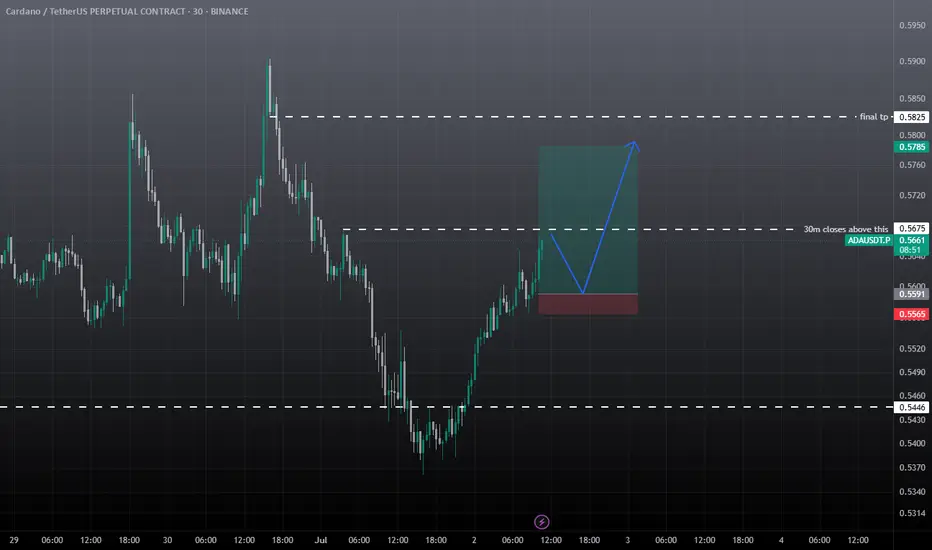
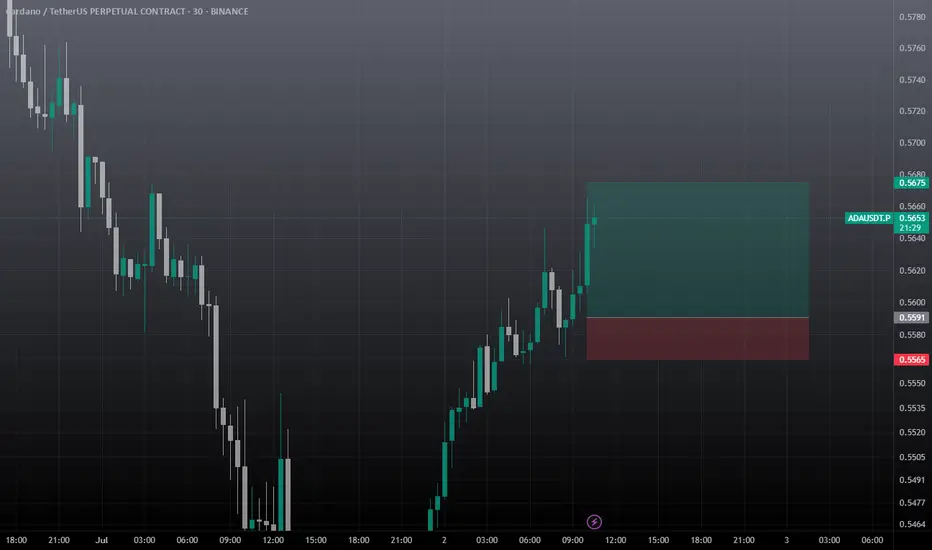
ADAUSDT Intraday SetupAda Showing some good movement. Trade Rules
must gave 30m candle closing above marked area, if wick above marked area then trade will become risky. Must use the sl. Target is given.
If retraces back before the marked area then it also good, in this case 30m marked area will first tp book 30% here, rest hold till final tp or SL.
ada usdt scalp tradeshort term pullback expected from ada, cardano so take it with small amount, trade entry based on 5m, so don't expect bigger targets. must use sl.
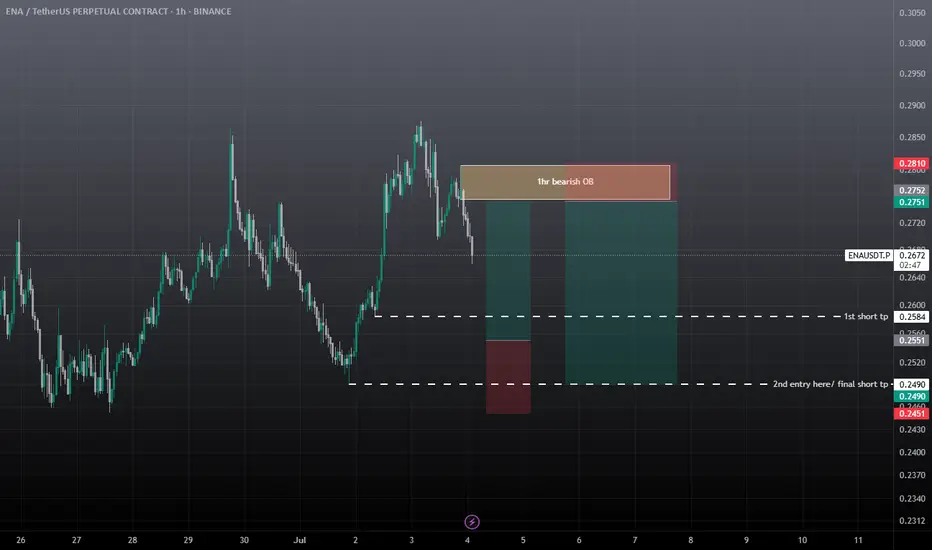
ENA SCALP & Intraday Setup Both Long & Short SetupWait for the entries to be filled first. If short entry achieved first then go for the short, if long entry achieved first then go for the long, in both cases must use SL, cause it's consolidating in a range, any side impulse move is expected from ena.
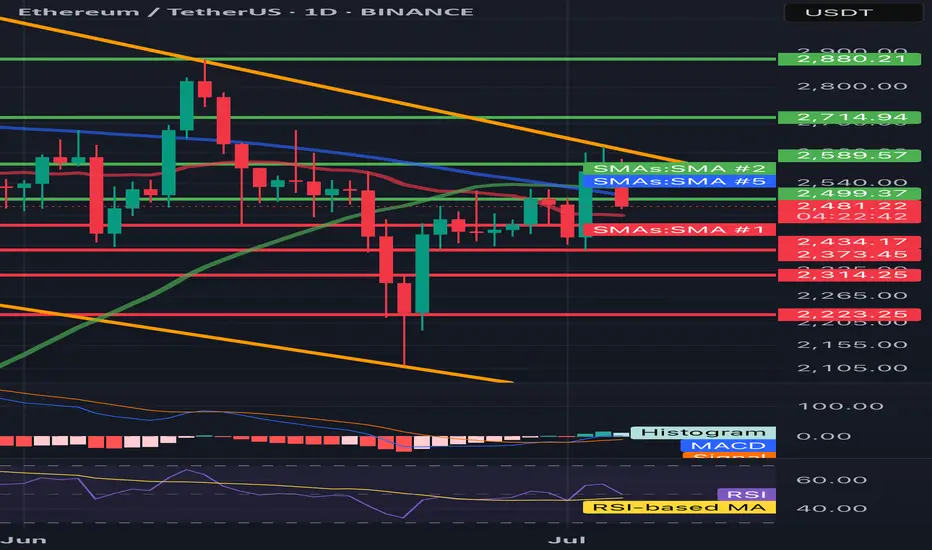
ETH/USDT 1D🔍 ETH/USDT - technical analysis (1D interval):
📉 Price: 2478 USDT (-4.36%)
🔧 Resistance:
• SMA 200 (green): ~ 2589
• Resistance zone: ~ 2715 → 2880 USDT
• SMA 100 (blue): ~ 2500 (just rejected)
🔧 Support:
• SMA 50 (red): ~ 2434 - currently tested
• Strong support: 2373, 2314, 2223 USDT
📊 indicators:
• MacD: freshly intersected, but the momentum is weakening
• RSI: ~ 45 - neutral/weak, under 50 (no bull strength)
• Trend: Still in the downward channel (yellow trend lines)
⸻
⚠️ Conclusions:
• Price rejected from 2500 (SMA 100) and flies down.
• If 2434 falls, a further discount is possible to 2373–2314.
• Lack of bulls with key resistance - the inheritance scenario dominates.
• Watch behavior at 2434 - this is now a key level.
EURCAD Wave Analysis – 4 July 2025- EURCAD reversed from support level 1.5950
- Likely to rise to resistance level 1.6100
EURCAD currency pair recently reversed up from the strong support level 1.5950 (former double top from April, acting as the support after it was broken).
The upward reversal from the support level 1.5950 continues the active short-term impulse wave 5 of the intermediate impulse wave (3) from last November.
Given the strong daily uptrend and the strongly bullish euro sentiment seen today, EURCAD currency pair can be expected to rise to the next resistance level 1.6100.

Bitcoin Euro is €82,000 nextIn this video I go through an idea that may take bitcoin down to the €82,000 region .
I cover the current price action and run through a scenario of bitcoin coming down to the Newley spawned quarterly pivots and faking out at the value area low before coming back up into the range .
The tools I used in the video are quarterly pivots , anchored vwap , Fibonacci, fixed range volume profile and a tpo chart .
Appreciate your following and Good luck with your trading !

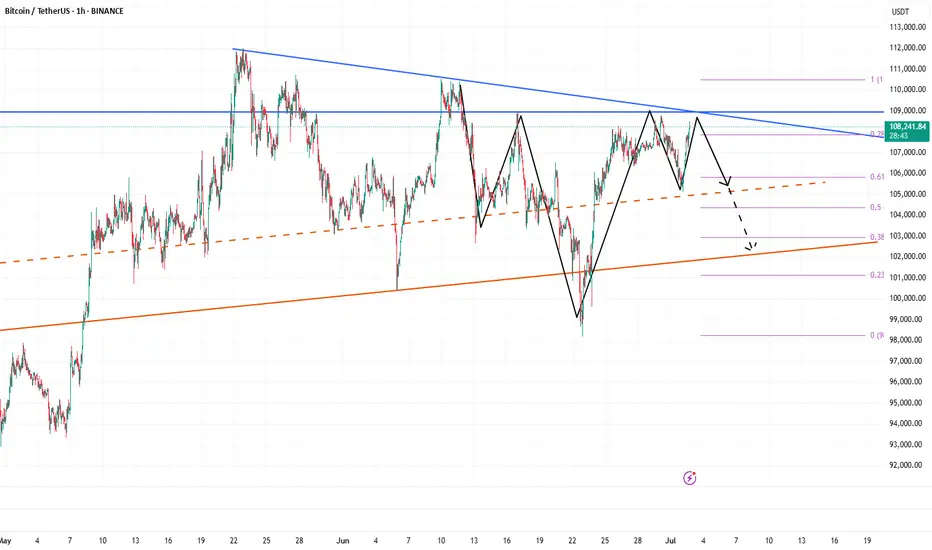
BTC shorting opportunity comes againBTC climbed above 108000 again, and the short-term bullish power was slightly stronger. According to the current strength, BTC still has room for growth, but it is still under pressure in the 109000-110000 area in the short term; if there is no major positive news, BTC may find it difficult to break through the resistance area in the short term under the current conditions, and may even experience stagflation and retreat again after approaching the resistance area.
Therefore, I think shorting BTC with the help of the resistance area is still the first choice for short-term trading. We can boldly short BTC in the 108500-109500 area and look towards the target area around 106000 again.
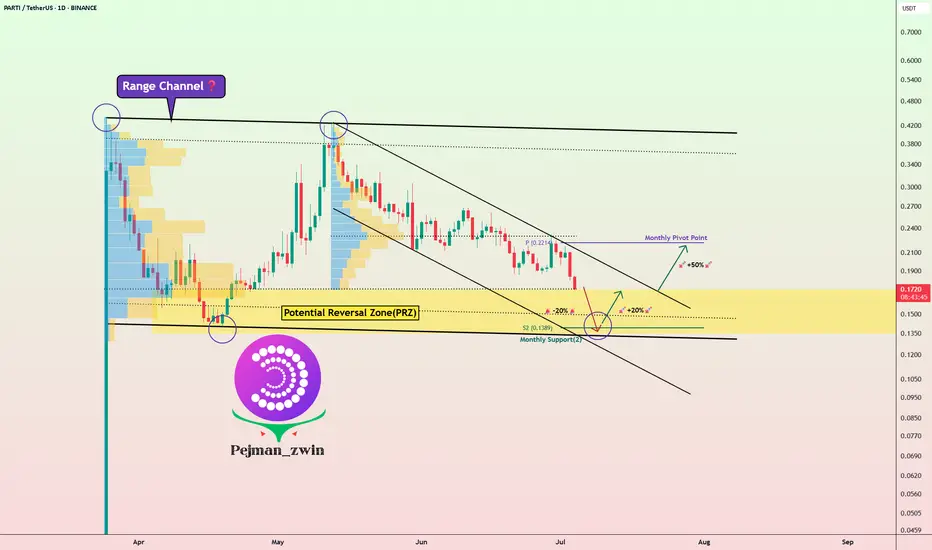
PARTI Setup: Key Reversal Zone Could Spark +50% RallyToday, I want to analyze the Particle Network ( BINANCE:PARTIUSDT ) project for you, which has a chance of increasing by +20% to +50% in the short term .
Let's first take a look at the fundamental state of the Particle Network (PARTI) project .
Particle Network is building a modular Layer-1 blockchain with a focus on Chain Abstraction, aiming to unify user experiences across multiple chains through:
Universal Accounts – Single account across all chains
Universal Liquidity – Access liquidity without bridging
Universal Gas – Seamless cross-chain transactions without gas token concerns
The project has:
Raised $25M+ funding from top-tier investors (Binance Labs, Animoca Brands, Spartan Group)
Integrated with 60+ blockchains and 900+ dApps
Reached over 1.3M testnet accounts and 27,100 daily transactions (Messari Q1 2025 report)
Recently launched UniversalX (a cross-chain DEX) as its flagship dApp
Summary:
Particle Network shows strong fundamentals with innovative tech, a growing ecosystem, and backing from major players in crypto. Long-term success will depend on user adoption of Universal Accounts and dApps like UniversalX.
------------------------------------------------------
Now let's take a look at the PARTI token chart on the daily time frame .
PARTI token is currently trading near Potential Reversal Zone(PRZ) , Monthly Support(2) . There is also a possibility of a Range channel forming, we should wait for the confirmation of the second bottom .
I expect the PARTI token to start rising again from the Potential Reversal Zone(PRZ) and near $0.14 .
Note: Stop Loss(SL)= $0.1177
Please respect each other's ideas and express them politely if you agree or disagree.
Particle Network Analyze (PARTIUSDT), Daily time frame.
Be sure to follow the updated ideas.
Do not forget to put a Stop loss for your positions (For every position you want to open).
Please follow your strategy and updates; this is just my Idea, and I will gladly see your ideas in this post.
Please do not forget the ✅' like '✅ button 🙏😊 & Share it with your friends; thanks, and Trade safe.
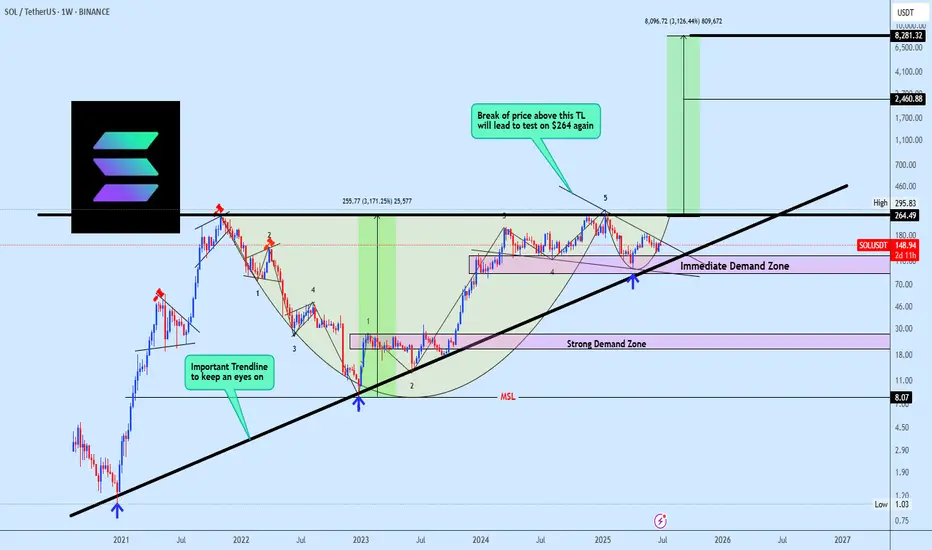
SOLUSDT Holding Long Term Trendline SupportSOLUSDT continues to show strong bullish structure, with price consistently holding above a multi-year ascending trendline a key structural element that has defined its uptrend. This dynamic support has anchored price action within a broader ascending formation, reflecting steady long-term accumulation.
Additionally, the chart reveals a well defined Cup and Handle formation, further reinforcing the bullish outlook. As long as price respects the immediate demand zone, this area remains a prime region for re-accumulation, with expectations for it to hold as a firm support level.
The projected target for this setup is clearly illustrated on the chart, aligning with the broader bullish continuation narrative.
Share your view, do you see SOLUSDT pushing higher from here, or is a deeper retest likely before the breakout?
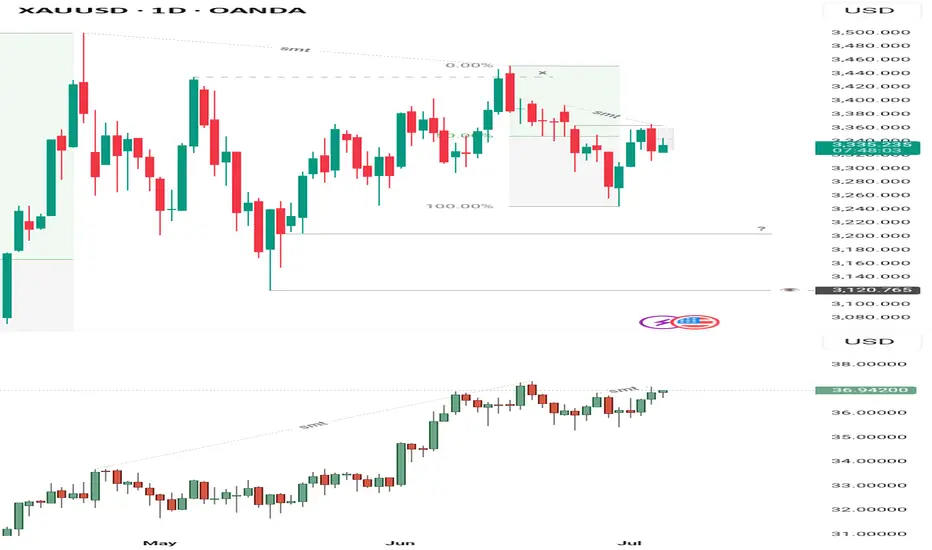
Gold-Silver Discrepancy Analysis – Reevaluation After NFP ReactiAfter taking a loss yesterday, I had to reassess my outlook on Gold. The market behavior leading into and following the NFP event revealed significant discrepancies between Gold and Silver that can’t be ignored.
Since April 24th — the day Gold printed its highest price in human history — the daily chart has shown consistent lower low formations. In contrast, Silver had been forming higher highs on the daily during this same period, showing relative strength.
However, this dynamic began to shift. On the 4-hour chart, Silver is now printing lower lows from last month’s high, aligning more closely with Gold, which has been bearish on both the daily and 4-hour timeframes since its peak.
A key moment occurred just before the NFP release: Silver made a strong run above last week’s high, while Gold failed to even trade above Wednesday’s high — which coincides with the gap fill from last week Tuesday’s open. This divergence in price behavior is crucial.
Gold closed yesterday with a full-bodied bearish engulfing candle, rejecting that same gap area. Meanwhile, Silver’s breakout above last week’s high, despite its internal weakness, is a clear discrepancy of value.
Now, with Silver beginning to shift into lower low structure on the daily and no bullish market structure shift present on the 4-hour chart, the bullish narrative weakens. This divergence between both metals—especially as Silver shows signs of internal breakdown—suggests a high-probability case that the market may be preparing for a broader downside move rather than continuation to the upside.
That said, the key level at 3225/3200, which I marked during my previous bullish outlook, remains on watch. Price reaction at this zone will be critical in determining whether the market still has a chance to reclaim bullish intent or if the short bias continues to play out. If the bearish pressure holds, 3120 becomes a likely target—and a deeper fall toward 2960 wouldn’t be surprising either, considering it aligns with a key discount zone from the weekly timeframe.
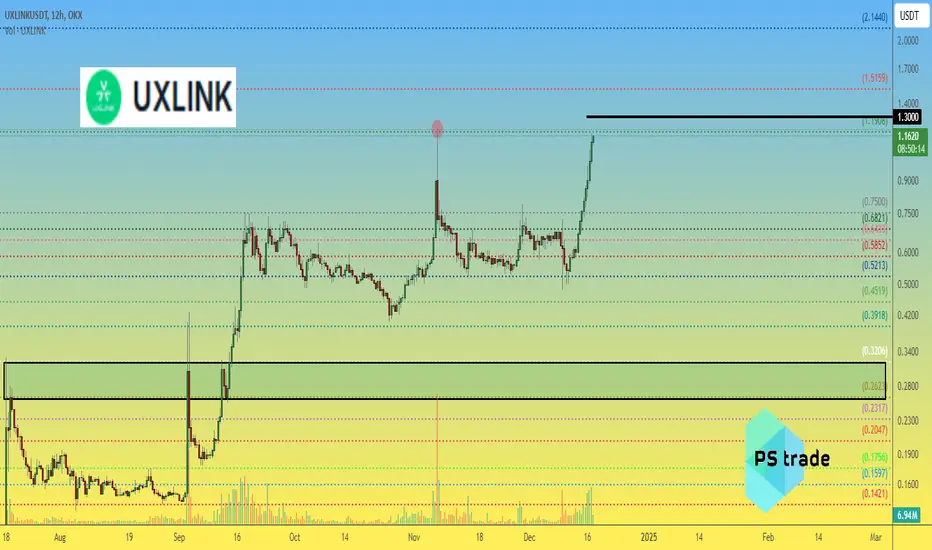
UXLINK price powerfully pumping😱 Totally manipulative asset - $UXlink
When all the altos are growing, OKX:UXLINKUSDT price is in a falling consolidation, when most altos start to “feel bad”, then #UXLINK is pummped.
Now, the MM's goal is obvious - to break the feet of shorts and organize a “short squeeze” and sell a large portion of the asset at high volumes.
Therefore:
1️⃣ Don't shorts - it's too early.
2️⃣ Move your stops at a long position or use a trigger stop.
3️⃣ Short squeeze - are close, above $1.20, it will be sharp... to $1.30 or even to $1.50, or even to $2.15... it is unknown, time will tell)
The only thing that is known is that those who like to trade such manipulative assets will get an unforgettable adrenaline rush, but afterwards the taste will be twofold...
Better watch without participating!)
P.S:
we would buy, not earlier than at $0.26-0.32
_____________________
Did you like our analysis? Leave a comment, like, and follow to get more