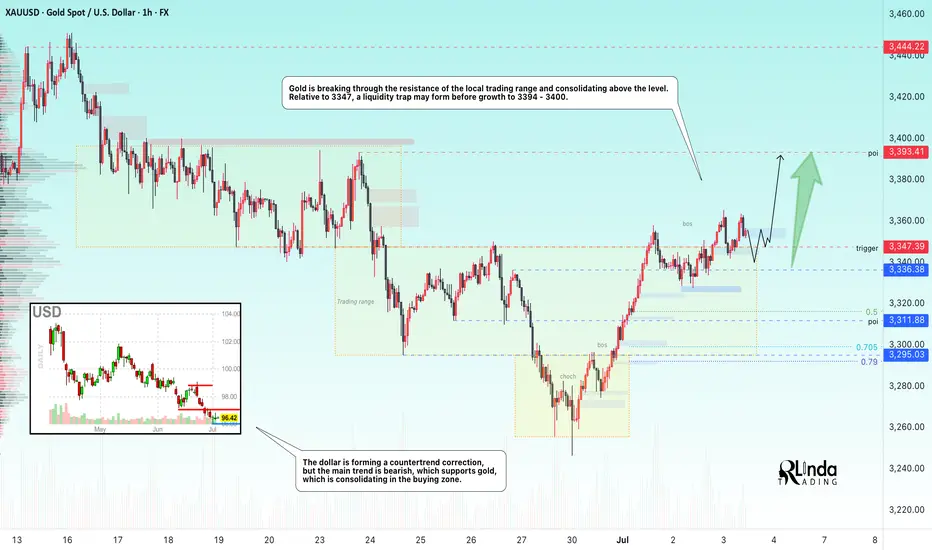
GOLD → Attempt to consolidate above 3350 for growth to 3400FX:XAUUSD , after retesting resistance at 3347, is breaking through the key level, while bulls are trying to hold their ground above support. There is potential for growth to 3400.
Gold retreated from its weekly high of $3366 ahead of key US employment data (NFP), which could set a new direction for the movement. But technically, this looks like a correction to consolidate above the level before continuing to rise. After three days of growth, the price faced selling amid a recovery in the dollar and profit-taking. Weak employment data (especially below 100,000) could reinforce expectations of a Fed rate cut as early as July and support gold. Conversely, a strong report will strengthen the dollar and put pressure on the metal. The market is bracing for high volatility
Resistance levels: 3363, 3393, 3400
Support levels: 3347, 3336, 3311
The price has entered a new range of 3345-3400. Consolidation is forming above the support level before a possible rise. I do not rule out another retest of 3345-3336 (liquidity zone) before realization and a rally to 3400.
Best regards, R. Linda!
Fibonacci
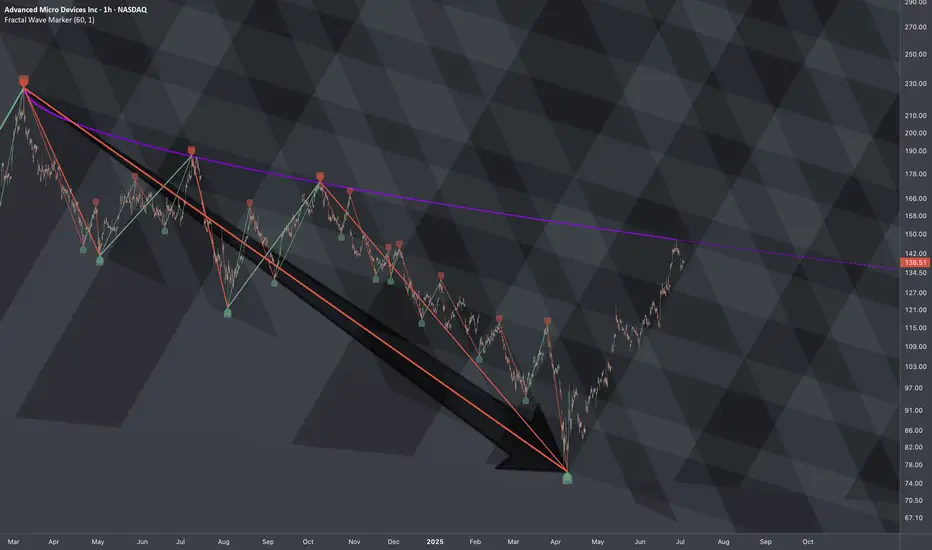
AMD: Wave DimensionsProjection via Historic Wave Dimensions
Fractal Wave Marker with settings: core period of 60 and 1 Phi Scaling on1h TF AMD chart
From point of 3rd degree wave's reference:
If resistance curve is violated:
Mapping a cycle:
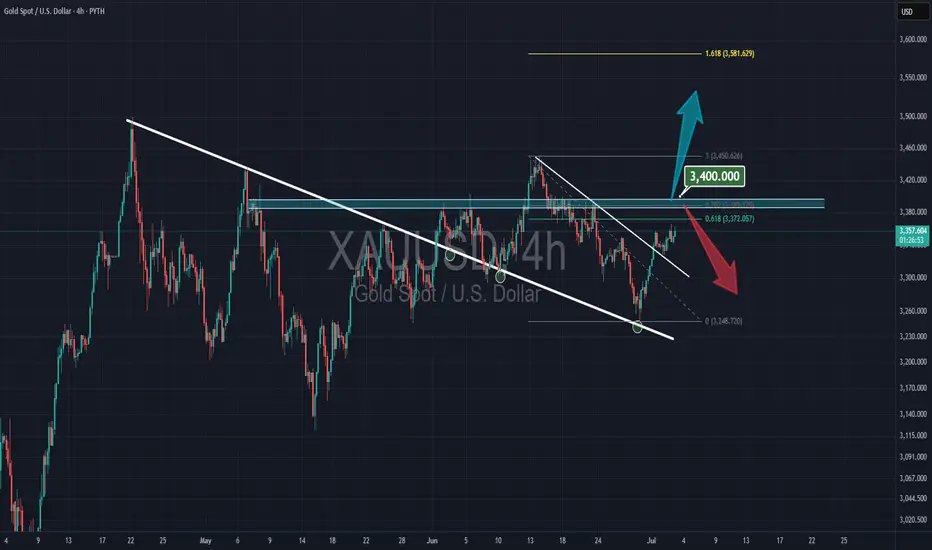
Gold & $3400Gold is under the resistance at $3400 for a long time, and if can not break that then downside movement will come.
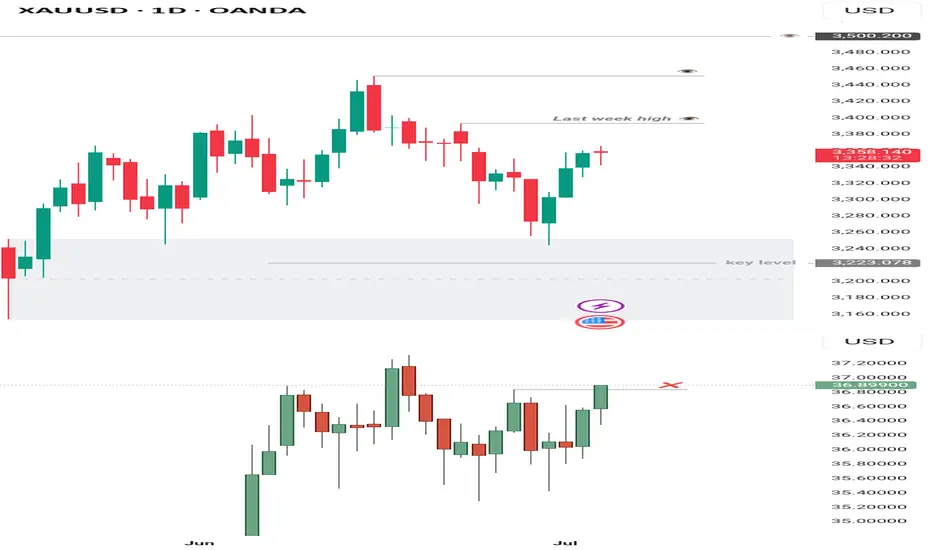
Gold Analysis – Daily Outlook
I initially anticipated a deeper move toward 3225 — the 25–30% retracement zone of the discount array — but price bounced quickly during Monday’s open, then confirmed a market structure shift by breaking above 3350. However, the buy signal wasn’t convincing at the time, as Silver lagged and leaned bearish.
Following the latest 4H chart, Silver has now invalidated the short idea by trading above 36.83, which offers stronger confirmation for the bullish bias — far clearer than what was seen on Monday.
Retracement might occur around last week’s high at 3394, offering a possible discount re-entry point before further upside. Still, price could head straight toward ATH, so keeping 3394 in view remains wise.
BTC Breakdown Escalates Bearish MomentumBitcoin has officially broken below the critical 104K support level, invalidating the recent short-term bullish structure. The price action reflects a clear shift in market sentiment, confirmed by the bearish EMA/SMA crossover and a firm rejection from the strong supply zone between 110K–111.8K.
This rejection formed a clean lower high around 110K, followed by a decisive drop below the weak supply area and failure to hold 104K a key level previously acting as a demand floor. The current structure now favors downside continuation, with the 98K zone as immediate focus.
If bearish momentum persists, attention will shift toward the Weak Potential Reversal Zone and eventually the Recommended Buy Back Zone around the 84K–86K area. This zone aligns with a historical support range and may offer high-probability entries for medium-term accumulation.
Until price reclaims the 104K–105.5K region, rallies are likely to be sold off within the supply zones. Short-term traders may look to trade the breakdown toward the highlighted support levels, while long-term investors should monitor price reaction within the buyback region.

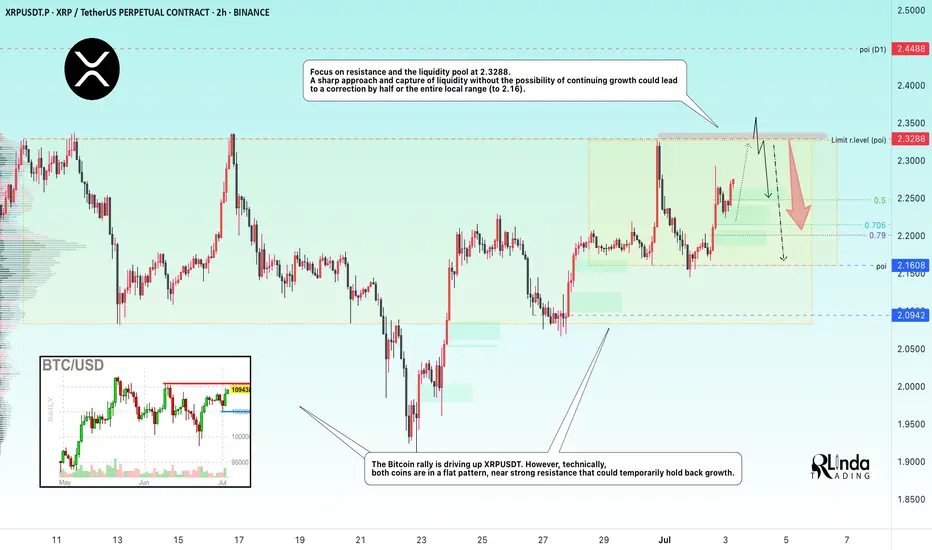
XRPUSDT → Resistance retest. Coin inside the flatBINANCE:XRPUSDT is rising towards resistance at 2.3288 due to a shift in the fundamental background to positive and a rally in Bitcoin, but there is always a but...
On the daily chart, XRP is trading below strong trend resistance, and there is also a fairly strong and voluminous liquidity pool at 2.3300 ahead, which could provide strong resistance. Bitcoin is also approaching its critical level of 110500, which may temporarily hold back growth, and a correction in the flagship could trigger a correction in the rest of the market...
Focus on resistance and the liquidity pool at 2.3288. A sharp approach and capture of liquidity without the possibility of continuing growth could lead to a correction by half or the entire local range (to 2.16).
Resistance levels: 2.3288, 2.357, 2.45
Support levels: 2.25, 2.213, 2.16
If the retest of resistance at 2.3288 ends in a false breakout, then subsequent consolidation below the level could trigger a correction to the above support and interest zones.
Best regards, R. Linda!
AUDCHF AUDCHF is preparing to break through support and fallWeak market structure. Gradually declining lows and no reaction to support at 0.5211. Buyers are trying to keep the price above 0.5211, but under market pressure their strength is weakening.
Relative to 0.5211, we see the formation of consolidation, which is of a “pre-breakdown” nature.
Accordingly, a break below the 0.5211 support level could trigger the activation of buyers' SL orders, leading to liquidation and a downward price distribution.
Potential targets include 0.518 and 0.5164.

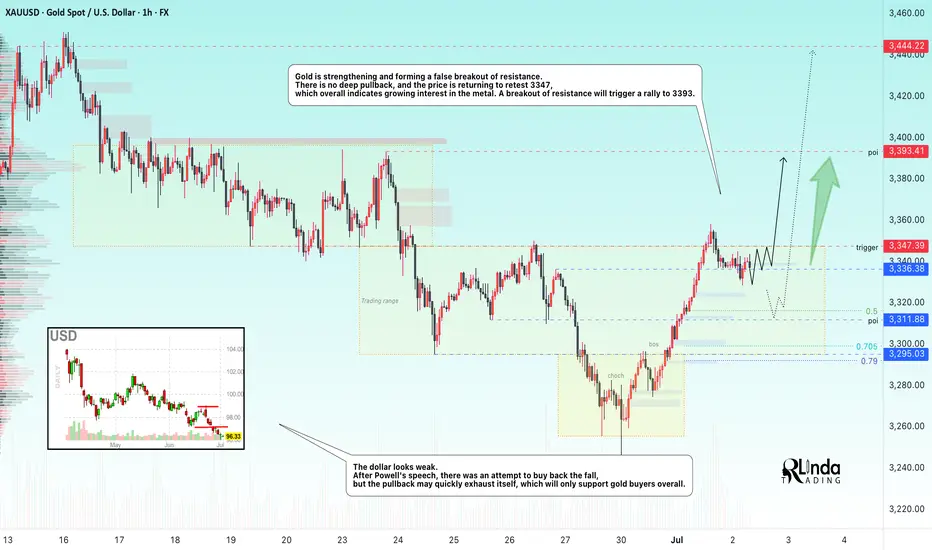
GOLD → Retesting resistance may lead to a breakout.FX:XAUUSD breaks the downward resistance line on the senior timeframe and tests the upper limit of the trading range amid the falling dollar and Powell's speech. The metal may continue its upward movement.
The dollar's rise was short-lived after Fed Chairman Jerome Powell hinted at an imminent interest rate cut, but not in July... The probability of a rate cut in July fell to 22%, and in September to 72%.
Markets are awaiting fresh employment data (ADP and Nonfarm Payrolls), which could influence the prospects for rate cuts. Weak reports could revive interest in gold, but for now, the asset remains under pressure due to the short-term strengthening of the dollar and uncertainty surrounding Fed policy.
Technically, if the pre-breakout structure remains intact and gold continues to attack resistance within the local range of 3347-3330 (3335), the chances of further growth will be high...
Resistance levels: 3347, 3358
Support levels: 3336, 3316, 3311
The global trend is upward, and locally, the price is also returning to growth. If the bulls can maintain the current trend, break through the resistance at 3347, and hold their ground above this level, then the next target will be 3390-3400. I do not rule out a correction to 3325, 3316 (liquidity hunt) before the growth continues.
Best regards, R. Linda!
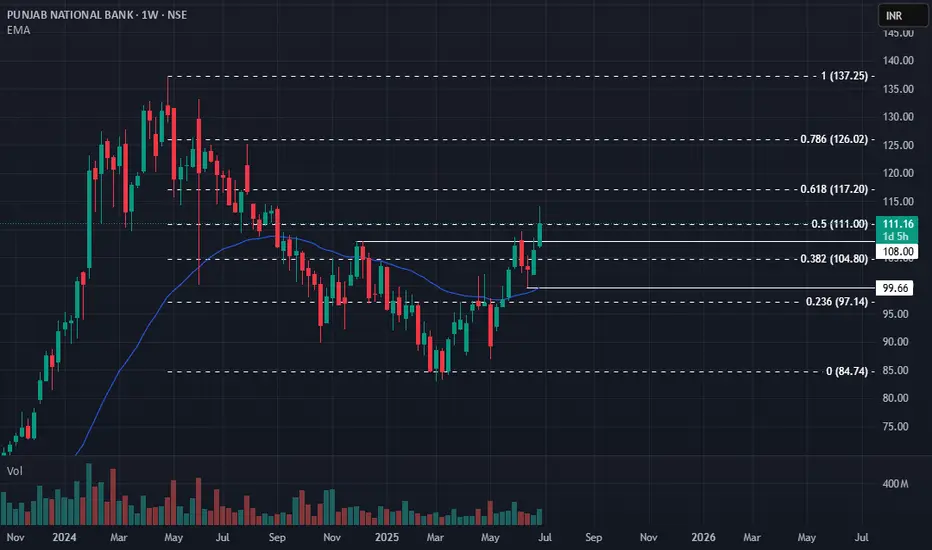
PNB: Weekly Rounding Bottom Breakout! 🚀 PNB: Weekly Rounding Bottom Breakout! 🚀
📉 CMP: ₹111.16
🔒 Stop Loss: ₹99
🎯 Targets: ₹117 | ₹126 | ₹133
🔍 Why PNB Looks Strong?
✅ Technical Breakout: Rounding bottom breakout confirmed on weekly charts
✅ Retest Support: Successful retest at 40 EMA, strengthening bullish bias
✅ Sector Boost: With rate cuts supporting banking, PNB as a laggard may catch up with upside momentum, especially with improving results
💡 Strategy & Risk Management:
📈 Staggered Entry: Ideal to accumulate in phases
🔒 Strict SL: Maintain stop loss at ₹99 to manage downside risk
📍 Outlook: Strong technical setup + sector tailwind = promising swing and positional trade opportunity.
📉 Disclaimer: Not SEBI-registered. Please do your own research or consult a financial advisor before investing.
#PNB #BankingStocks #BreakoutTrading #TechnicalAnalysis #SwingTrading #StockMarketIndia #InvestmentOpportunities
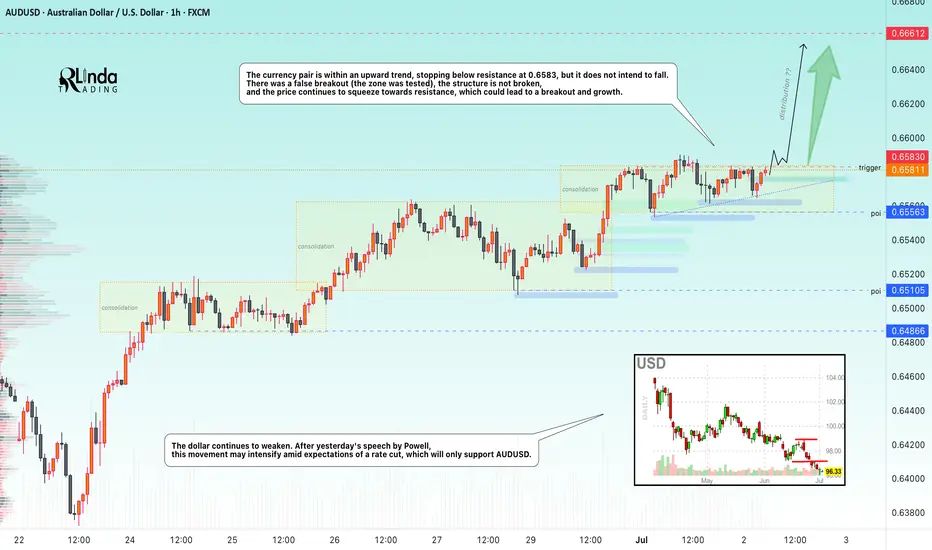
AUDUSD → Pre-breakout consolidation for trend continuationFX:AUDUSD may continue its upward trend. After another local distribution, the currency pair is consolidating and may repeat the cycle
The dollar index continues to fall, the global trend is clear, and the price is testing multi-year lows. After yesterday's speech by Powell, the decline may intensify amid expectations of a rate cut, which will only support AUDUSD.
AUDUSD is moving within an uptrend, stopping below resistance at 0.6583, but is not going to fall.
There was a false breakout (the zone was tested), the structure is not broken, and the price continues to squeeze towards resistance, which could lead to a breakout and growth
Resistance levels: 0.6583
Support levels: 0.6566, 0.6556
There is potential accumulation in the market, and the market is choosing growth against the backdrop of a falling dollar as its direction. Accordingly, the currency pair is one step away from a possible realization phase. Thus, if the price breaks 0.6583 and consolidates above this zone, it may continue to grow in the short and medium term.
Best regards, R. Linda!
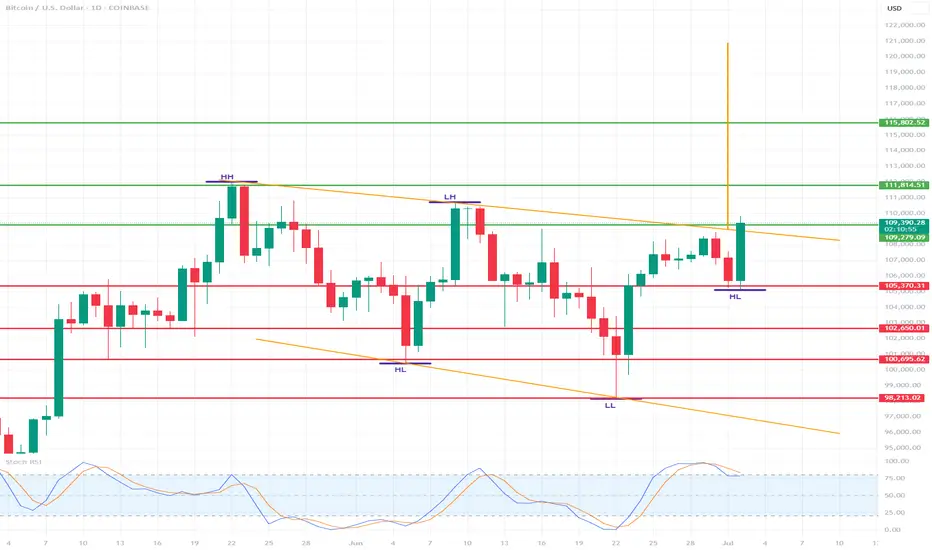
BTC with potential for $115,000/$120,000🔍 Market structure (Price Action)
📈 Trend:
The market previously formed higher highs (HH) and higher lows (HL) – a classic uptrend.
Then there was a correction and a lower high (LH) and lower low (LL) appeared – a potential change in the trend to a downtrend.
The last two lows are again HL (Higher Lows) – suggesting an attempt to return to the uptrend.
🔄 Key support and resistance levels
✅ Resistance (green horizontal lines):
117.469 – local resistance and potential breakout target from the current range.
115.802 – confirmed resistance from previous consolidations.
111.814 – strong local resistance (LH – Lower High formed there).
109.341 – current resistance, the price is currently testing it.
🛑 Support (red horizontal lines):
105.370 – local support, price reacted at this level in recent days.
102.650 – important support, level of previous HL.
100.095 – consolidation level before breaking out upwards.
98.213 – last LL – very important level in the context of defending the structure.
🧭 Structure of peaks and troughs
HH: Higher High – confirmed the previous uptrend.
LH: Lower High – first warning about changing the structure to down.
LL: Lower Low – confirmed a potential change to downside.
HL (x2): two more higher lows – suggest a possible return to growth.
📊 Stochastic RSI (at the bottom of the chart)
The oscillator is currently in the overbought zone (>80), approaching a downward crossover.
It suggests a possible short-term halt in growth or correction.
But in strong trends it may "stick" to the upper range.
📌 Potential scenarios:
🟢 Bullish:
If the price breaks above 109.341, it may test 111.814 and then 115.802.
Continuation of the HL → HH formation will confirm a trend reversal and further growth.
🔴 Bearish:
If the price does not stay above 109k and breaks below 105.370, there is a risk of a test of 102.650 and lower.
A break of 100.095 and especially 98.213 will negate the growth structure.
🧠 Conclusions:
The market is at a key decision point - HL formation vs. resistance zone.
Buyers' strength will be confirmed only after breaking 111-112k.
Stochastic RSI warns of potential pullback or consolidation.
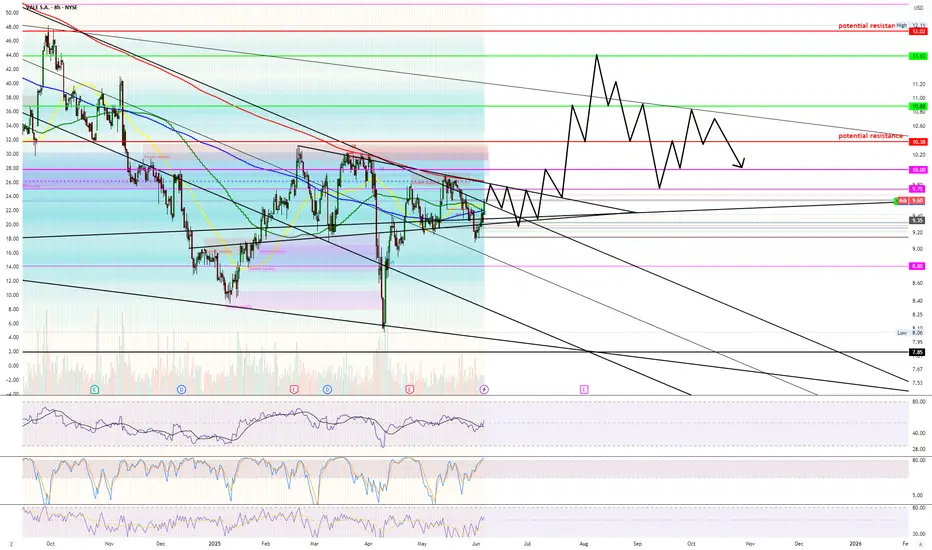
$10 is looking realistic... if Mr. T doesn't mess it up lolWe have a lot of $10 call options on every expiration date for the next few months, meaning this move might take a while to play out. Unsure of exact date if its earnings call or news but $10 seems to be where the focus is.
If tariffs begin or effect Brazil negatively then this stock could plunge on low growth anticipation.
Watch very very closely on how price reacts to $9 IF we even go down there.
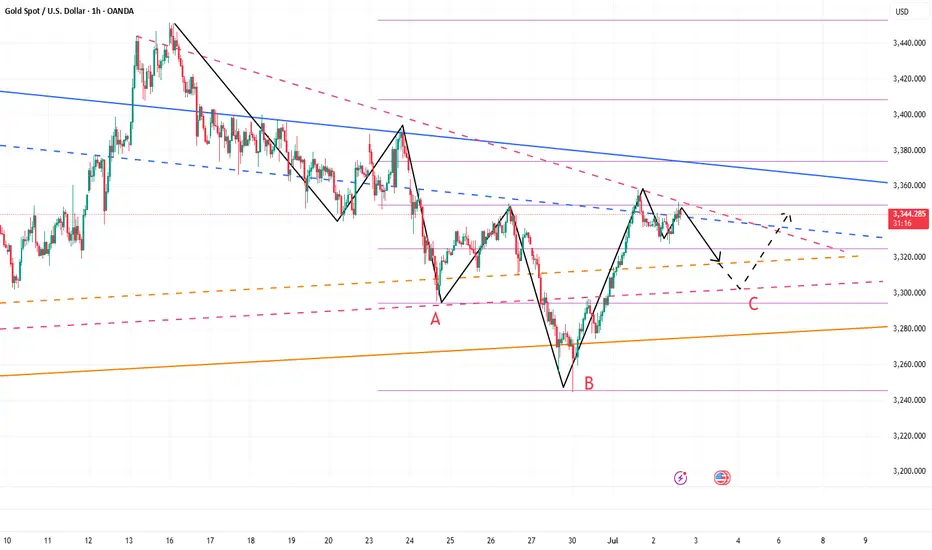
I have shorted gold as expected and held on patientlyEven under the influence of the ADP data, which is bullish for the gold market, gold has not effectively broken through 3350, and even showed signs of falling back after rising several times. The resistance above is becoming more and more obvious, which may further weaken the market's bullish sentiment and confidence, thereby strengthening the dominance of the bears.
Although gold has not effectively fallen yet, from the perspective of the gold structure, even if gold wants to rise, it still needs to be backtested and support confirmed before rising, and the current retracement is far from enough, so gold still has a need for structural retracement; and before the NFP market, gold rose slowly but was far from enough to break upward, and there was no volume support, so the illusion of gold rising may be to lure and capture more bulls;
Therefore, out of caution, I try to avoid chasing gold at high levels; and I believe that shorting gold is still the first choice for short-term trading at present. And I have executed short trades in the 3340-3350 area according to the trading plan, and held it patiently. I hope that gold can retreat to the 3320-3310-3300 area as expected.
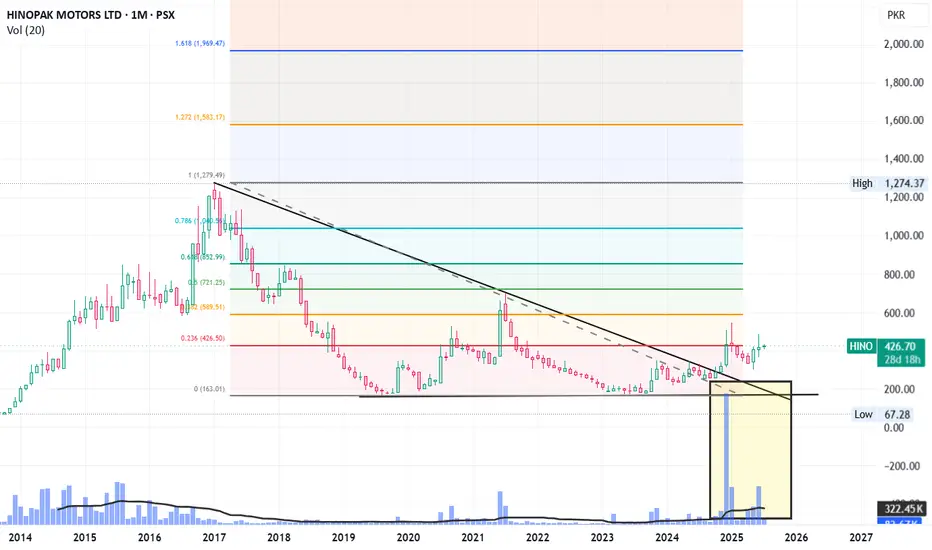
HINO LongHino broke its downward channel line in November 24. It posted a high of 545 in Jan 25 and came back to retest the level which broke the downward channel (~300).
Now it is exactly at its Fib 0.236 level, crossing which, it will pace up and move towards its next levels.
Next levels are: 545, 589, 721 and 853 in short to medium term.
Long terms target can be its all-time high level of 1274.
Its not a buy / sell call, just my personal opinion.
Daily, weekly and Monthly RSI are all at or around 60 that show positive momentum.
Moreover, the increasing volumes since it broke downward channel showing active players ;)
One thing to note that its free float is very low, that will cause its very fast move upward (whenever it may be)
Analysis on circle using tpo and regular chart longs and shortMust watch video giving 2 really nice Risk reward entries on the Newley listed stock Circle
In this video I highlight a region using limited data of where to get filled if you missed the IPO and want to buy some circle .
We are currently in a no trade zone for buyers as I anticipate that price will gravitate down to the .786/.886 level over time .
In this video I also use the TPO chart "Time price opportunity" and demonstrate what i am looking for from using this type of chart to add to my confluences for a high probability trade .
Also identified in the chart is a short trade off of the weekly pivots and the value area high of the range .
Thankyou for watching and i welcome any questions

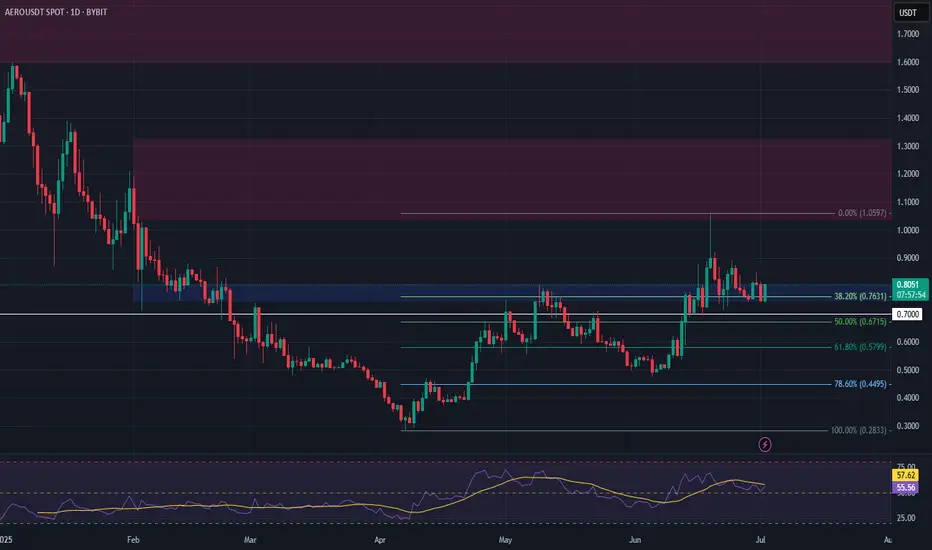
AERO Long Swing Setup – Strong Pullback into Fibonacci SupportAERO has shown notable strength in recent months and is now retracing into a key support zone, aligning with the 38.2% Fibonacci level. The $0.75–$0.80 area offers a solid long swing opportunity.
📌 Trade Setup:
• Entry Zone: $0.75 – $0.80
• Take Profit Targets:
o 🥇 $1.04 – $1.32
o 🥈 $1.60 – $2.05
• Stop Loss: Daily close below $0.70
How much higher for Platinum futures In this video I look at the current price of platinum on a higher tf and forecast where I believe the cool down to this rally might begin.
Using tools like the fib extension, volume profile and speed fan we are able to highlight a major reaction zone ahead at $1600 region .
Set alerts at these key levels for what might prove to be a solid short entry or a rejection , retest and claim for higher levels like the 1.618 ext .

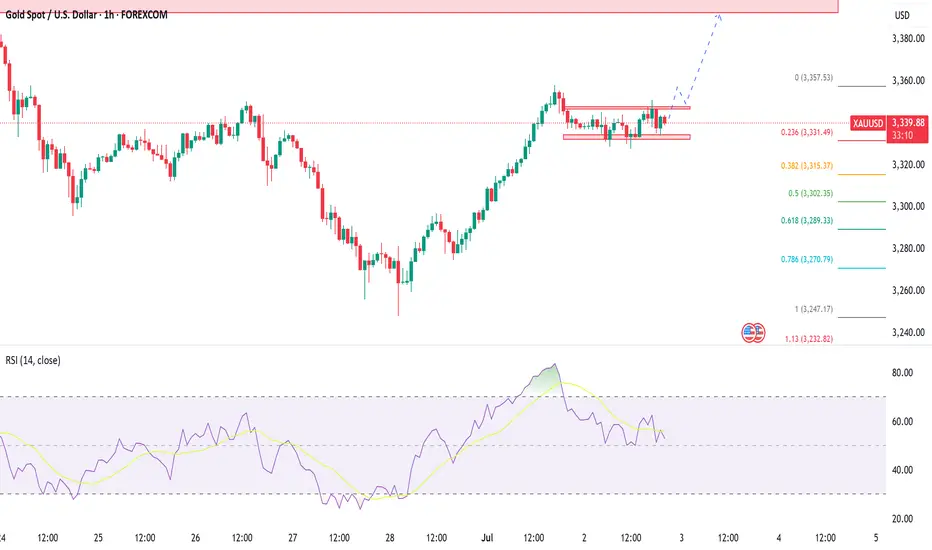
Gold LongGold is likely to go long, supported by technicals as well as fundamental data. Powell's speech and today's ADP non farm employment data support the global uptrend of gold. Technically, it needs to breakout 3347 and close above it. That will trigger the upward momentum targeting 3390-3400 zone.
I do not rule out a decline to the bottom of the range (which confluences with 0.236 fib) before further upward momentum. What do you guys think?
Bitcoin: 170k–180k?If you find this information inspiring/helpful, please consider a boost and follow! Any questions or comments, please leave a comment!
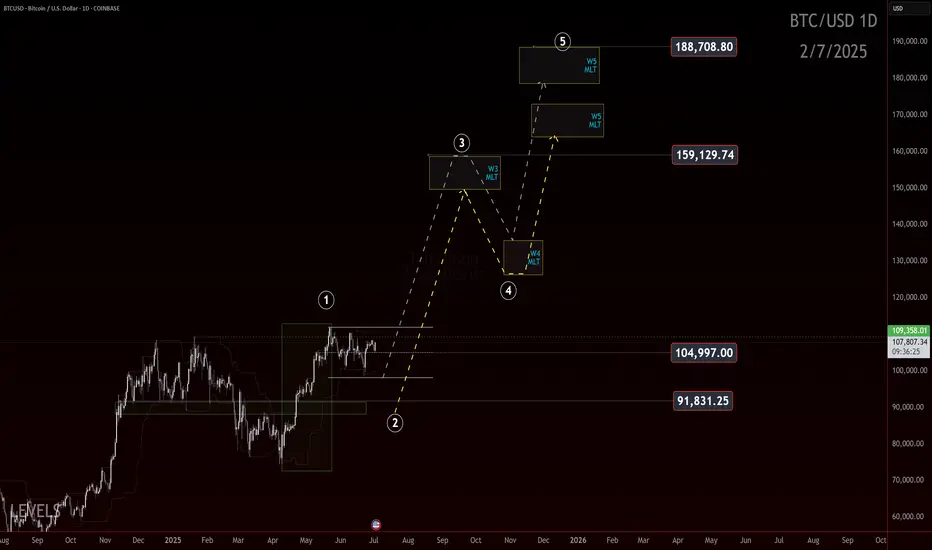
Bitcoin: 170k to 180k?
Let’s talk bias.
We’ve seen a powerful move off the 75k low, and it’s hitting some markers of a potential wave 1 impulse. If that structure holds and price doesn’t come back to wipe out the lows in a wave 2 retracement, then this is what we’d be looking at.
The idea? This is a conservative roadmap built off Elliott Wave Fibonacci projections and it targets the 170k to 180k zone.
Now, let’s be clear. This is a conservative projection. We’re not talking hopium fueled 250k moon targets here. We have no proof of that yet. We're anchoring the wave count and saying: if this is a 1, we’re due a 2, and then a 3 takes us to the upper levels.
But there’s a catch. Always is.
If price starts to fade back through the 91.8k area in a deep aggressive retrace, this roadmap gets less likely. Breaking the 75k pivot means the impulse structure failed or was misread, and we shift the count.
Until then, the 170k–180k level is a possible destination based on this roadmap.
Trade Safe!
Trade Clarity!
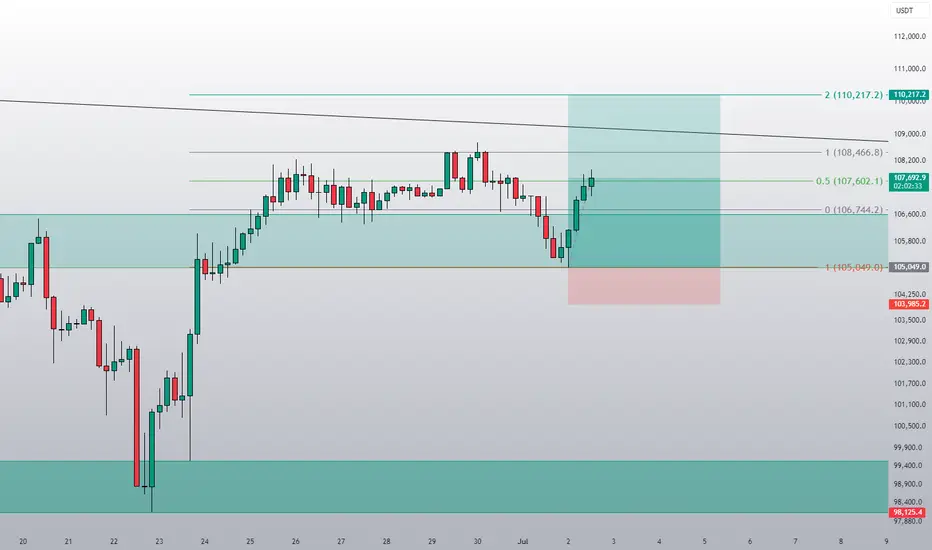
This is exactly how I like it!This is textbook range trading. A break below the range by the same size aligns with the 0.5 Fibonacci level of the entire underlying correction, followed by a bounce back into the range. The next step is to take the 0.5 Fibonacci level of the range itself. If that level is broken, the next target is the upper band of the range. Should that also be breached, we are then aiming for Fibonacci level 2 — or the moon.
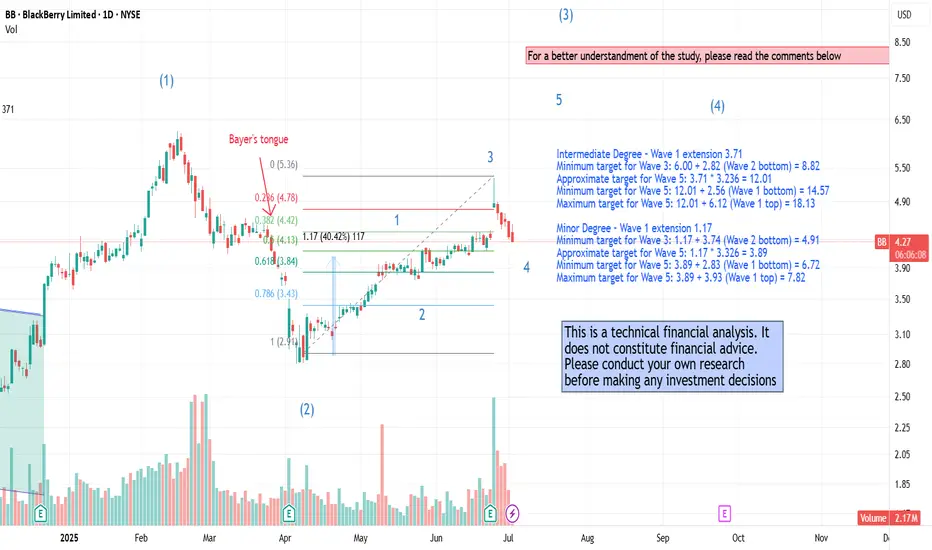
Quick BB updates - Minor MovementAs we've observed, it appears we're currently in a Minor Cycle at the end of the 4th wave, aligning closely with the Fibonacci target for this wave.
The last financial quarter delivered strong results, and I genuinely like the direction the company is heading. In my view, this could represent the most significant core business shift in the past 30 years.
As always, please do your own research before investing, this is not financial advice.
Have a blessed week!
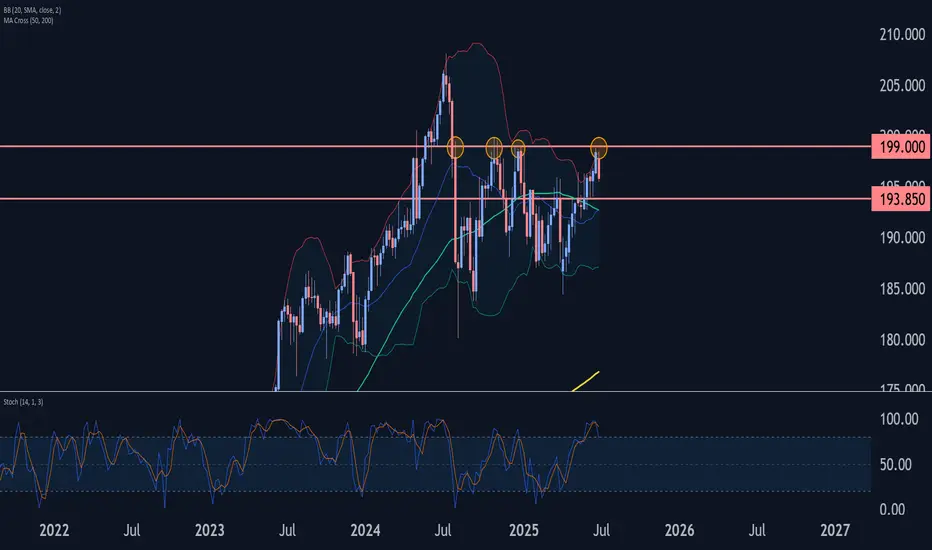
GBPJPY Wave Analysis – 2 July 2025- GBPJPY reversed from resistance zone
- Likely to fall to support level 193.85
GBPJPY currency pair recently reversed down from the resistance zone between the strong resistance level 199.000 (which has been reversing the price from last October) and the upper weekly Bollinger Band.
The downward reversal from this resistance zone stopped the C-wave of the previous ABC correction (2) from April.
Given the strength of the resistance level 199.000 and the overbought weekly Stochastic GBPJPY currency pair can be expected to fall to the next support level 193.85.
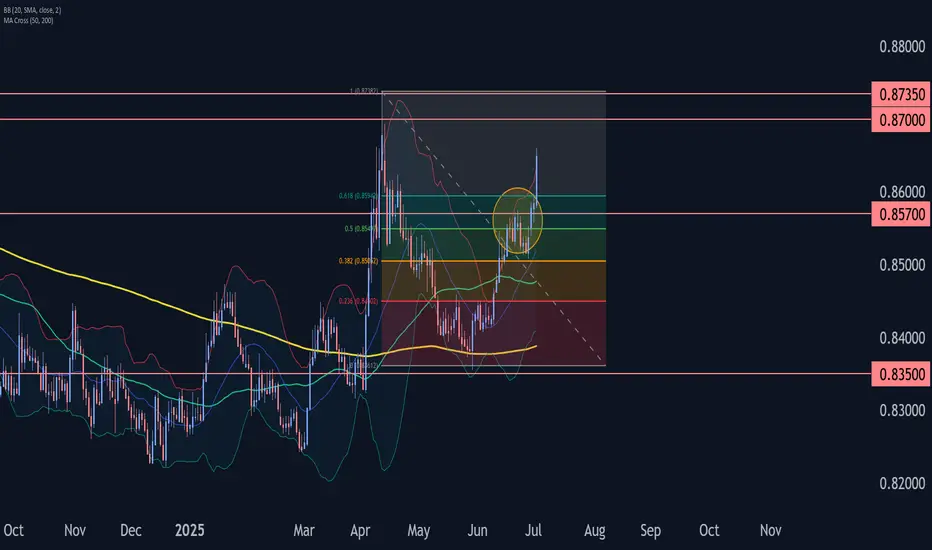
EURGBP Wave Analysis – 2 July 2025- EURGBP broke resistance zone
- Likely to rise to resistance level 0.8700
EURGBP currency pair recently broke the resistance zone between the resistance level 0.8570 (which stopped the previous impulse wave i at the end of June) and the 61.8% Fibonacci correction of the downward impulse (B) from April.
The breakout of this resistance zone accelerated the active minor impulse wave 3 of the intermediate impulse wave (C) from May.
EURGBP currency pair can be expected to rise to the next resistance level 0.8700 (which is intersecting with the daily up channel from May).