Nasdaq Short: multiple reasonsOver here, I present to you the Nasdaq short idea again. For my previous idea, it was stopped out at 23500. This time, I changed the wave counts again, mainly merging the previous wave 5 into wave 3, allowing for the new high to be a wave 5.
On top of that, here are the few other reasons for the short:
1. Fibonacci extension levels: Wave 5 is slightly more than Wave 1.
2. RSI overbought for the 3rd time on the hourly timeframe.
3. Rising wedge false breakout.
4. Head-and-shoulders on the 1-min timeframe.
As usual, the stop for this idea is slightly above the recent high, around 23700.
Thank you.
Fibonacci

UK 100 – Moving Back Into the Spotlight It’s been a while since we covered the UK 100, but it feels like recent moves and the fact there is a Bank of England (BoE) rate decision next Thursday (August 7th) means it warrants some extra attention.
For much of 2025 the UK 100 has been the under achiever when compared to other European indices, but things have changed slightly in July as a result of the breakout above the previous all-time high at 8909 (more on this below in technical update) which has led to multiple record peaks all the way up to the most recent one registered on July 28th at 9177.
This up move has been aided by bullish technical momentum, a weaker GBPUSD exchange rate, which can add support to the index given that UK 100 companies are multi-national, earning over 60% of their revenue outside of the UK, and increased expectations for a BoE rate cut of 25bps (0.25%) at their next rate meeting on Thursday August 7th.
Now, looking forward, before traders get ready for that BoE meeting, they must contend with the challenges presented by President Trump’s trade policy and two key US economic data releases that could impact sentiment towards the UK 100 into the weekend. The first piece of data is the US PCE Index inflation print, released later today at 1330 BST and the second is tomorrow’s Non-farm Payrolls update at 1330 BST.
Once traders have more clarity on the outlook for global trade after President Trump’s August 1st tariff deadline has passed, alongside the fresh insight into the current path of US inflation and the health of the labour market provided by these two pivotal pieces of economic data, their preparation can begin for a potential 25bps (0.25%) rate cut in the UK, as the market expects and the accompanying commentary from BoE Governor Bailey in the press conference on whether more cuts could be in the pipeline across the remaining months of 2025.
Technical Update: Assessing the Current Uptrend
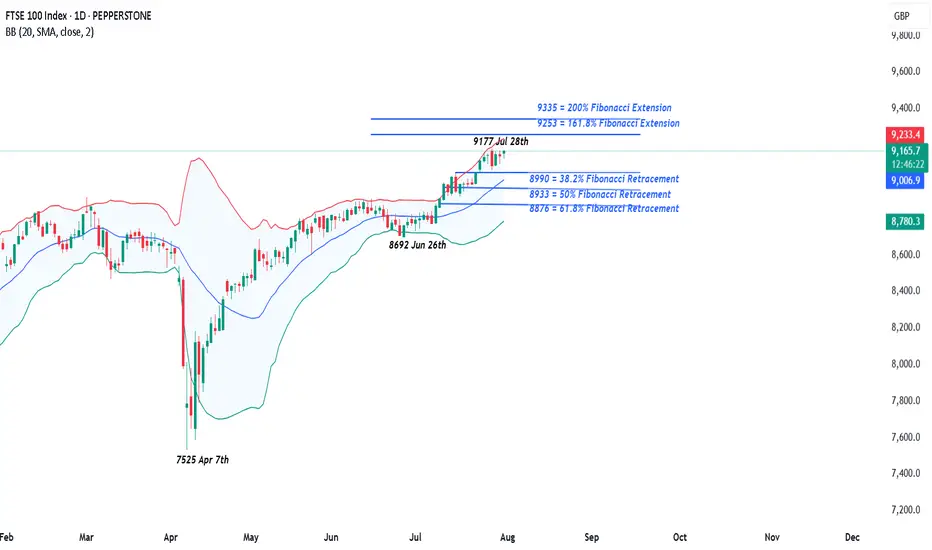
Since posting a low of 7525 on April 7th it has been a positive period of trading for the UK 100 index, a move that has seen a near 22% advance. As the chart below shows, except for the decline down to 8692 on June 26th, this has been an almost uninterrupted phase of price strength, as a positive pattern of higher price highs and higher price lows has materialised.
Of course, there is no guarantee that this type of positive pattern will extend and continue to see new all-time highs posted, but traders may be anticipating further attempts at upside price extension, especially while support below current price levels remains intact.
So, with this in mind, let’s look at what could be the relevant support and resistance levels that might influence trader sentiment over upcoming sessions.
Potential Support Levels:
While Monday did see a new all-time high posted at 9177, a price sell-off then materialised to register a low for the day at 9060, but with support being found at this level, it might be suggested this now represents a higher low within the positive trend and as such, is potentially now the first support focus, as the chart below shows.
Traders may find it useful to monitor how 9060 performs as a support on a closing basis, as if it were to give way over coming sessions, a more extended phase of price weakness may result. Such downside support breaks could then see the focus shift to the 38.2% Fibonacci retracement of June 26th to July 28th strength which stands at 8990, possibly even the 50% level at 8933.
Potential Resistance Levels:
Having been capped by the July 28th high at 9177, the UK 100 index may now need to see successful closing breaks above this level to suggest a continuation of the recent positive price trend.
Successful closing breaks above the 9177 high, may be an indication of continued price strength, opening potential for moves to the next possible resistance at 9253, which is the 161.8% Fibonacci extension, even 9335, the higher 200% extension level.
The material provided here has not been prepared accordance with legal requirements designed to promote the independence of investment research and as such is considered to be a marketing communication. Whilst it is not subject to any prohibition on dealing ahead of the dissemination of investment research, we will not seek to take any advantage before providing it to our clients.
Pepperstone doesn’t represent that the material provided here is accurate, current or complete, and therefore shouldn’t be relied upon as such. The information, whether from a third party or not, isn’t to be considered as a recommendation; or an offer to buy or sell; or the solicitation of an offer to buy or sell any security, financial product or instrument; or to participate in any particular trading strategy. It does not take into account readers’ financial situation or investment objectives. We advise any readers of this content to seek their own advice. Without the approval of Pepperstone, reproduction or redistribution of this information isn’t permitted.
U.S. Dollar Index (DXY) – Pro Analysis | 1H Chart |1. Strong Bullish Momentum
DXY broke out sharply above the 99.41 resistance, showing clear strength from bulls with minimal pullbacks during the rally.
2. Short-Term Rejection at Supply
Price was rejected from the 99.978 zone — a key supply area. This indicates the presence of active sellers near the psychological 100 level.
3. Retesting Breakout Structure
Currently hovering just above 99.669, the DXY is retesting the previous breakout level. This could act as short-term support if bullish momentum resumes.
4. Next Key Zones
Resistance: 99.978 → 100.534
Support: 99.411 → 98.92
Break below 99.411 may invalidate the breakout.
5. Outlook
Bias remains bullish above 99.41. However, failure to reclaim 99.978 soon may signal temporary exhaustion or consolidation before next leg up.

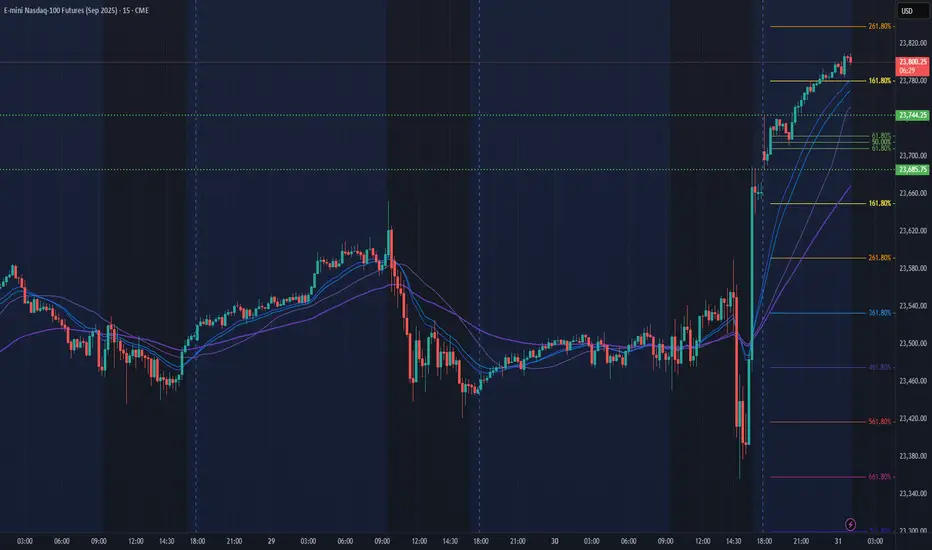
NQ Power Range Report with FIB Ext - 7/31/2025 SessionCME_MINI:NQU2025
- PR High: 23744.25
- PR Low: 23686.00
- NZ Spread: 130.5
Key scheduled economic events:
08:30 | Initial Jobless Claims
- Core PCE Price Index (MoM|YoY)
09:45 | Chicago PMI
New ATHs through Asian hours
Session Open Stats (As of 12:25 AM 7/31)
- Session Open ATR: 244.46
- Volume: 32K
- Open Int: 283K
- Trend Grade: Long
- From BA ATH: -0.6% (Rounded)
Key Levels (Rounded - Think of these as ranges)
- Long: 23811
- Mid: 22096
- Short: 20383
Keep in mind this is not speculation or a prediction. Only a report of the Power Range with Fib extensions for target hunting. Do your DD! You determine your risk tolerance. You are fully capable of making your own decisions.
BA: Back Adjusted
BuZ/BeZ: Bull Zone / Bear Zone
NZ: Neutral Zone
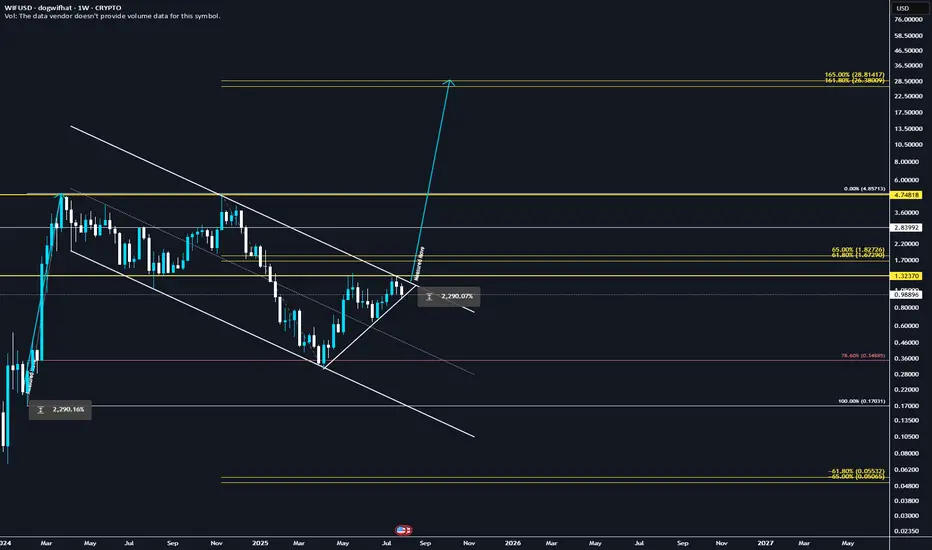
They're lying! WIF will explode to 28.8$ ✅ Golden Pocket Extension: $28.80 aligns with the 1.618–1.65 fib extension (golden pocket zone) from the last major impulse.
✅ Measured Move: Breakout from the prior downward consolidation projects to ~$28.80 when using the height of the range added to the breakout point.
✅ Confluence = High Probability: Both fib extension and measured move target the same zone, increasing confidence.
✅ Momentum + Meme Rotation: If broader meme coin rotation continues, WIF has narrative + volatility fuel.
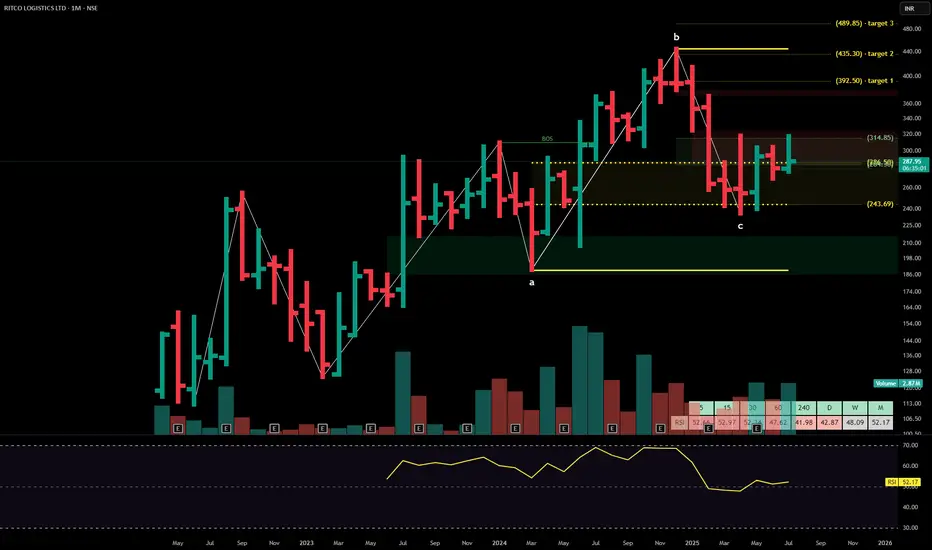
RITCO LOGISTICSRitco Logistics Ltd. – Full Report
Ritco Logistics Ltd. (currently trading at ₹314.85) is a mid-cap logistics and transport services provider, with operational hubs across India. The company focuses on multi-modal freight movement, contract logistics, and integrated warehousing solutions. It caters to clients in FMCG, automotive, and heavy industries. Ritco has been expanding fleet infrastructure and digitizing supply chain management to enhance delivery efficiency and customer responsiveness.
Ritco Logistics Ltd. – FY22–FY25 Snapshot
Sales – ₹500 Cr → ₹560 Cr → ₹625 Cr → ₹695 Cr Organic growth through fleet expansion and segment penetration
Net Profit – ₹32 Cr → ₹37 Cr → ₹42 Cr → ₹48 Cr Margin lift through route optimization and tech adoption
Operating Performance – Moderate → Strong → Strong → Strong Efficiency gains from digitized logistics management
Dividend Yield (%) – 0.00% → 0.00% → 0.30% → 0.35% Introduction of modest payouts as profitability improves
Equity Capital – ₹20.25 Cr (constant) Conservative structure with minimal dilution
Total Debt – ₹98 Cr → ₹90 Cr → ₹82 Cr → ₹74 Cr Gradual deleveraging from operating cash flows
Fixed Assets – ₹85 Cr → ₹90 Cr → ₹95 Cr → ₹102 Cr Fleet additions and warehouse infra development
Institutional Interest & Ownership Trends
Promoter holding is stable at 66.47% with no pledging. FII interest remains low given the mid-cap profile, while HNI participation has increased following breakout patterns. Institutional exposure is selective, focused on logistics-oriented strategies and small-cap momentum plays.
Business Growth Verdict
Ritco is growing steadily across freight, contract logistics, and digital enablement Margins are improving due to operational leverage and fleet efficiency Debt is being reduced gradually, supported by growing cash flows Digitization initiatives are likely to support scale and client retention
Management Con Call
Management highlighted ongoing fleet capacity additions and increased client onboarding in logistics-as-a-service vertical. Backward integrations in warehousing and last-mile delivery have begun to support margin improvements. The company remains focused on Tier-2 and Tier-3 freight growth. FY26 guidance suggests mid-teen revenue growth and margin consistency, with stronger tech enablement and route-level profitability.
Final Investment Verdict
Ritco Logistics Ltd. presents an efficient and scalable logistics story backed by disciplined operations and tech-driven optimization. With expanding fleet, improving capital structure, and a clear management roadmap, it remains a tactical pick among transport-driven mid-caps. Ideal for gradual accumulation by investors exploring scalable logistics and supply chain opportunities within India's growing infrastructure and consumption space.
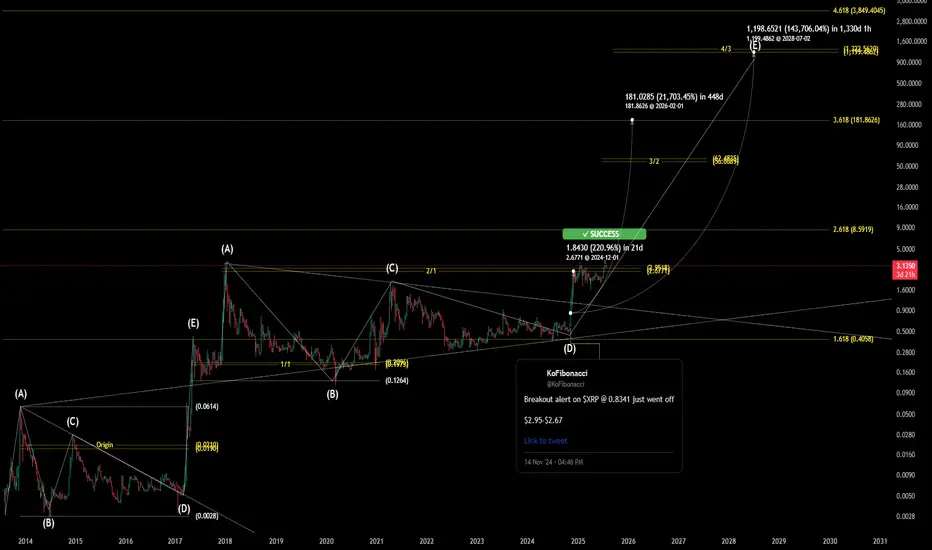
$XRP Historical Golden Ratio - Weekly Timeframe The Historical Golden Ratio (HGR) is the Fibonacci-based market analysis methodology that I created in 2020 (but really discovered). It identifies critical price inflection points by applying Fibonacci in a very unique and fundamental way. It may appear complex from the outside to new and even experienced technical analysis, but under the hood is a very simple and logically built engine that only has two critical parts really. However, it reveals an underlying structure within markets that appears to be fractal-based and dictated by the Golden Ratio. For the experienced market participant, time behind the wheel will reveal that the driving force behind markets has been in plain sight all along; M = φ * H(t) * e^(k * I(t))
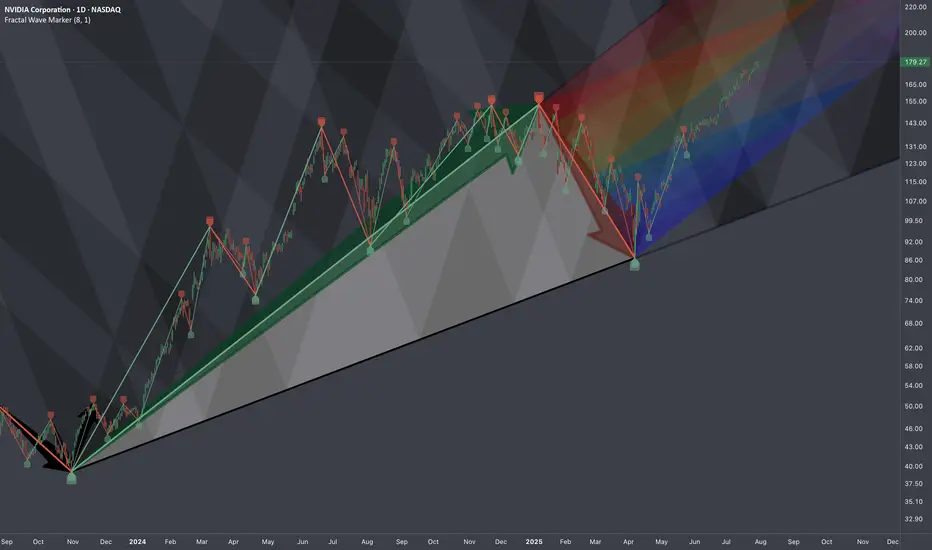
$NVDA: Cycle-Wired Levels🏛️ Research Notes
The fact that the angle of linear connection between 3rd degree points (fractal hierarchy) acted multiple amout of times as support and eventually resistance from which tariff drop happened establishing bottom and expanding from there.
That means if we were to justify the texture of ongoing wave from that bottom, we would geometrically quantify the area of that triangle to project considering historic data to remain objective approach (and NOT what levels we subjectively want to see whether we are bullish or bearish). There is mean reversion rule also going on which will be structurally addressed.
No matter where your actual target is at, there are always structural boundaries that price must break through first in order to get there. And because markets tend to move in proportion to their own scale — often aligning with exponents of the golden ratio, we treat phi as a constant within this probabilistic space.
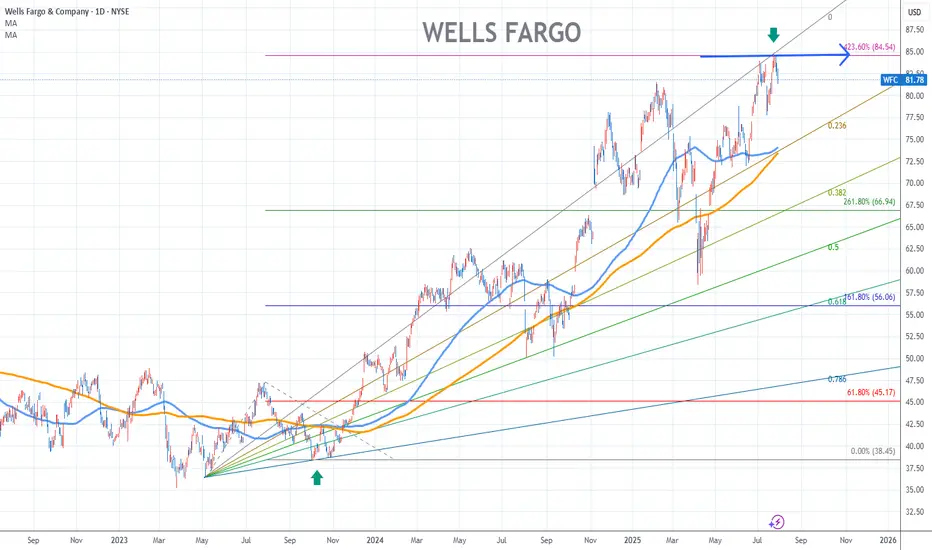
Wells Fargo Stock Chart Fibonacci Analysis 073025Hit the 84.5/423.60% resistance level.
Trading Idea
Chart time frame:D
A) 15 min(1W-3M)
B) 1 hr(3M-6M)
C) 4 hr(6M-1year)
D) 1 day(1-3years)
Stock progress:E
A) Keep rising over 61.80% resistance
B) 61.80% resistance
C) 61.80% support
D) Hit the bottom
E) Hit the top
Stocks rise as they rise from support and fall from resistance. Our goal is to find a low support point and enter. It can be referred to as buying at the pullback point. The pullback point can be found with a Fibonacci extension of 61.80%. This is a step to find entry level. 1) Find a triangle (Fibonacci Speed Fan Line) that connects the high (resistance) and low (support) points of the stock in progress, where it is continuously expressed as a Slingshot, 2) and create a Fibonacci extension level for the first rising wave from the start point of slingshot pattern.
When the current price goes over 61.80% level , that can be a good entry point, especially if the SMA 100 and 200 curves are gathered together at 61.80%, it is a very good entry point.
As a great help, tradingview provides these Fibonacci speed fan lines and extension levels with ease. So if you use the Fibonacci fan line, the extension level, and the SMA 100/200 curve well, you can find an entry point for the stock market. At least you have to enter at this low point to avoid trading failure, and if you are skilled at entering this low point, with fibonacci6180 technique, your reading skill to chart will be greatly improved.
If you want to do day trading, please set the time frame to 5 minutes or 15 minutes, and you will see many of the low point of rising stocks.
If want to prefer long term range trading, you can set the time frame to 1 hr or 1 day.
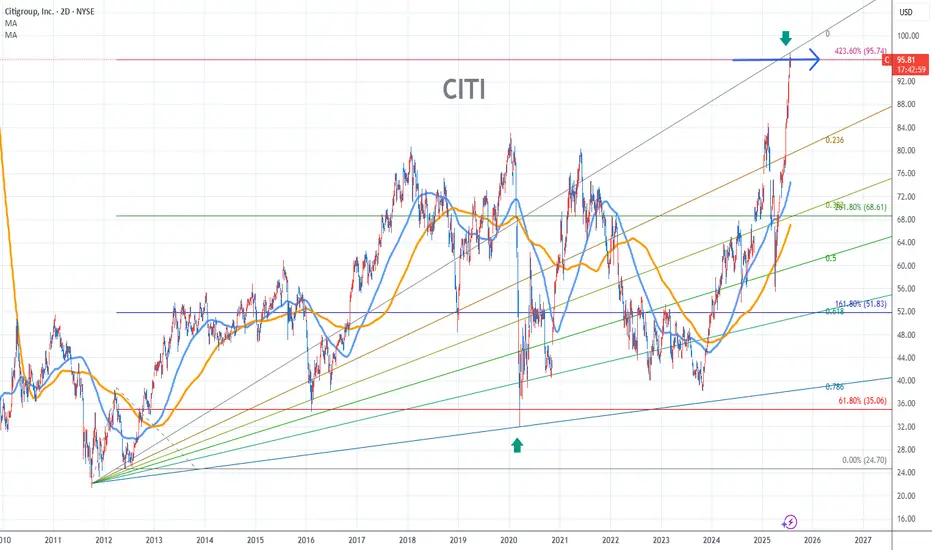
Citigroup Stock Chart Fibonacci Analysis 073025Hit the 96/423.60% resistance level.
Chart time frame:D
A) 15 min(1W-3M)
B) 1 hr(3M-6M)
C) 4 hr(6M-1year)
D) 1 day(1-3years)
Stock progress:E
A) Keep rising over 61.80% resistance
B) 61.80% resistance
C) 61.80% support
D) Hit the bottom
E) Hit the top
Stocks rise as they rise from support and fall from resistance. Our goal is to find a low support point and enter. It can be referred to as buying at the pullback point. The pullback point can be found with a Fibonacci extension of 61.80%. This is a step to find entry level. 1) Find a triangle (Fibonacci Speed Fan Line) that connects the high (resistance) and low (support) points of the stock in progress, where it is continuously expressed as a Slingshot, 2) and create a Fibonacci extension level for the first rising wave from the start point of slingshot pattern.
When the current price goes over 61.80% level , that can be a good entry point, especially if the SMA 100 and 200 curves are gathered together at 61.80%, it is a very good entry point.
As a great help, tradingview provides these Fibonacci speed fan lines and extension levels with ease. So if you use the Fibonacci fan line, the extension level, and the SMA 100/200 curve well, you can find an entry point for the stock market. At least you have to enter at this low point to avoid trading failure, and if you are skilled at entering this low point, with fibonacci6180 technique, your reading skill to chart will be greatly improved.
If you want to do day trading, please set the time frame to 5 minutes or 15 minutes, and you will see many of the low point of rising stocks.
If want to prefer long term range trading, you can set the time frame to 1 hr or 1 day.
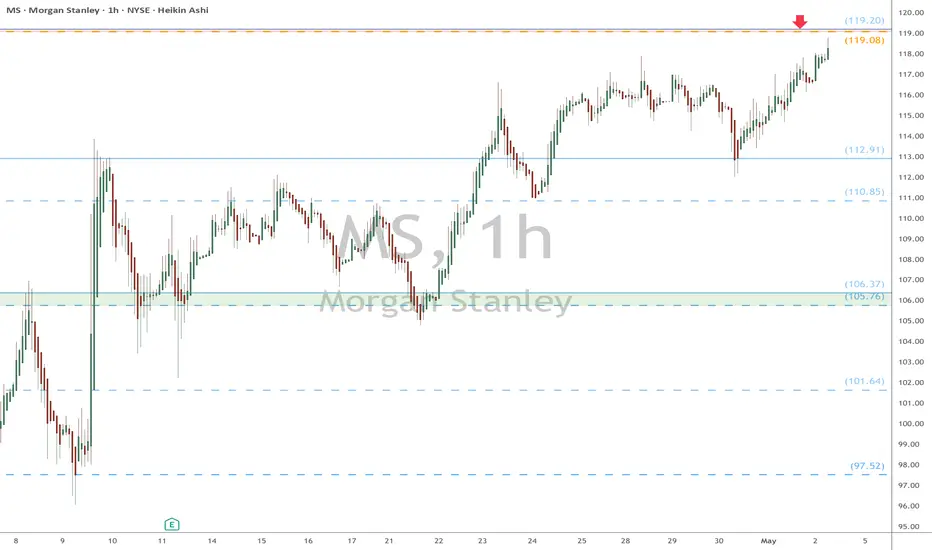
MS eyes on $119: Major Resistance may End Bounce or Strong BullMS recovering well from the tariff tantrum.
About to test a major resistance $119.08-119.20
Break would show strong bull, but dip more likely.
===========================================
.
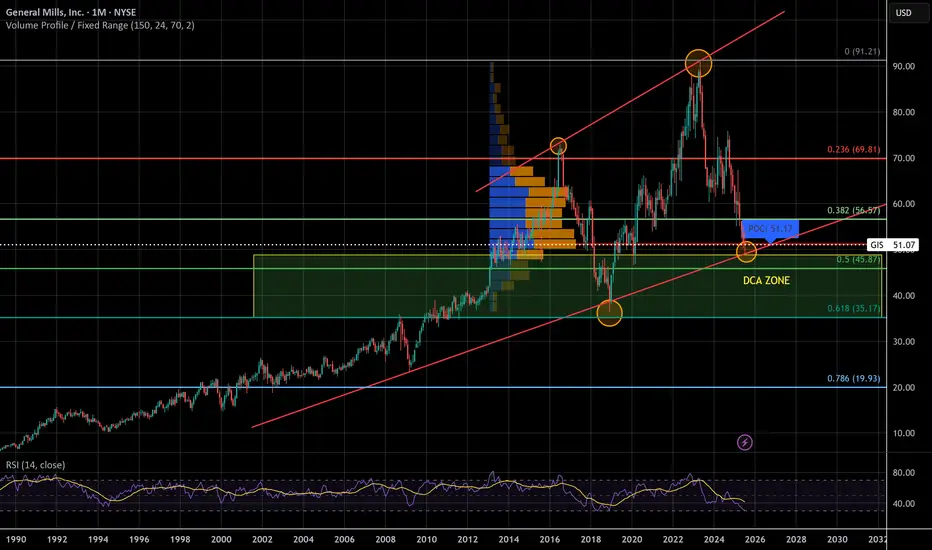
General Mills - Legendary Recession StockWe could be witnessing the biggest correction in General Mills history, again! For the 2nd time in 5 years! I trust in the golden fib, volume looks good, and RSI is low. If it makes it to the top of the channel it'll double in price in the coming years. This looks like a good candidate for Elliott Waves but I'm no good with them.
A lot of people think a recession is coming, if that is the case a lot of people will be buying general mills. More eating at home to save money = more groceries purchased. Looking at the previous financial recessions, General Mills lost 30-35% and recovered swiftly to even greater heights
Tariffs could also heavily affect general mills, which is why I DCA instead of 'aping fat bags'. Making money is hard, but holding onto it is even harder.
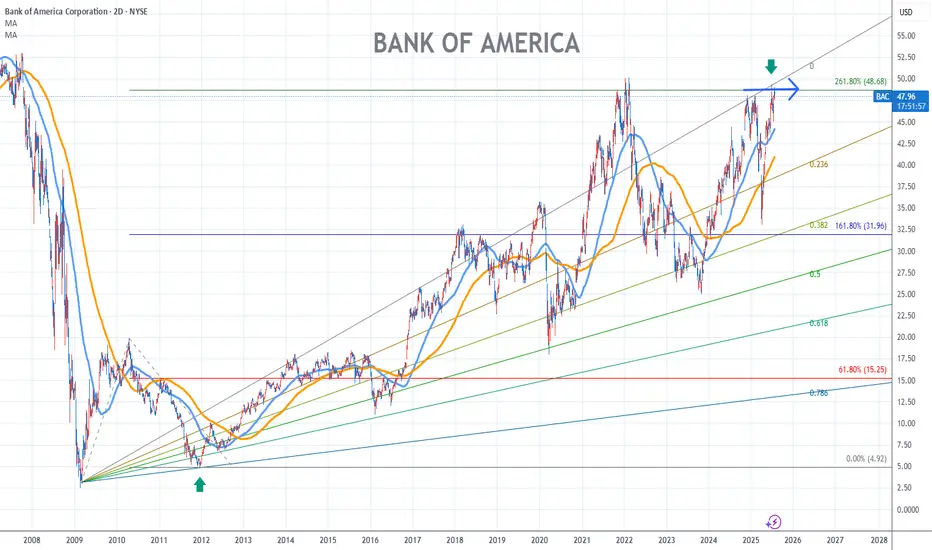
Bank of America Stock Chart Fibonacci Analysis 073025
Hit the 48.7/261.80% resistance level.
Trading Idea
Chart time frame:D
A) 15 min(1W-3M)
B) 1 hr(3M-6M)
C) 4 hr(6M-1year)
D) 1 day(1-3years)
Stock progress:E
A) Keep rising over 61.80% resistance
B) 61.80% resistance
C) 61.80% support
D) Hit the bottom
E) Hit the top
Stocks rise as they rise from support and fall from resistance. Our goal is to find a low support point and enter. It can be referred to as buying at the pullback point. The pullback point can be found with a Fibonacci extension of 61.80%. This is a step to find entry level. 1) Find a triangle (Fibonacci Speed Fan Line) that connects the high (resistance) and low (support) points of the stock in progress, where it is continuously expressed as a Slingshot, 2) and create a Fibonacci extension level for the first rising wave from the start point of slingshot pattern.
When the current price goes over 61.80% level , that can be a good entry point, especially if the SMA 100 and 200 curves are gathered together at 61.80%, it is a very good entry point.
As a great help, tradingview provides these Fibonacci speed fan lines and extension levels with ease. So if you use the Fibonacci fan line, the extension level, and the SMA 100/200 curve well, you can find an entry point for the stock market. At least you have to enter at this low point to avoid trading failure, and if you are skilled at entering this low point, with fibonacci6180 technique, your reading skill to chart will be greatly improved.
If you want to do day trading, please set the time frame to 5 minutes or 15 minutes, and you will see many of the low point of rising stocks.
If want to prefer long term range trading, you can set the time frame to 1 hr or 1 day.
STELLAR LUMENS - DOLLAR COST AVERAGE FOR LONG TERM GAINSSTELLAR LUMENS (XLM) has taken off late 2024 from under .10 cents and now trading at .40 cents for a 400% Gain in 6 months so far, and there is much more upside to come potentially. It hit all time highs around .50 cents and now the token seems to want to test those highs in the near term 2025, we can easily see XLM approach $1.00 towards 2026 for a 100% gain and even higher longer term. Overall, XLM moves with XRP and we all know XRP is a blue chip project, it has all the funds and institutional backing, and so does XLM.
Both projects share a common creator in Jed McCaleb, however they have different focuses. Ripple, and its native token XRP, was initially designed to facilitate cross-border payments for financial institutions. Stellar, on the other hand, focuses on financial inclusion and aims to provide accessible financial services for individuals, including remittances and access to banking services.
CAN WE SAY BULLISH?! TO THE MOON!!!

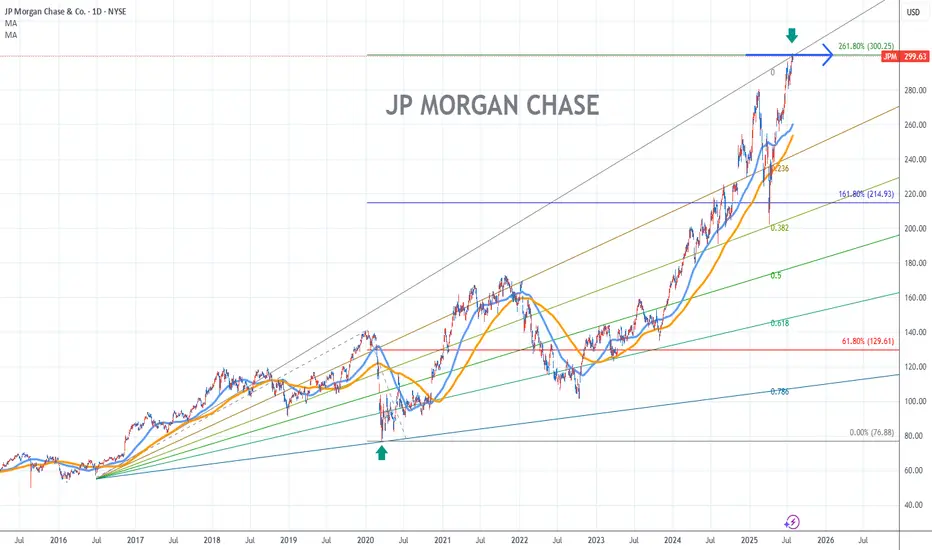
JP Morgan Chase Stock Chart Fibonacci Analysis 073025Trading Idea
Hit the 300/261.80% resistance level.
Chart time frame:D
A) 15 min(1W-3M)
B) 1 hr(3M-6M)
C) 4 hr(6M-1year)
D) 1 day(1-3years)
Stock progress:E
A) Keep rising over 61.80% resistance
B) 61.80% resistance
C) 61.80% support
D) Hit the bottom
E) Hit the top
Stocks rise as they rise from support and fall from resistance. Our goal is to find a low support point and enter. It can be referred to as buying at the pullback point. The pullback point can be found with a Fibonacci extension of 61.80%. This is a step to find entry level. 1) Find a triangle (Fibonacci Speed Fan Line) that connects the high (resistance) and low (support) points of the stock in progress, where it is continuously expressed as a Slingshot, 2) and create a Fibonacci extension level for the first rising wave from the start point of slingshot pattern.
When the current price goes over 61.80% level , that can be a good entry point, especially if the SMA 100 and 200 curves are gathered together at 61.80%, it is a very good entry point.
As a great help, tradingview provides these Fibonacci speed fan lines and extension levels with ease. So if you use the Fibonacci fan line, the extension level, and the SMA 100/200 curve well, you can find an entry point for the stock market. At least you have to enter at this low point to avoid trading failure, and if you are skilled at entering this low point, with fibonacci6180 technique, your reading skill to chart will be greatly improved.
If you want to do day trading, please set the time frame to 5 minutes or 15 minutes, and you will see many of the low point of rising stocks.
If want to prefer long term range trading, you can set the time frame to 1 hr or 1 day.
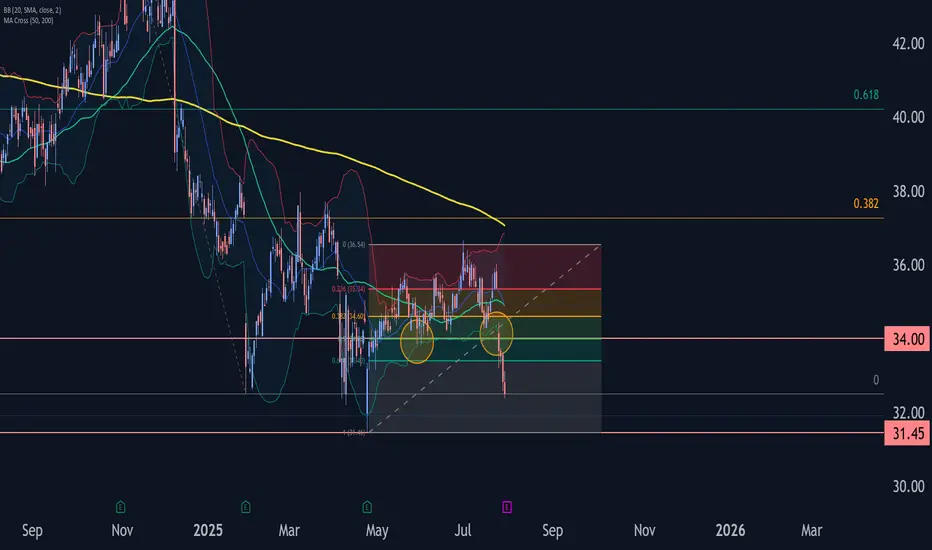
Comcast Wave Analysis – 30 July 2025- Comcast broke the support zone
- Likely fall to support level 31.45
Comcast recently broke the support zone located between the support level 34.00 (which has been reversing the price from the start of May) and the 50% Fibonacci correction of the upward wave A from April.
The breakout of this support zone accelerated the active impulse wave c, which belongs to wave B from June.
Given the clear daily downtrend, Comcast can be expected to fall further to the next support level 31.45 (former multi-month low from April).
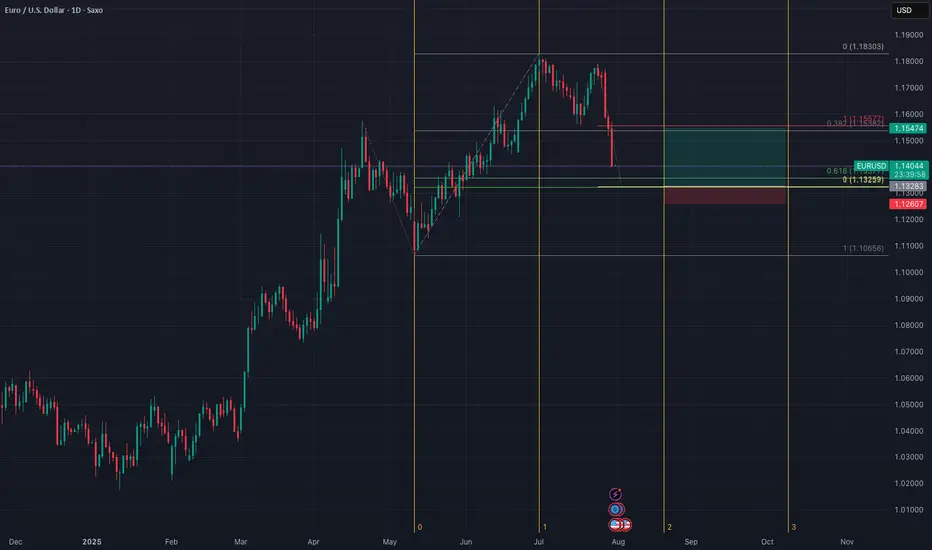
EURUSD - quickly getting to major supportIn my view EUR reversed and will continue downtrend for few weeks. However the price is quickly getting to significant support at 1.13500. The cluster is created by FR 0.618 and One to One with previous correction. I expect the price to make correction from the support and go up even to 1.15500
GBPUSD how low it will go?The first strong suport I can see at 1.31500 - 1.3100.
This cluster is created by three Fibo Retracement measurements.
I expect price to rebound form there and go up to 1.35400. I don's expect GBP to return to the uptrend - just make a correction and go down again.
Just my opinion.

BITCOIN → Correction within a downward channel. 112K or 125K?BINANCE:BTCUSDT is consolidating. However, a local downward trading range is forming relative to the current setup. What is the probability of a correction continuing to 112K or growth to 125K?
Daily structure: a local correctional channel within a global bullish trend. We have cascading resistance at 119.2, 119.6, 120, and 120.8. It will be quite difficult to break through this zone on the first attempt, but MM can use it to form traps and collect liquidity.
At the bottom, everything is simpler — a breakdown of the local bullish structure, the formation of an intermediate minimum, below which there is a void down to 112K.
Yesterday, relative to 115-116K, mm staged a massacre (trap) on both sides of the market.
Liquidity collection, return to the range, and growth. The reaction to the false breakdown of support is quite strong. Since the opening of the session, Bitcoin has been heading towards resistance, but there may not be enough potential to break through the upper resistance conglomerate, so I expect to see a pullback or decline to 116-115-114.
Resistance levels: 119.2, 120.1, 120.85
Support levels: 116.37, 115.67, 112
Technically and fundamentally, I do not see any drivers that could support the market (I am talking about Bitcoin, since the driver for altcoins is the decline in Bitcoin's dominance). It is possible that this may appear later. In the current situation, I am considering a false breakout and correction, as the market has not yet finished consolidating or correcting, and the current downward trading range may be extended.
PS: As the price moves towards resistance, it is necessary to monitor the reaction. The market itself will show what it is preparing for...
Best regards, R. Linda!

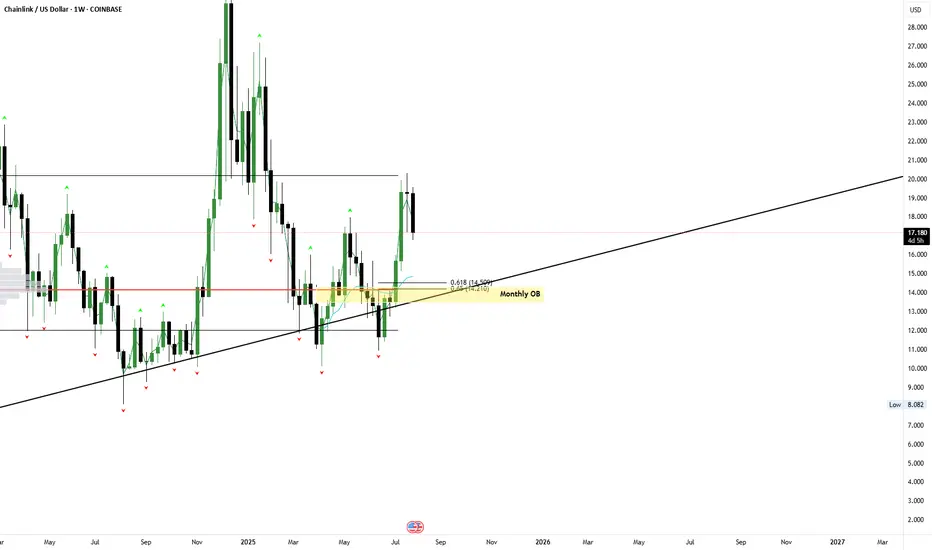
$LINK – VAH RejectionKeeping an eye on this one. Watching the rejection off VAH — I’d consider laddering in around the POC and VAL. We've also got confluence with an anchored VWAP, GP, and a monthly order block in play.
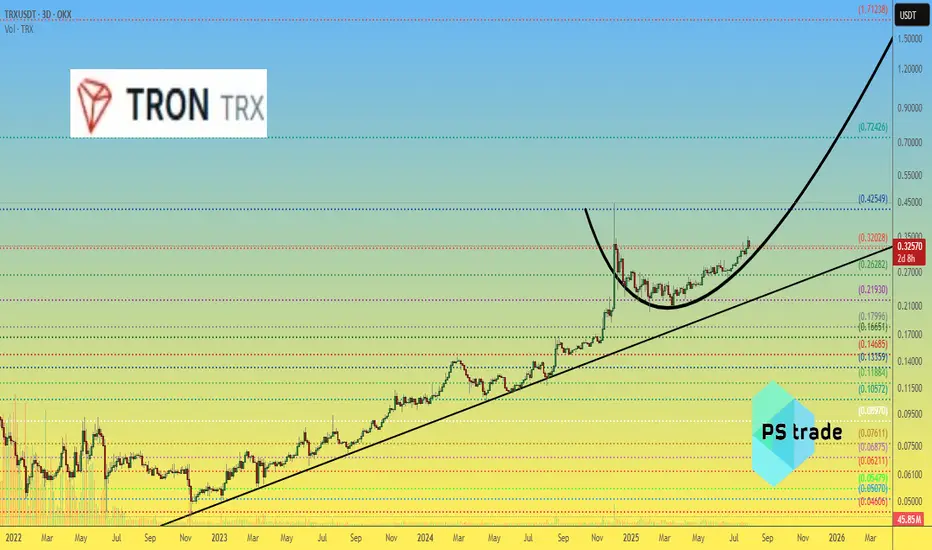
$TRX — "The Samurai Path" of Crypto? Long-term TRON outlook In a market where coins spike and crash from every tweet, CRYPTOCAP:TRX behaves like a stoic monk.
The price of OKX:TRXUSDT moves steadily, avoiding wild dumps and pumps — as if it exists in a parallel reality.
Now consider two events that would usually explode any altcoin’s chart — but not CRYPTOCAP:TRX :
📅 July 24 — Justin Sun’s TRON Inc gets listed on NASDAQ.
📅 July 28 — TRON Inc announces plans to raise $1B to buy back CRYPTOCAP:TRX and hold it on their balance sheet.
🔍 And yet… the chart remains calm. No hysteria. No euphoria.
Why?
Either CRYPTOCAP:TRX is so predictable that all news is already priced in —
or we simply don’t fully understand the inner mechanics of this ecosystem.
🧭 We call this "The Samurai Path":
Silent. Stable. Emotionless. But with serious long-term potential.
On the chart, we outlined how OKX:TRXUSDT has been moving — and what we expect next.
Because a market cap of $31B is already massive.
But $161B? That’s a statement...
📊 Can #TRON become the next “stable giant” of crypto — or will it surge when no one expects?
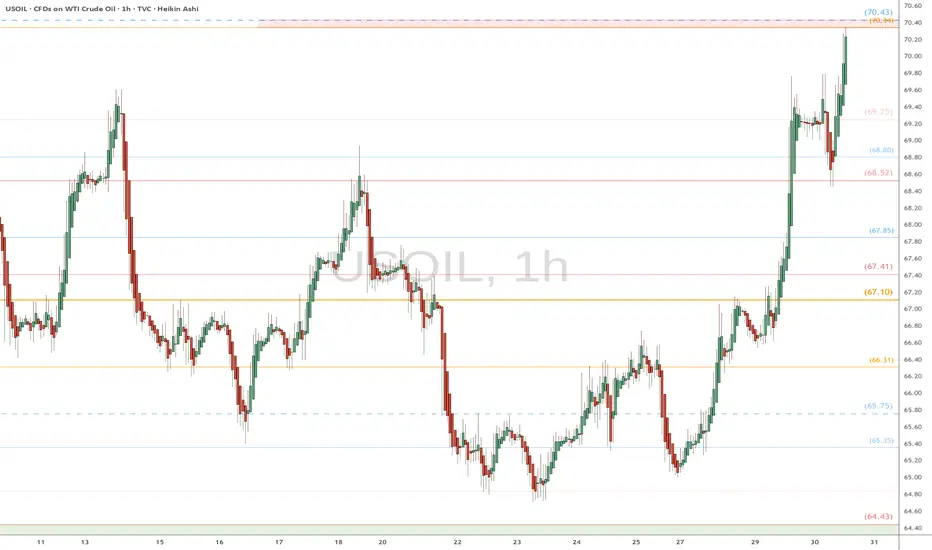
WTI watch $70.34-70.43: Resistance zone that may STOP the surgeUSOIL spiked on Trump/Russia/Iran tariff threats.
Just hit a significant resistance at $70.34-70.43
Look for a Dip-to-Fib or Break-n-Retest for longs.
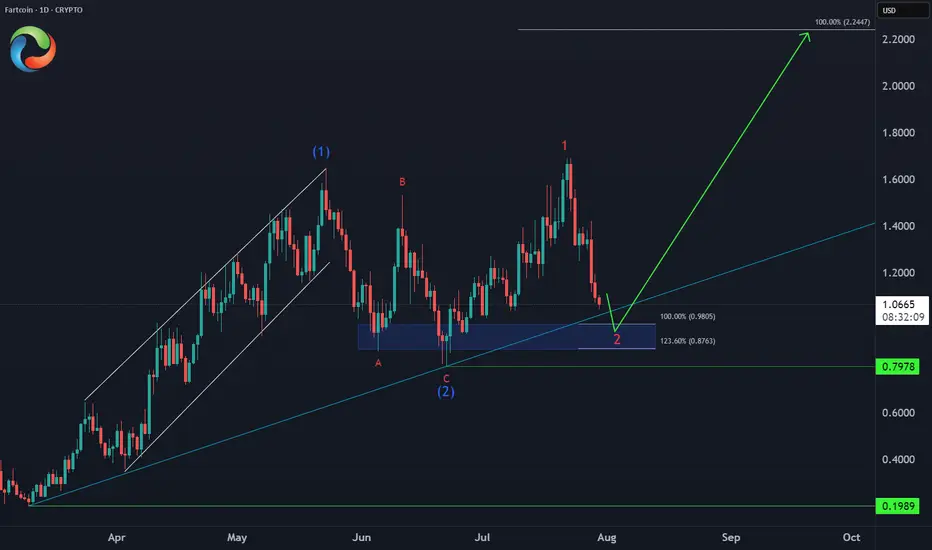
FARTCOIN Bullish Setup 📈 CRYPTO:FARTCOINUSD Entering an extreme buying area:
✅ Key support zone: $0.98-$0.87 (April trendline + equal legs)
⛔ Invalidation: $0.79
🎯 Target: $2.20 (124% upside)
This is how explosive meme setups look before liftoff.