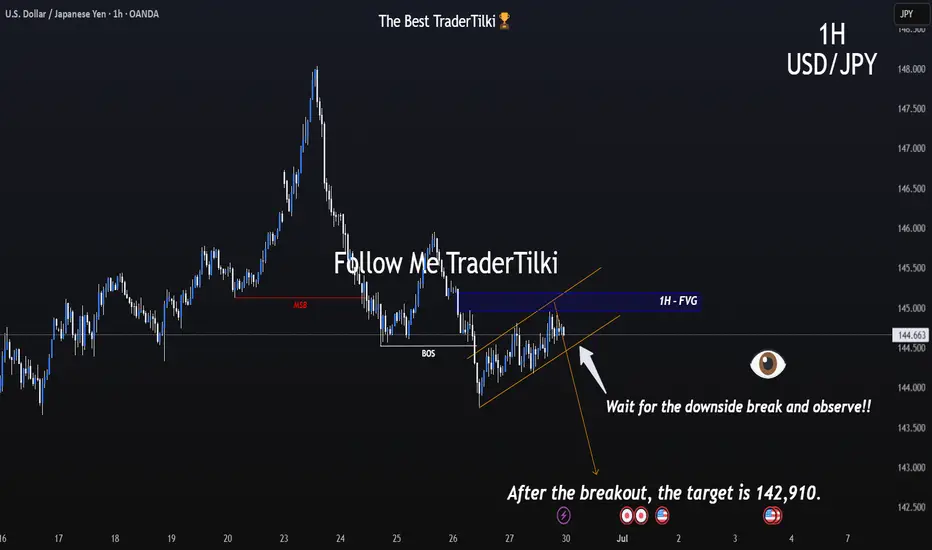
Critical Channel Watch Begins on the 1-Hour Chart of USDJPY.Hey everyone,
📉 My Latest USDJPY Analysis:
USDJPY is currently moving within a downtrend. If the price breaks below the lower boundary of the parallel channel, our first target level will be 142.910. The most crucial factor here is the downward breakout of that channel—don’t overlook it.
Also, keep a close eye on key economic data releases on the fundamental side, as they could significantly influence your strategy.
I meticulously prepare these analyses for you, and I sincerely appreciate your support through likes. Every like from you is my biggest motivation to continue sharing my analyses.
I’m truly grateful for each of you—love to all my followers💙💙💙
Fibonacci
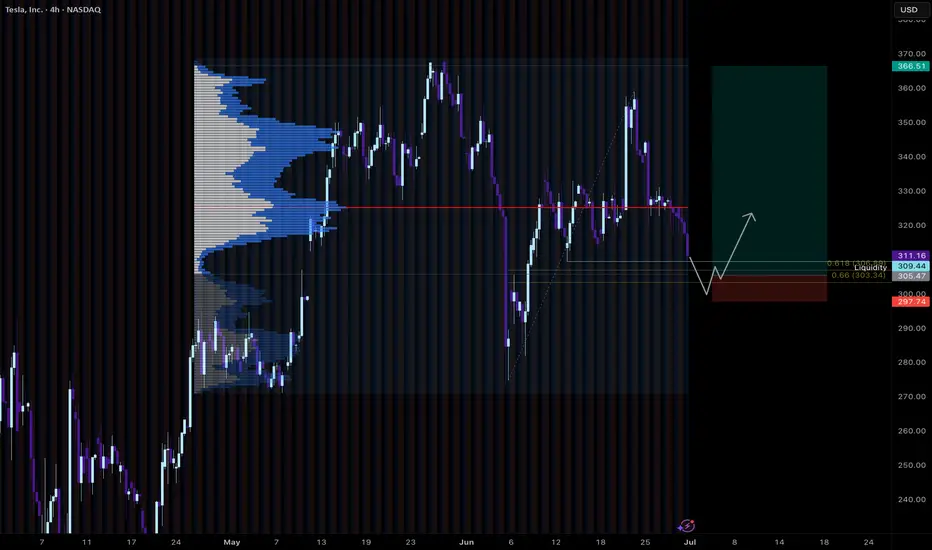
Tesla LongCurrently hanging around at the Golden pocket of the uptrend.
Would be interested in a long if we got a retrace to the whole move golden pocket, which sits on the current range VAL. Would also sweep liquidity from the recent lows.
Would need to see a good reaction to take the trade.
GOLD → Recovery and retest of resistance. DowntrendFX:XAUUSD has been recovering since the start of the session thanks to a weak dollar, but further growth is uncertain. However, the price is still below the key range and important levels.
At the beginning of the week, gold rebounded from monthly lows amid a weakening US dollar, which remains under pressure due to trade disputes with Japan, uncertainty surrounding the budget, and expectations of a Fed rate cut in September.
However, the technical picture for gold remains bearish, and further dynamics will depend on new statements from Fed officials, labor market data, and Jerome Powell's speech on Tuesday.
Technically, after breaking through the global range support, the price is forming a correction and testing 3294. Before a possible rise to 3320 or to the 0.7 Fibonacci zone, a correction to 3271 may form, which will determine the further development of the situation.
Support levels: 3271, 3255, 3245
Resistance levels: 3294, 3320, 3347
A retest of 3295 (0.5) Fibonacci is forming. There is a possibility of a false breakout with a possible correction. If, during the correction, buyers keep the price above 3271 and return to retest 3294, we will have a chance to attempt growth to 3320 - 3347
Best regards, R. Linda!

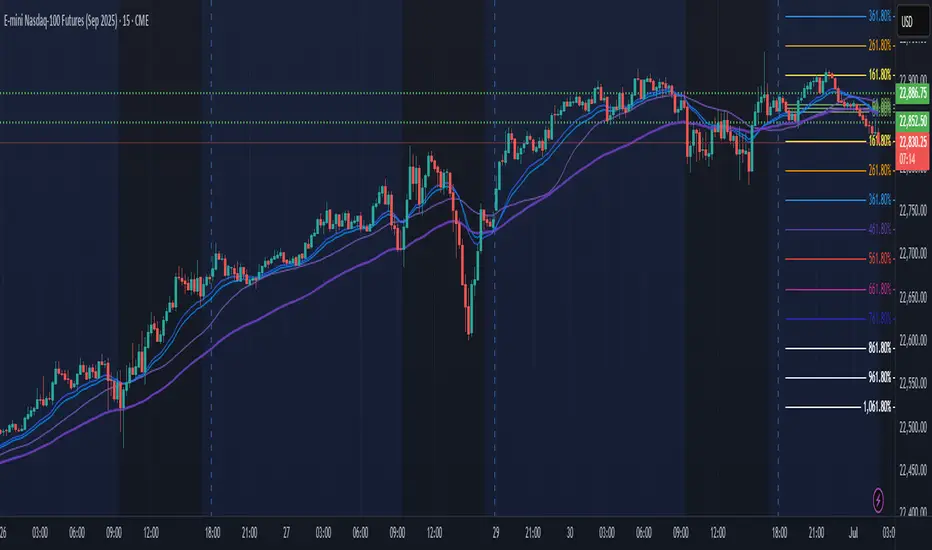
NQ Power Range Report with FIB Ext - 7/1/2025 SessionCME_MINI:NQU2025
- PR High: 22886.75
- PR Low: 22852.50
- NZ Spread: 76.75
Key scheduled economic events:
09:30 | Fed Chair Powell Speaks
09:45 | S&P Global Manufacturing PMI
10:00 | ISM Manufacturing PMI
- ISM Manufacturing Services
- JOLTs Job Openings
Holding in ATH range
Session Open Stats (As of 12:45 AM 7/1)
- Session Open ATR: 329.32
- Volume: 21K
- Open Int: 269K
- Trend Grade: Neutral
- From BA ATH: -0.1% (Rounded)
Key Levels (Rounded - Think of these as ranges)
- Long: 23239
- Mid: 21525
- Short: 20383
Keep in mind this is not speculation or a prediction. Only a report of the Power Range with Fib extensions for target hunting. Do your DD! You determine your risk tolerance. You are fully capable of making your own decisions.
BA: Back Adjusted
BuZ/BeZ: Bull Zone / Bear Zone
NZ: Neutral Zone
Gold Swing Trend broke to the downside and is now touching previous support zone and will continue to take a dump just wait for the engulfing candle on the 1hour use proper r&r!
PLTR: Encoded Wave Replication IAs bullish wave gets mature on the way up, it draws distinctive tops in a way that warns of bullish exhaustion ahead because to some extent topologically highs indicate a registered rejection of moving further in a local scope (some period).
Scalable Recursive Patterns
If we pay attention to building blocks on smaller scale
Those patterns replicate in bigger scale for example
If the pattern really carries the identified encoding, I'd pay attention to how price retraces within fibonacci channel which is adjusted to the direction of fractal cycle in a clean version.

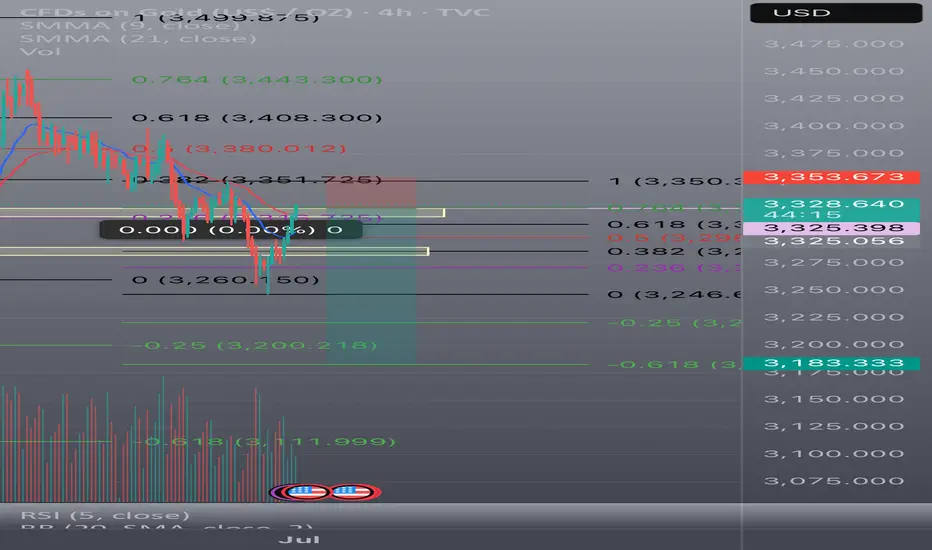
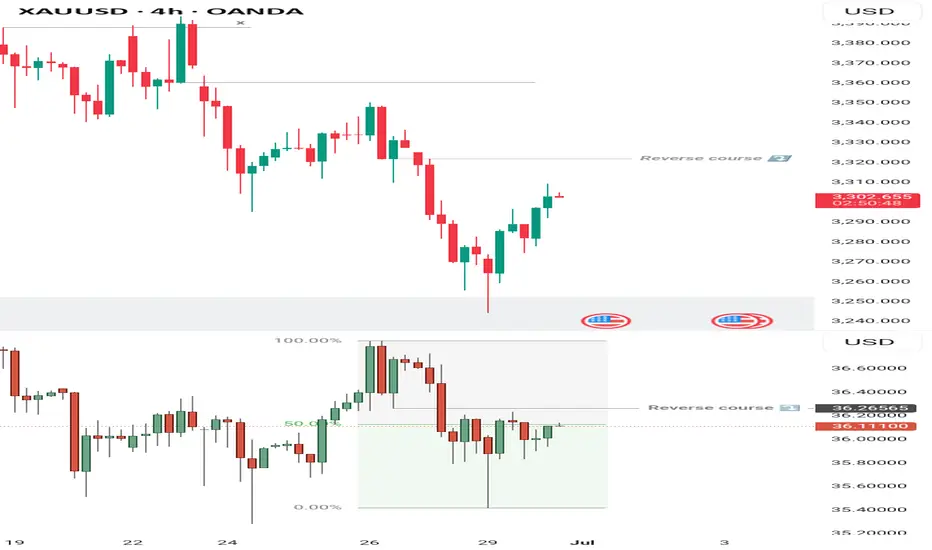
Gold (XAUUSD) 4H Technical Outlook
In line with my previous projection, price dropped from the 3330 region toward the key level around 3224, bottoming out at 3245 after sweeping liquidity—forming what now appears to be a potential double bottom.
However, the rally from 3245 looks more like a liquidity build-up than a true reversal. This suspicion is strengthened by Silver’s behavior, as it failed to confirm any bullish structure shift last week and isn’t participating in the rally as expected.
Currently, Silver is trading back into a premium zone around 36.27. With that in view, it would be ideal for Gold to revisit the 3322 region, offering a cleaner and more logical sell opportunity with defined risk. That said, overnight volatility during the Asian session could still lead to unexpected movements and early reversals.
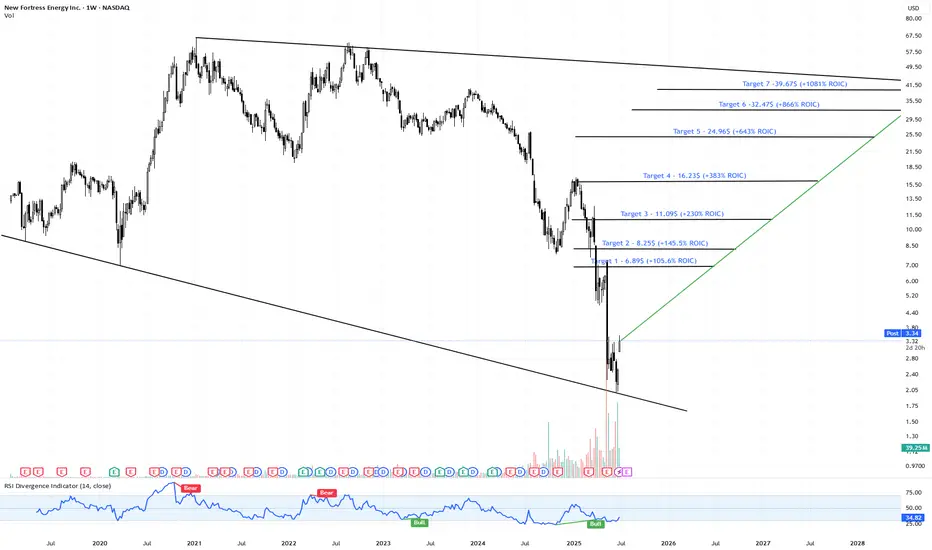
NFE | Long-Term Falling Wedge Reversal – 10X Over 39 months📍 Ticker: NASDAQ:NFE (New Fortress Energy Inc.)
📆 Timeframe: 1W (Weekly)
📉 Price: $3.34
📊 Volume: 829K
📈 Time Horizon: 39 months (~Q4 2028)
🔍 Technical Setup:
NASDAQ:NFE has formed a classic falling wedge over multiple quarters and is now attempting a long-term reversal from a compressed base. The structure suggests explosive upside potential if recovery unfolds as mapped.
🔻 Massive wedge complete
🟢 Accumulation phase after capitulation
📐 Breakout path projects full reversion to long-term resistance line
🧠 Targets & Return on Invested Capital (ROIC):
📥 Entry Zone: $3.00–$3.50
⛔ Stop-Loss: Weekly close below $1.65 (wedge structure failure)
🎯 Target 1: $6.89
→ ROIC: +105.6%
🎯 Target 2: $8.26
→ ROIC: +145.5%
🎯 Target 3: $11.10
→ ROIC: +230%
🎯 Target 4: $16.24
→ ROIC: +383%
🎯 Target 5: $24.97
→ ROIC: +643%
🎯 Target 6: $32.48
→ ROIC: +866%
🎯 Target 7: $39.68
→ ROIC: +1081%
⚠️ Key Insights:
Technical compression resolved upward = breakout watch
Price > $4.00 could initiate strong upside wave
Attractive for long-duration swing traders and structured LEAP positions
Rare asymmetric opportunity within energy sector
💬 Will NFE reclaim its prior cycle highs over the next 3 years?
Follow us and track the setup as it unfolds.
#NFE #TechnicalSetup #WedgeBreakout #LongTermTrade #EnergyStocks #TargetTraders #10xOpportunity
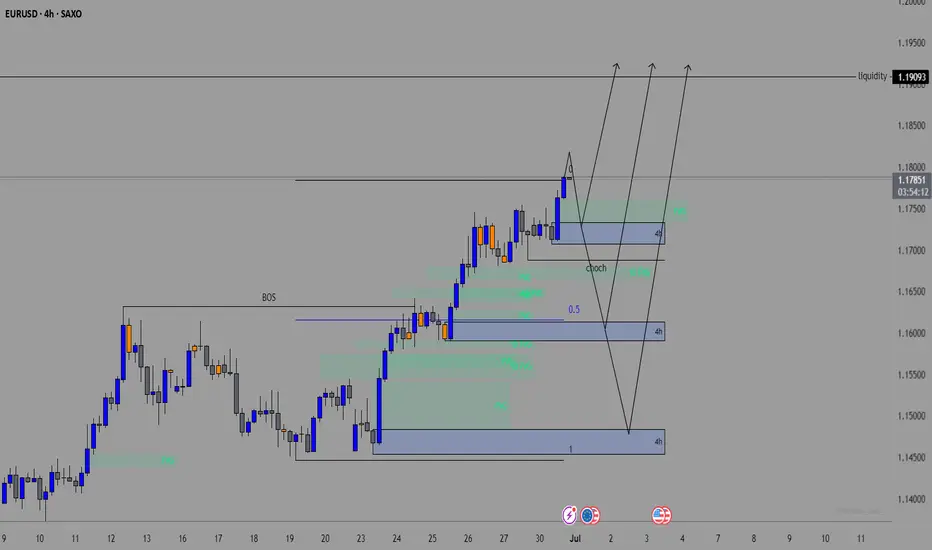
EURUSD OUTLOOK 1 - 4 JulyStill Bullish on EU. No Fundamental or technical reasons to be short.
We could have a short term pullback within the daily range to then continue long..
If we get that 4H pullback I will only long after getting a 4H technical confirmation.
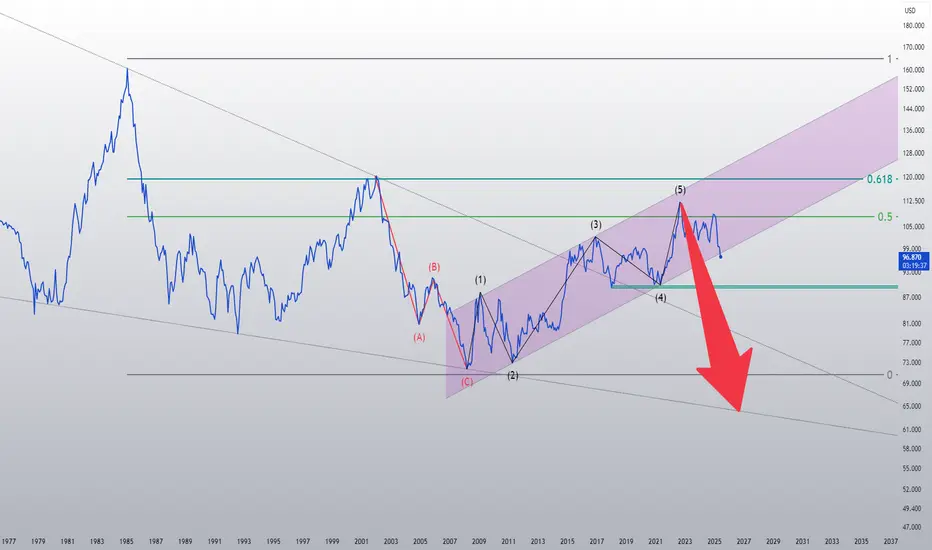
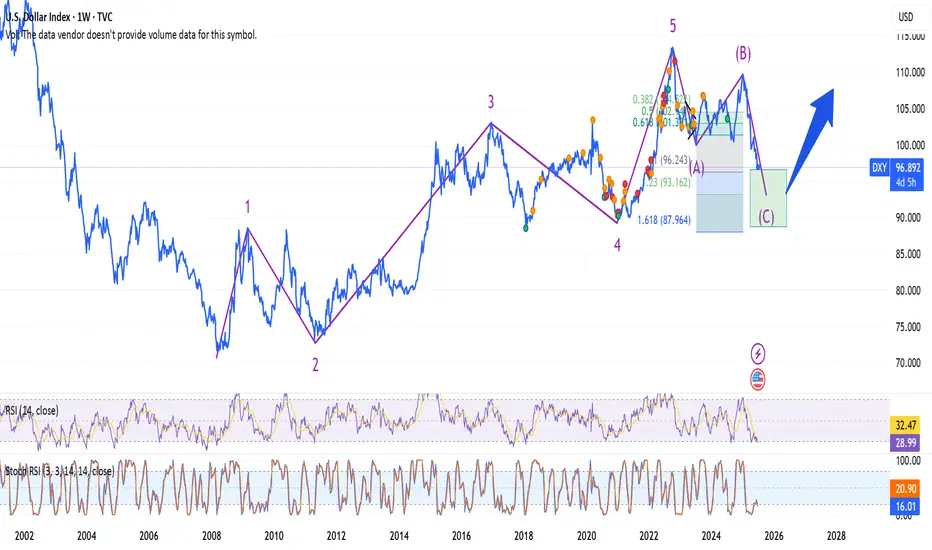
The DXY looks doomedI drew this chart in September 2022. Now, almost three years later, the DXY has broken below its channel.
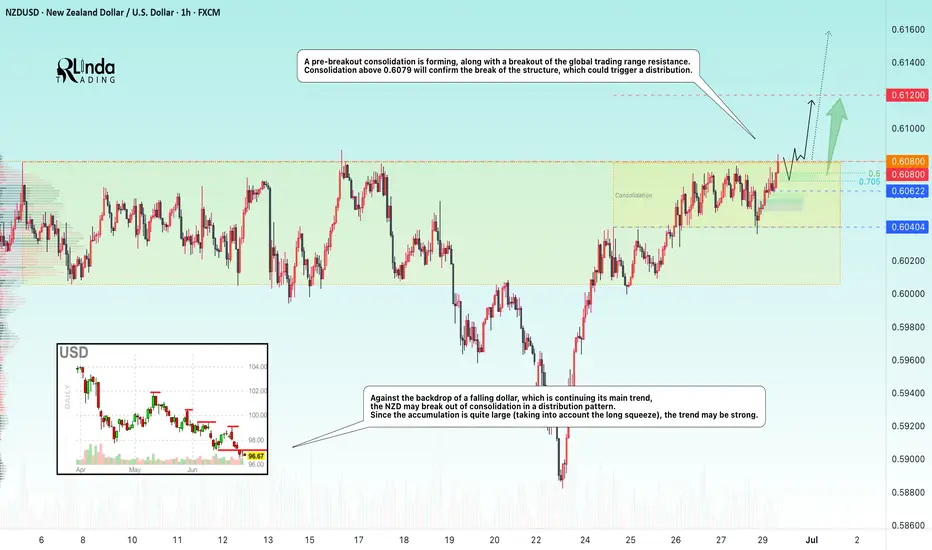
NZDUSD → Pre-breakout consolidation. One step away from a rallyFX:NZDUSD is consolidating, but the chart shows signs of readiness to shift to a distribution phase, which could lead to a rally.
Against the backdrop of a falling dollar, which is continuing its main trend, the NZD may break out of consolidation in a distribution pattern. Since the accumulation is quite large (taking into account the long squeeze), the trend may be strong.
A pre-breakout consolidation is forming relative to 0.6080, followed by the price breaking through the resistance of the global trading range. Consolidation above 0.6080 will confirm the breakdown of the structure, which could trigger distribution
Resistance levels: 0.6080, 0.612
Support levels: 0.6062, 0.604
The price may be supported by a bullish trend and a decline in the dollar. A breakout from the 4-month consolidation may be accompanied by a continuation of the uptrend until the intermediate high of 0.6355 is reached in the medium term.
Best regards, R. Linda!
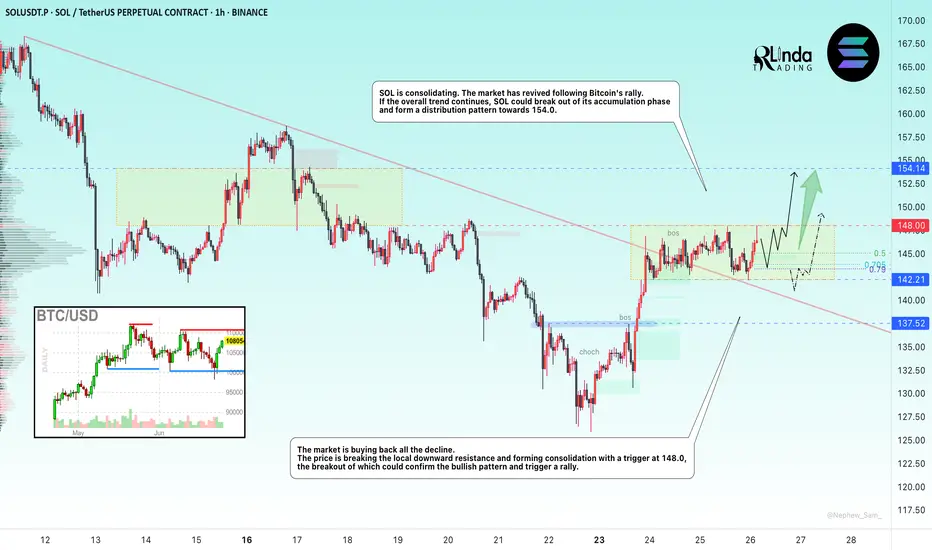
SOLANA → BINANCE:SOLUSDT.P is consolidating after breaking through trend resistance. The market trigger is 148.0, and Bitcoin is provoking the market to recover...
The market is buying back all the losses. SOL breaks the local downward resistance and forms consolidation with a trigger of 148.0. The market has come to life following the rallying Bitcoin. If the general trend continues, SOL may break out of the accumulation zone and form a distribution towards 154.0
The latest retest of resistance is provoking a correction. Before rising, the price may test the zone of interest at 144 or the lower boundary of consolidation at 142.2. The ideal scenario would be a false breakdown of support at 142.2 before rising.
Resistance levels: 148.0, 154.2
Support levels: 142.2, 137.5
Fundamentally, the situation for the crypto market is improving. Technically, the market is also showing positive dynamics. SOL is consolidating after growth, which is generally a positive sign. Now we need to wait for the price to break out of consolidation and continue its growth. One of the signs of this is a rebound from the 0.5 range and a quick retest of resistance with a gradual squeeze towards the trigger.
Best regards, R. Linda!
DXY USD Dollar Bearish Short term, then bullishI am not a financial advisor. This is not meant to be and does not constitute financial, investment, trading, or any other types of advice or recommendation.
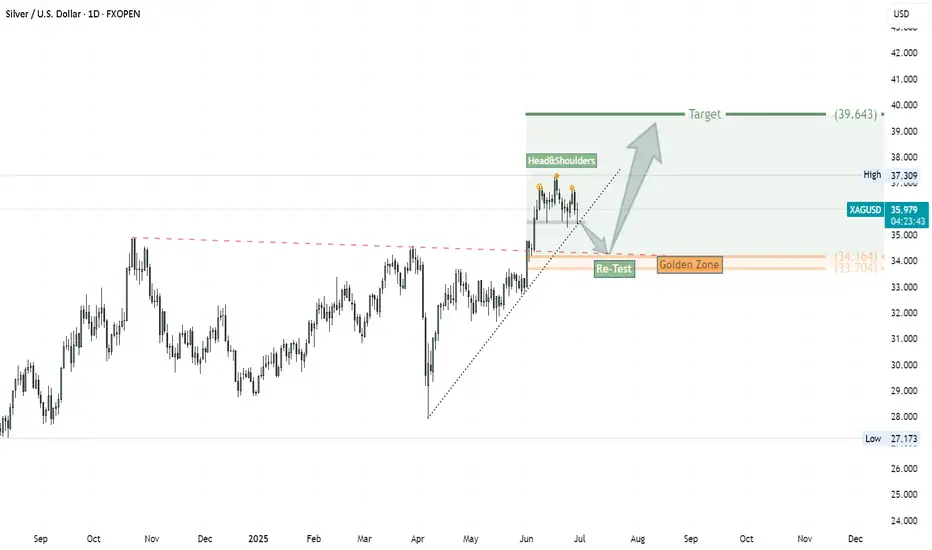
Possible Movement of Silver: Watch the Golden Zone RetestSilver has broken above a two-top downtrend with a strong bullish impulse, marked by a long white candle. Currently, it appears to be forming a Head and Shoulders pattern. A break below the neckline and the supporting uptrend could lead price back to the golden zone—around the base of the breakout candle—before resuming its upward move toward the main target near $39.
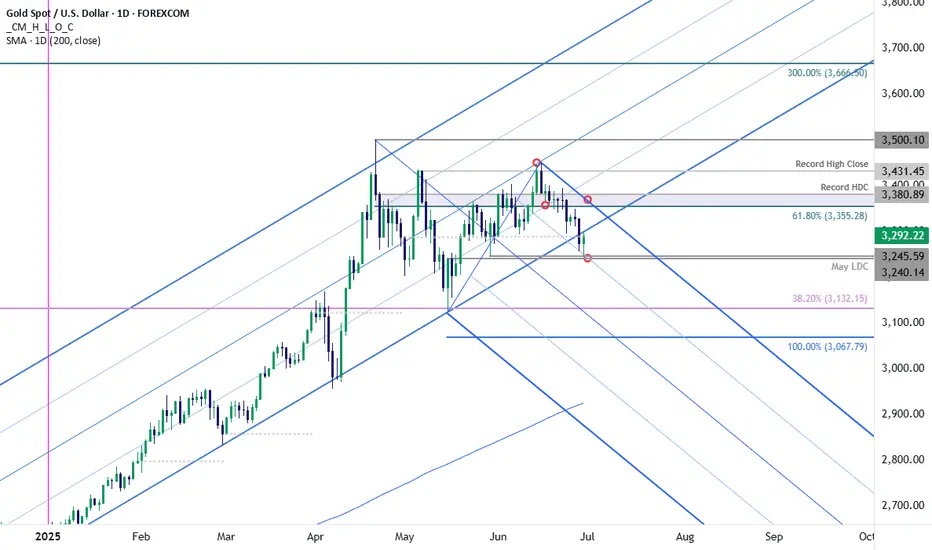
Gold Threatens Yearly Support- Bulls on NoticeGold is threatening a break of the yearly uptrend with Friday’s decline clearing the monthly range low. The focus into the start of the month is on technical support at the 5/29 swing low / May low-day close (LDC) 3240/45.
A break / close below this threshold would be needed to suggest a more significant correction is underway towards the 38.2% retracement of the November rally at 3132 and the 100% extension of the April decline at 3072- both areas of interest for possible downside exhaustion / price inflection IF reached. Resistance now at 3355/80 with a breach above the Record high-close at 3431 needed to mark resumption of the broader uptrend.
-MB
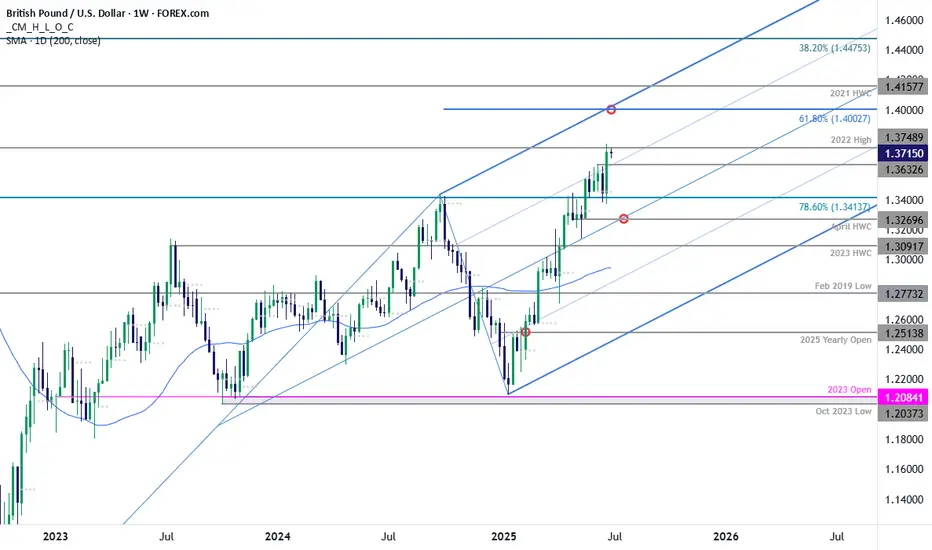
GBP/USD Testing Resistance at 2022 HighsSterling marked an outside weekly-reversal through slope resistance last week with the rally trading just below resistance into the close of the month at the 2022 swing high at 1.3749. Look for support at the June high at 1.3633 IF price is heading higher on this stretch with a breach / close higher exposing the 61.8% extension of the 2022 advance at 1.4003. Weekly support rests with the 78.6% retracement at 1.3414 with media-term bullish invalidation now raised to the April high-week close (HWC) at 1.3270.
-MB
BTCUSDT Trade SetupBTC Still in sideways no major move, wait for the entries. While on weekly tf still expecting a final shakeout, 95-93k then a final leg up towards to 120k. For now wait for the entries to be filled first then must use sl.

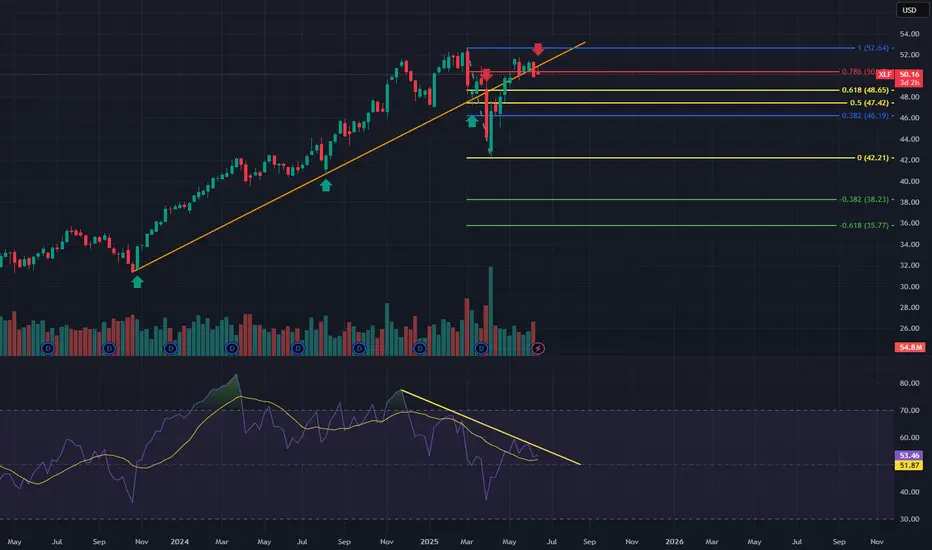
The Big Banks are in BIG TROUBLEAs you can see on this weekly chart, the XLF has been in this steady up trend since October 2023. It bounced off this upward slopping trendline 3 different times and then finally broke through it on the 4th hit, then came back up to test the underside of the trendline as resistance. It did get back above the trendline briefly last month, but it ended up being a bull trap as it fell back below the trendline and is now testing it as resistance once again and is currently being rejected. A Fibonacci retrace shows the 0.786 fib level also lines up with this area giving added confluence, as well as RSI divergence that I have highlighted. Massive Massive resistance in this area and so much room for potential downside. I see this trade as an extremely high probability of playing out. The options market agrees with me as well.
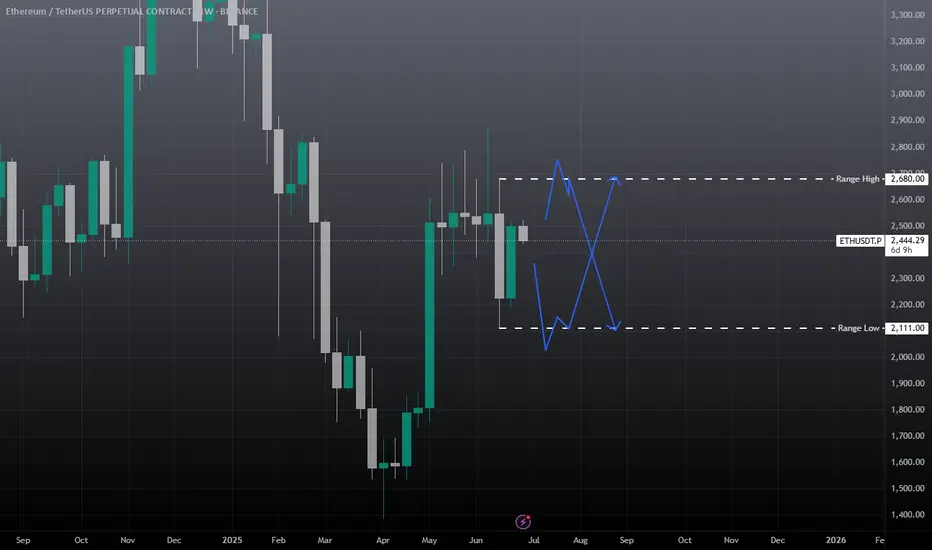
ethusdt no trade zoneETH is stuck in a range, wait for the sweep of range high, then closing below the range high and take the short, target weekly low. 2nd scenario is wait for to take out the weekly low and any daily candle closing failed to close below this level take the long entry and target the range high. Otherwise expecting this week choppy mean sideways. no major move. Will update if found any good trade.
Monday hitter NQ1!Hey took a little break but I’m back with the end of the month Monday Mark up. Playing a little safe and marking in up both a buy a sell. As of now there is a head and shoulder developing and I’m looking for it to be a sell. SL is at $250 and I’ve set 4 TP. Good luck and always remember to follow your trading plan and take proper risk management.

OTHERS data points to biggest ALT-Season Good Day Investors and traders,
This the OTHERS on the weekly and I have taken some measured moves in what could be expected in time and price.
The OTHERS chart in my opinion is the last form of the higher risk curve which generally happens at the very end of cycles The others does not include the top ten crypto, so it a very good form of risk on.
I have been looking at the OTHERS chart fairly often of recent times because this is the time for it to really outshine Bitcoin and lead the market with fairly explosive gains.
I have marked a couple of possible time lines that could occur and both seem to be lining up in sort of way or another. From what I can see, others has one big wave remaining, and it’s the one you don’t want to miss
The Indicators
Fibonacci retracement
I have placed a potential take profit zone from the 1.272 to the 1.618 levels and anywhere in between. I have added an up trending channel that OTHERS would have to hold to stay somewhat relevant or then could be susceptible to adjustment.
2.RSI
I have measured the first breakout of the RSI from the 2015-17 and 2019-21 bull runs along with this one so far. The one more relevant to us is 2015-17 as this is the cycle we are more closely following. There seems to be a recurring trend of 90 plus bars before a top to OTHERS. One more thing that really stands out to me in the RSI this the first time it has shown a very strong bearish divergence. normally it seems to maintain or gain strength. right to the very end. time will reveal the real issue here.
3. ISO
The average sentiment oscillator to also show very consistent data for us. I have two measurements. The one points to late July and the the other late October. To me this could be the potential ALT-season time frame from July as it fizzles in the October time frame.
My suggestion to you is follow what you have been taught so far, do not get greedy, take profits when they are there and trust your game plan and stick to it. ALT- SEASON can you a lot of money, or lose you a lot of money. By design, its there to take any profits you have may have, or catch any late coming stragglers. Don’t get caught up in the hoopla.
Once again, I ask you for you input, I really want to hear from you.
Check my bio for more links and information
Kind regards,
WeAreSat0shi

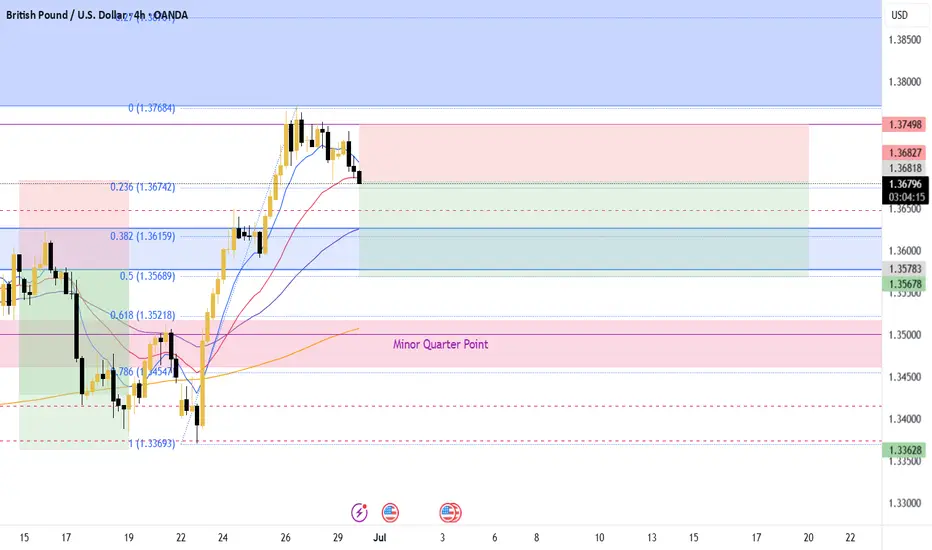
GBPUSD PullbackGBPUSD is in an overall bullish market
However, after a large bullish push, I am expecting price to pullback (sell off).
Price met resistance a weekly supply zone and closed as an indecision candle on the Daily.
The lower blue EMA crossed below the higher RED EMA on the 1hr chart.
Expecting price to selloff and find support at the 50.0 Fib level which also correlates with a demand zone, before continuing the overall trend.
Preponderance of (or Preposterous?) Evidence
I was just proposing yesterday staying neutral in SPY (the S&P 500 ETF). The FOMC meeting today (Jun 18th) was a big-nothing burger (so far), which supports my (non)position, but we'll see. I will update that post when the time is right (ATH, 200dma, or bust).
Today, though, the IWM (the Russell 2000 Small Cap Index ETF) and, surprisingly, a potential short position.
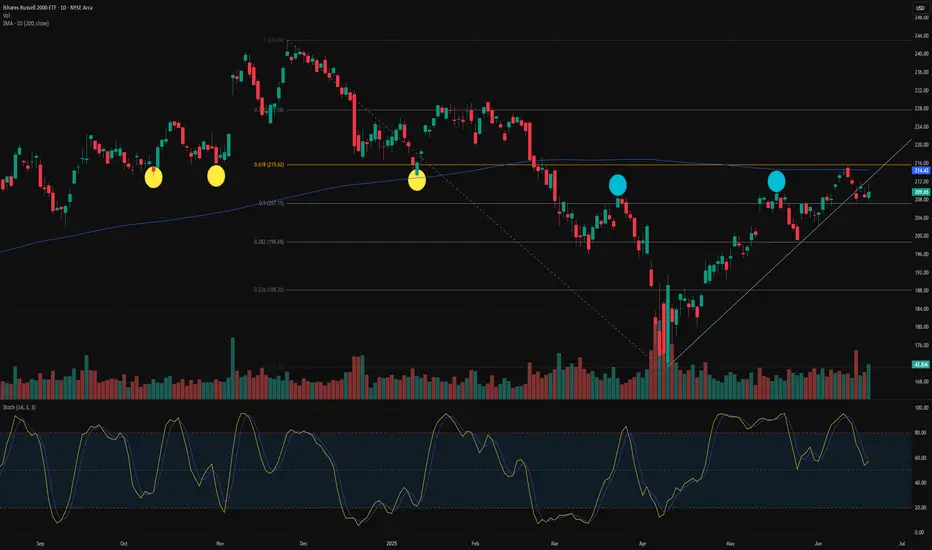
First, the IWM (see below) is overbought on a weekly chart, with the Stochastics being above 80 (more on Stochastics and weekly charts at a later date). For now, let's go with IWM being a little overbought, in the longer-term view.
Now, let's switch to the big daily chart at the top and look at the evidence for going short;
- IWM never really got above it's 200-day moving average (purple line),
- That same level was consistent with a lot of resistance ~213 (yellow circles),
- IWM has trailed this whole rally.
- It has broken and somewhat retested a trendline (light blue) from this most recent rally,
- It bounced off it's 61.8% Fibonacci level (orange line, not my favorite indicator for ETFs, but I often sneak a peek),
- It's at its previous resistance high around 209 (blue circles).
On the not-bearish side;
- The daily chart is less overbought (this has to happen on weakness, though),
- There's (a little) support at 199 but not really again until 172,
- I still feel like the All-Time-High (ATH) is a magnet for the S&P (but IWM has trailed).
That's (a lot) more (and better) points for being bearish.
I'll go short (via a ~90 day ITM put position*) if IWM breaks below 207.50, between that and 202. If it opens lower than 202, I'll wait for a pull-up.
The stop will be a close above the 200 day.
The target is 172 (the previous tariff low), but I will lighten/tighten up (by selling OTM puts* and/or moving stop down) as IWM drops (if it drops).
It may seem a bit duplicitous to be neutral on SPY while being bearish on IWM.
But sometimes you have to go with the Preponderance of Evidence (or will it prove Preposterous Evidence?)
An update will be coming.
*Sorry for bringing up options. One can just go short IWM. I will explain my option choice one day.
My ideas here on TradingView are for educational purposes only. It is NOT trading advice. I often lose money and you would be a fool to follow me blindly.