Preponderance of (or Preposterous?) Evidence
I was just proposing yesterday staying neutral in SPY (the S&P 500 ETF). The FOMC meeting today (Jun 18th) was a big-nothing burger (so far), which supports my (non)position, but we'll see. I will update that post when the time is right (ATH, 200dma, or bust).
Today, though, the IWM (the Russell 2000 Small Cap Index ETF) and, surprisingly, a potential short position.
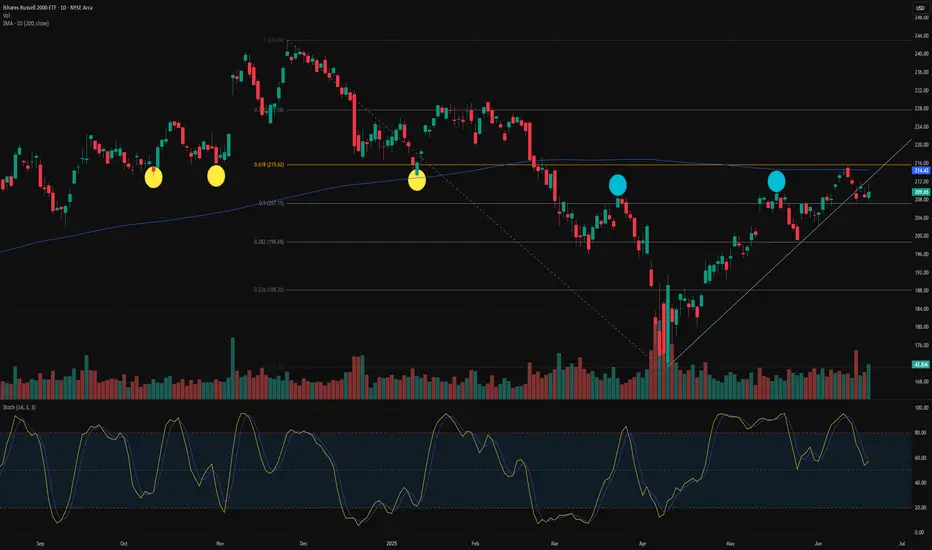
First, the IWM (see below) is overbought on a weekly chart, with the Stochastics being above 80 (more on Stochastics and weekly charts at a later date). For now, let's go with IWM being a little overbought, in the longer-term view.
Now, let's switch to the big daily chart at the top and look at the evidence for going short;
- IWM never really got above it's 200-day moving average (purple line),
- That same level was consistent with a lot of resistance ~213 (yellow circles),
- IWM has trailed this whole rally.
- It has broken and somewhat retested a trendline (light blue) from this most recent rally,
- It bounced off it's 61.8% Fibonacci level (orange line, not my favorite indicator for ETFs, but I often sneak a peek),
- It's at its previous resistance high around 209 (blue circles).
On the not-bearish side;
- The daily chart is less overbought (this has to happen on weakness, though),
- There's (a little) support at 199 but not really again until 172,
- I still feel like the All-Time-High (ATH) is a magnet for the S&P (but IWM has trailed).
That's (a lot) more (and better) points for being bearish.
I'll go short (via a ~90 day ITM put position*) if IWM breaks below 207.50, between that and 202. If it opens lower than 202, I'll wait for a pull-up.
The stop will be a close above the 200 day.
The target is 172 (the previous tariff low), but I will lighten/tighten up (by selling OTM puts* and/or moving stop down) as IWM drops (if it drops).
It may seem a bit duplicitous to be neutral on SPY while being bearish on IWM.
But sometimes you have to go with the Preponderance of Evidence (or will it prove Preposterous Evidence?)
An update will be coming.
*Sorry for bringing up options. One can just go short IWM. I will explain my option choice one day.
My ideas here on TradingView are for educational purposes only. It is NOT trading advice. I often lose money and you would be a fool to follow me blindly.
Fibonacci
ETHUSDT WEEKLY UPDATE — PART 1
When Conviction Fails: Apex Rejection, Hidden Redistribution, and the Illusion of Demand
Good morning, good afternoon, good evening, wherever you're tapping in from. Now, as always, I’m not here to waste your time with unnecessary waffle. Let’s get straight into it and unpack this mess step-by-step.
THE APEX REJECTION | MORE THAN JUST A WICK
So picking up from last week's update, we find ourselves right at the crossroads, and not the romantic kind either. What we’re looking at right now so far, is a clean yet 100% conclusive rejection from the apex of a key macro structure.
This isn’t just any level. This is the intersection of vertical momentum and horizontal memory, the apex of a triangle that’s been forming for months. This is where bullish intent was supposed to hold, supposed to assert dominance, but instead, what did we get? A strong push into resistance, a failure to fix above it, followed by exhaustion and signs of institutional unloading.
Now, to the untrained eye, this may look like a pullback, or even a healthy correction. But we’re not here to look at charts with retail goggles. We’re here to track the true intent behind the price action, and if you know your schematics, this is screaming redistribution. And not just any redistribution, the kind that happens right before the market changes its personality.
WHERE ARE WE IN THE SCHEMATIC?
If we overlay Wyckoff logic on top of this structure, it's very clear:
We’ve had our PSY (preliminary support).
Followed by a spring, a shakeout, and a fake rally.
Now we’re dancing around what appears to be the UTAD (upthrust after distribution) — but weaker.
This isn’t classic distribution, it’s redistribution masked in macro confusion.
Here’s the thing this range isn’t just price consolidation, it’s behavioural conditioning. This long, choppy sideways movement is designed to wear out both bulls and bears, making them question their bias, mismanage their risk, and either overstay or exit too early.
The market is methodical, not random. These candles aren’t accidents, they are footprints of algorithmic trap setting, and right now, it looks like the net is about to close.
VOLUME TELLS THE TRUTH
Let’s not forget volume. Look at the weekly volume through this recent push:
Decreasing volume on the rallies,
Higher volume on the red closes,
And multiple spikes that failed to carry price past resistance.
That’s your dead giveaway. You don’t need to be a wizard, just follow the clues. Price is being pushed, not lifted. Demand isn’t stepping in, liquidity is being removed. This isn’t smart money accumulation, if confirmed by the endd of this week, this most recent move up cout be doing of smart money unloading, Quietly and Efficiently.
THE MARKDOWN IS PRIMED
Let’s now address the elephant in the room, the range low and point C of the triangle on the 4H.
T hat’s where liquidity is sitting.
That’s where the market’s next objective lies.
We’ve now failed to reclaim the apex, the wick was slapped down, and unless something significant shifts, the next logical move is to sweep that C point, take out the emotional support, and either:
Tap into true demand (if it exists), or
Begin the cascade toward the final green demand zones between 2,150–2,070, which we marked weeks ago.
And don’t forget, this sweep may not be clean. We could get a fakeout bounce mid-range — enough to bait in more longs, only to roll over again.
PSYCHOLOGICAL LAYER
What’s happening here isn’t just technical, it’s emotional warfare. This entire range has been one long gaslight for the average trader. Between the failed breakouts, failed breakdowns, and chaotic intraday behaviour, retail has been turned into liquidity.
And if you’re still trying to long blindly at the top of this, hoping for 3k ETH without a confirmed structure reclaim, then respectfully, you’re the product right now.
Coming next in Part 2:
A full breakdown of the 4H macro setup
Analysis of the internal range mechanics
Recalculated fib zones
Where the liquidity pockets are
What the most probable path is short, medium, and long-term
Stay tuned — I’ll keep the flow coherent, structured, and aggressive. No fluff. No hopium. Just structure, psychology, and execution.

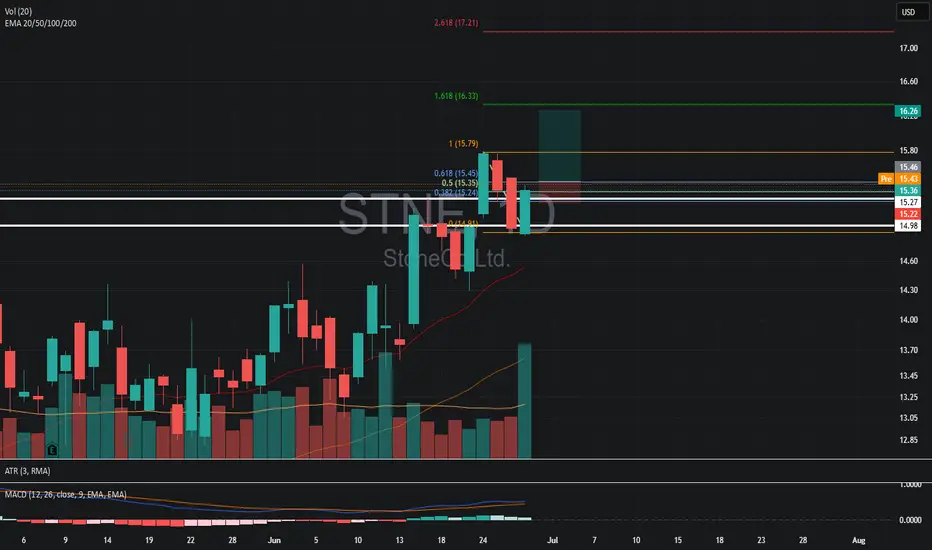
STNE on WatchLooking to buy a breakout above $15.45 (.618 fib level)
Why:
Uptrend
Strong green close on Friday with high volume
Low volume on the pull back, June 25 & June 26
Stop is below 15.24 which is the .382 fib which almost lines up with the high on June 17.
Target is around $16.26 which is just under 1.618 fib level
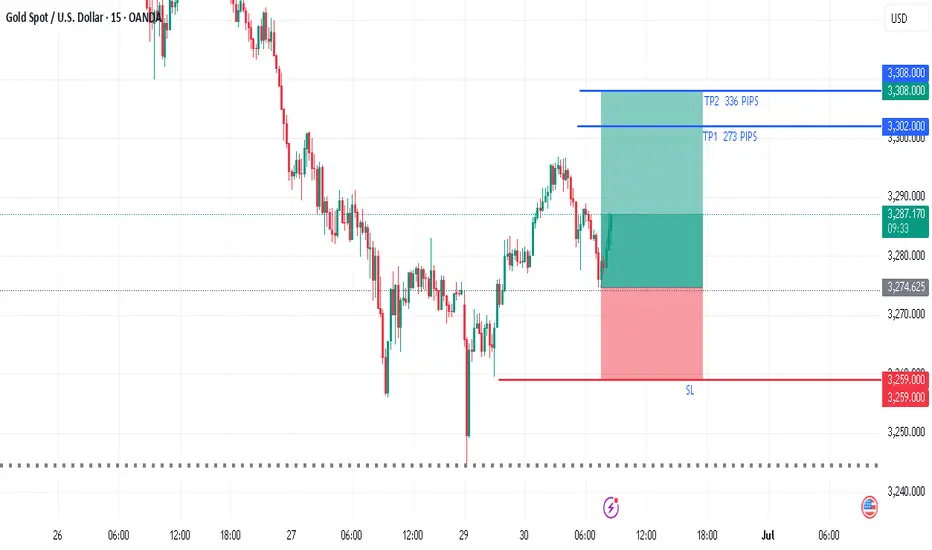
XAU/USD Trade Setup – June 30, 2025📉 XAU/USD Trade Setup – June 30, 2025
Bias: Short (Sell Position)
Entry Zone: Around $3,363–$3,370
Stop-Loss: 🔺 $3,259 (Above recent highs)
Take-Profit 1: 🎯 $3,308
Take-Profit 2: 🎯 $3,302
Risk/Reward: Favorable (1.8–2.2:1 depending on entry)
🔍 Technical View
Trend: Bearish below $3,370
Structure: Price rejected key resistance at $3,370–$3,380
Indicators:
RSI weakening near 50 (bearish bias)
MACD crossing down on H1
Key Zone: A break and close below $3,350 will likely drive price toward your TP zones at $3,308 and $3,302.
⚠️ Notes
Volatility expected near NY session open or if macro data hits (e.g. Fed speakers, inflation prints)
Consider scaling out partial profits at TP1 ($3,308) to lock gains
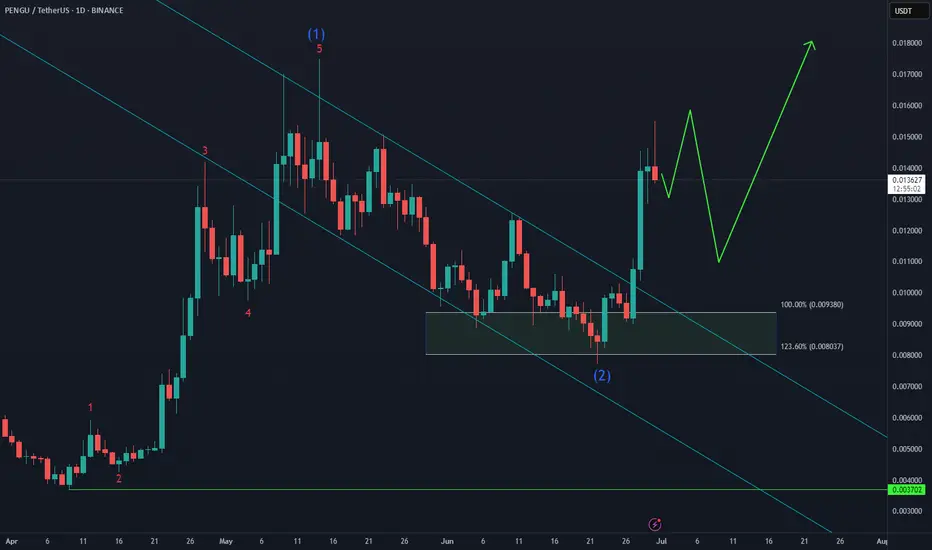
Pudgy Penguins PENGU Bullish Reversal Taking Shape🐧 Pudgy Penguins BINANCE:PENGUUSDT has bounced twice from the $0.009–$0.008 buying zone, showing resilience despite the choppy structure. As long as the June low holds, the setup favors a higher low formation next month, potentially setting the stage for the next impulsive leg higher.
Momentum is building — now it’s about follow-through and confirmation.
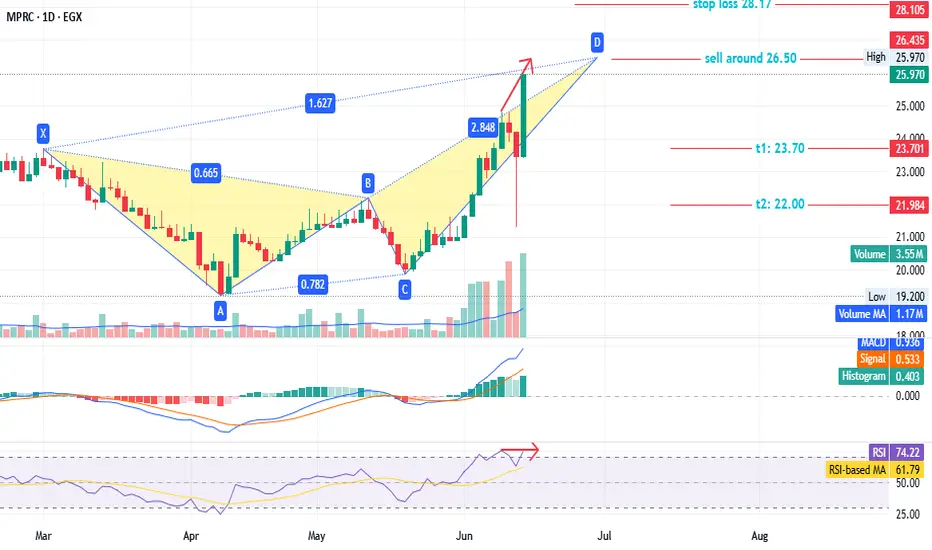
$MPRC - Beware of the bears trap** EGX:MPRC - 1-Day Timeframe**
A highly complete bearish Gartley pattern is forming.
- **Sell Point:** Around 26.50
- **Stop Loss/Reentry:** 28.17 (estimated loss: -7.00%). A close above 28.17 would signal continued upward momentum.
- **First Target:** 23.70 (estimated profit: 10.40%)
- **Second Target:** 22.00 (estimated profit: up to 16.87%)
**Notes:**
- The RSI shows weakness but remains above 70, indicating strength. A close below 70 would signal a halt to the upward trend. Until then, the stock remains positive for the long term.
- This analysis is based on the 1-day timeframe.
**Disclaimer:** This is not investment advice—only my interpretation of the chart data. Consult your account manager before making any decisions. Good luck!
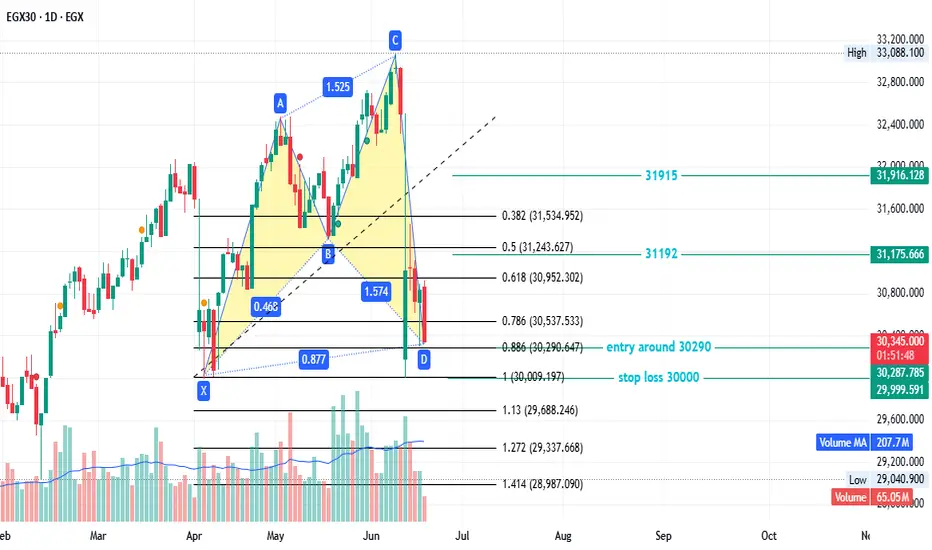
EGX30 - good newsEGX30 created a bullish pattern
entry around 30290
stop loss 30000
first target 31192
secund target 31915
This is not investment advice—only my analysis based on chart data. Consult your account manager before investing. Good luck!
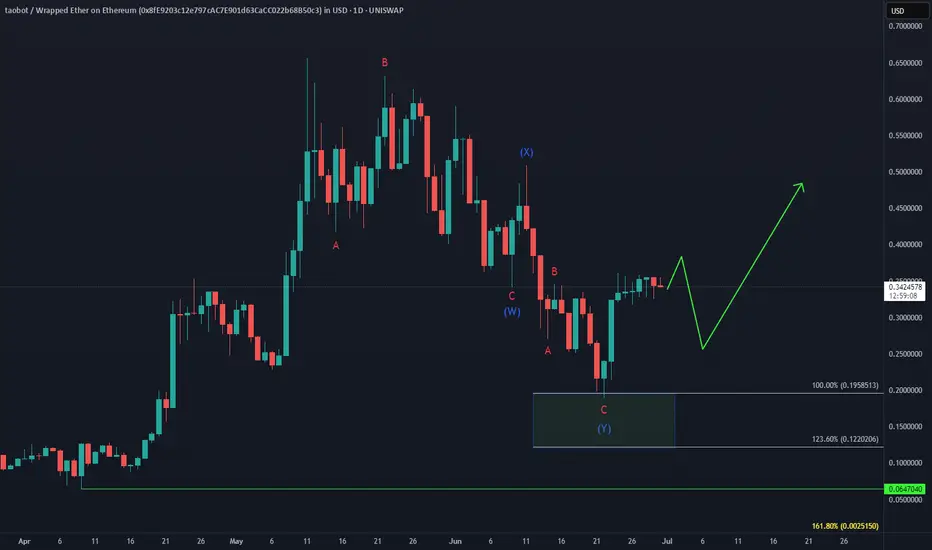
TAOBOT Bullish ReversalWill UNISWAP:TAOBOTWETH_8FE920.USD outperform BINANCE:TAOUSD ?
After the failed early June bounce, price completed a double correction into the $0.195–$0.12 equal legs zone, triggering a sharp 90% reaction higher.
As long as $0.19 holds, the setup favors continuation to the upside, with a break above the May peak in focus.
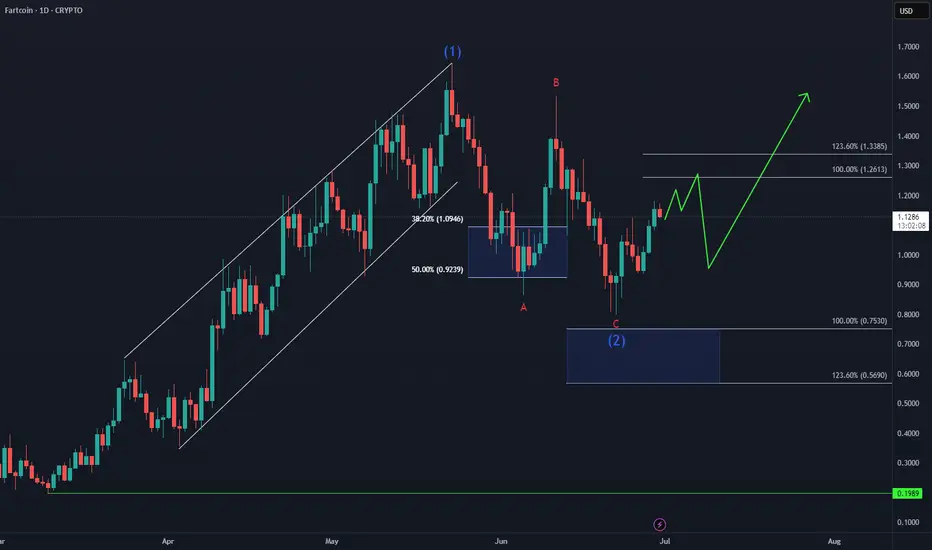
FARTCOIN Bullish Reversal in Progress
CRYPTO:FARTCOINUSD 3-swing correction from the May peak appears complete, even though price didn’t quite tag the $0.75 entry zone.
Now, the spotlight’s on the bulls — can they deliver an impulsive rally off the lows to invalidate a potential double correction next month?
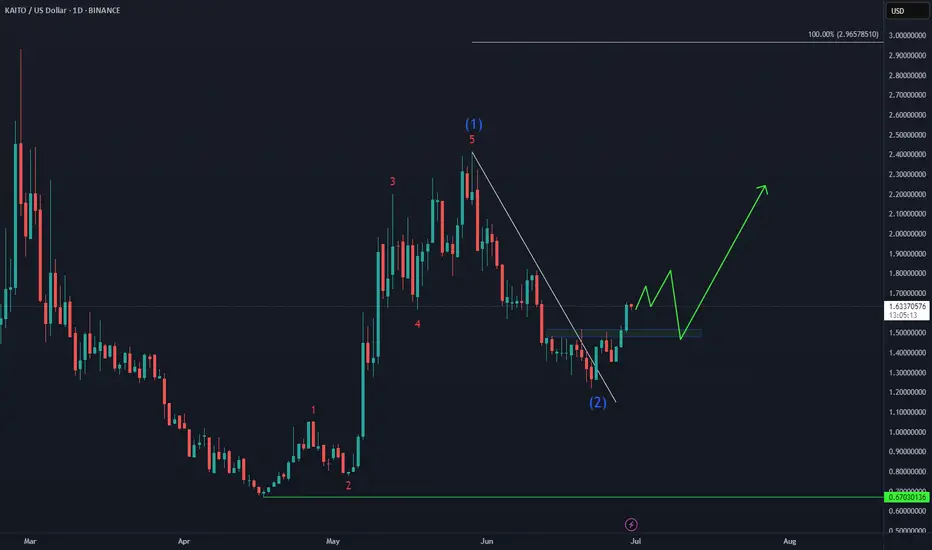
KAITO gears up for liftoff!CRYPTO:KAITOUSD
The correction from the May peak has wrapped up within wave (2), and price is now pivoting from the June low at $1.22. Holding above that level keeps the bullish roadmap intact—with eyes firmly on the $2.96 target to unlock fresh all-time highs.
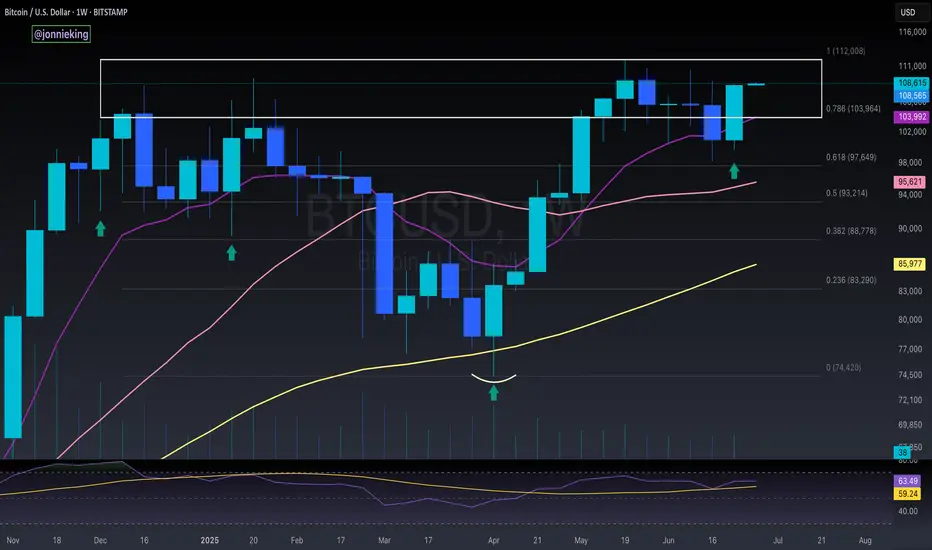
Bitcoin BTC price analysis BTC.D and events calendar for JulyToday is the last day of the month and the last day of the second quarter, so there may be some volatility in the markets between 🐂 VS 🐻
💰 The CRYPTOCAP:BTC chart shows an interesting picture — the price has reached the upper limit of the consolidation channel, and now:
1️⃣ The scenario with an upward breakout is quite clear: a breakout from the channel upward and consolidation above $108-110k= a move to $125k during July.
2️⃣ A correction to $99k will mean that buyers have taken control of the OKX:BTCUSDT price, preventing it from updating its lows. This will be a clear signal to buy, because further growth is inevitable.
3️⃣ A deep correction to $91,660 (filling the GAP that formed on the CME BTC chart) or slightly lower. This is the last “unclosed” GAP, which, according to TA rules, should be filled for a full-fledged growth trend to begin.
So which scenario is closer to your heart, which one do you believe in?
Or write your version of events in the comments.
Interesting observations to think about:
◆ Over the past two weeks, the inflow of funds to #BTCETF has exceeded $5 billion, but the price of #BTCUSD on CEX exchanges has not been able to “break out” upward. Is this just ETF "property of numbers", or are spot #Bitcoin sales that strong?
◆ The BTC.D indicator has reached a critical level of 66%, and it will be interesting to see whether it will give altcoins some breathing room next month.
(If there are a lot of likes and comments under the idea, we will additionally describe our thoughts on BTC.D and USDT.D.)
◆ SP 500, by the way, has updated its highs, and the last few months on the stock market are very similar to the beginning and middle of the COVID-19 pandemic in 2020.
◆ And in principle, July promises to be very eventful:
👉 By July 9, Trump is expected to make a statement regarding the tariff wars with the rest of the world, which he has put on hold.
👉 July 18 marks the beginning of Mercury retrograde, which “influences” people's behavior and ‘superstitions’ and forces them to be “more cautious” when making trading decisions (and trading bots don't care about emotions and beliefs)
👉 And on July 30, there will be a FOMC meeting, where Mr. Powell may announce a rate cut, as the US is in a recession, which is time to acknowledge.
If we have forgotten anything, please add it in the comments!

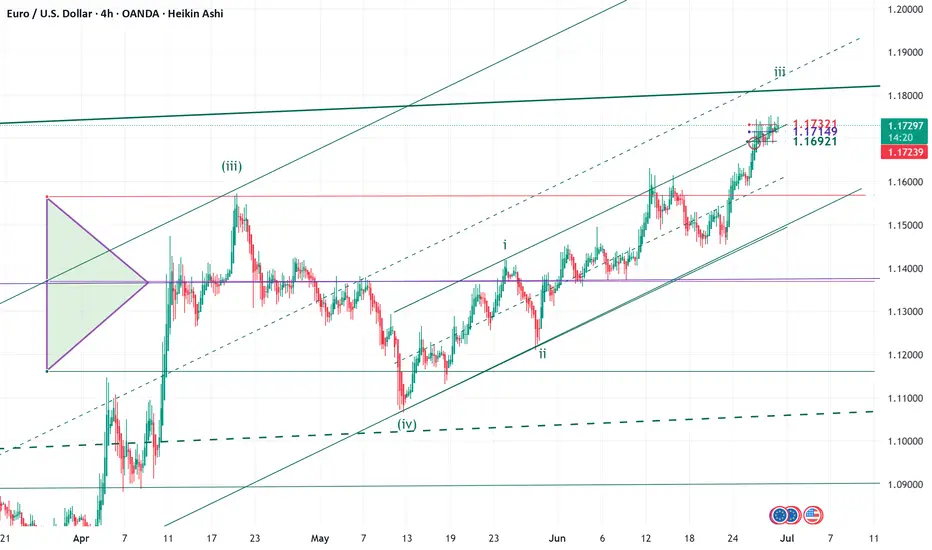
ELLIOTT WAVE EURUSD H4 update
EW Trade Set Up H4
minuette W4 ended, w5 running
with the decisive break of the 1.1570 level, wave 4 can be declared finished and wave 5 is underway in motive way. Not clear yet the type of motive wave impulsive or diagonal.
daily key levels (area)
1.1732
1.1715 POC
1.1690
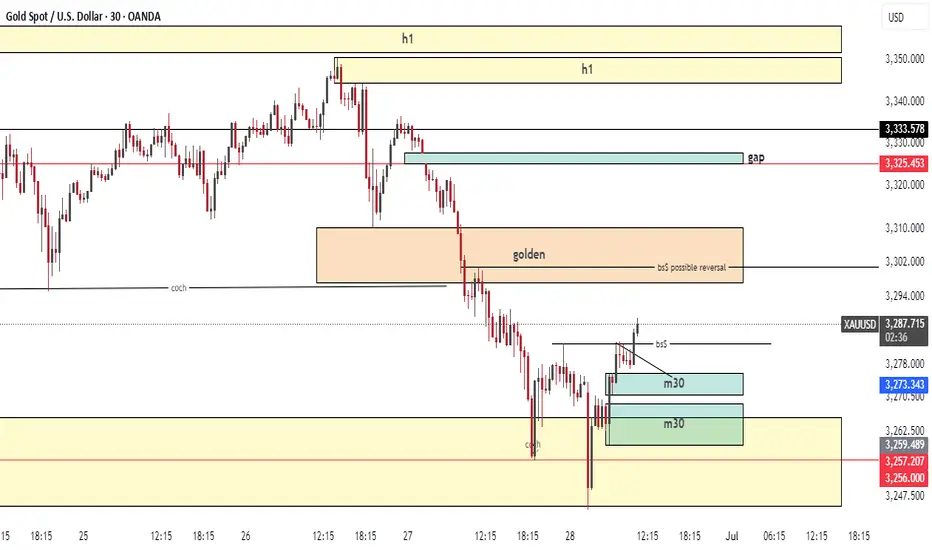
XAUUSD AnalysisAs from the above analysed chart I can see possible reversal from the zone 3297-3310 .
So, we can dilligently hope to find our setup from the zone .
Please follow me to find out my setup .
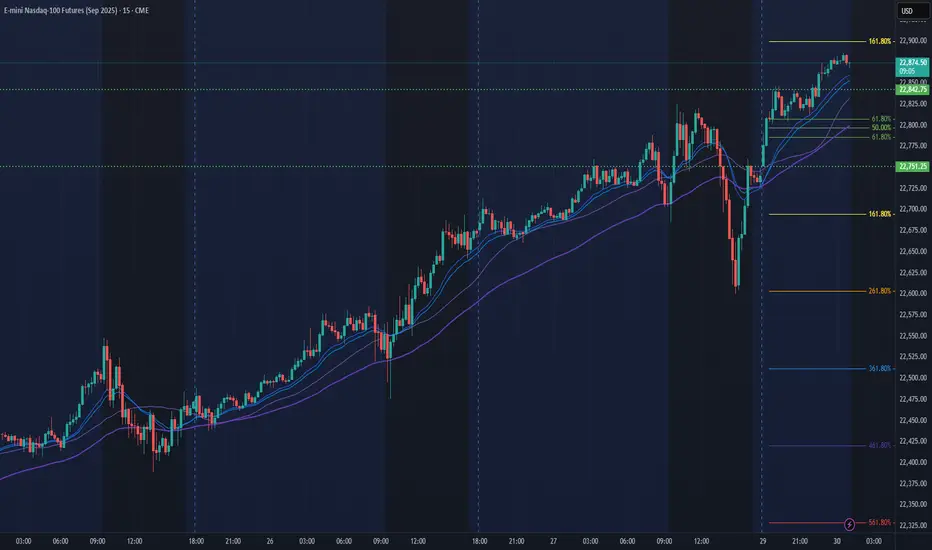
NQ Power Range Report with FIB Ext - 6/30/2025 SessionCME_MINI:NQU2025
- PR High: 22842.50
- PR Low: 22751.50
- NZ Spread: 202.75
Key scheduled economic events:
09:45 | Chicago PMI
Weekend volatility taking auction into new ATHs
Session Open Stats (As of 12:45 AM 6/30)
- Session Open ATR: 345.85
- Volume: 33K
- Open Int: 261K
- Trend Grade: Neutral
- From BA ATH: +0.1% (Rounded)
Key Levels (Rounded - Think of these as ranges)
- Long: 23239
- Mid: 21525
- Short: 20383
Keep in mind this is not speculation or a prediction. Only a report of the Power Range with Fib extensions for target hunting. Do your DD! You determine your risk tolerance. You are fully capable of making your own decisions.
BA: Back Adjusted
BuZ/BeZ: Bull Zone / Bear Zone
NZ: Neutral Zone
$BTC Bullish Engulfing Weekly CloseCRYPTOCAP:BTC closes the Week with a Big Bullish Engulfing candle back within the POI.
Should retest ATH soon.
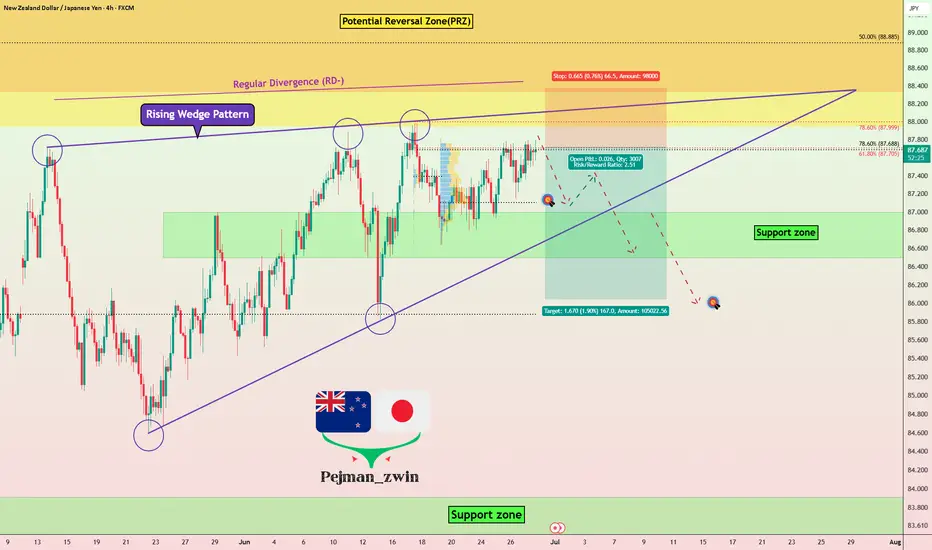
NZDJPY Technical + Fundamental Short Alignment = Short SetupToday, I want to review the NZDJPY ( OANDA:NZDJPY ) pair short position from a fundamental and technical perspective . It seems to be in a good zone for a short position.
Do you agree with me?
----------------------------------------
First, let's look at the fundamentals of NZDJPY.
New Zealand (RBNZ):
The Reserve Bank of New Zealand cut the OCR by 25bps in May and hinted at further easing if inflation continues to cool. Recent CPI data has shown clear disinflation trends, increasing the likelihood of more rate cuts in the second half of 2025. Consumer confidence is also declining, and retail sales have been weaker than expected.
Japan (BoJ):
The Bank of Japan is under growing pressure to tighten monetary policy. Inflation remains above 2%, and market expectations for a rate hike later this year are building. Any shift from ultra-loose policy supports JPY strength, especially against weaker yielders like NZD.
Macro Summary:
Diverging monetary policies: RBNZ easing, BoJ possibly tightening.
NZD weakened by soft data, JPY strengthened by policy expectations.
Risk sentiment is currently neutral-to-negative, favoring safe-haven JPY.
Conclusion:
Short NZDJPY is fundamentally justified. The pair aligns with macro forces: NZD is pressured by rate cuts and weak growth, while JPY is poised to strengthen with upcoming policy shifts.
----------------------------------------
Now let's take a look at the NZDJPY chart on the 4-hour time frame .
NZDJPY is currently trading near the Potential Reversal Zone(PRZ) .
In terms of classic technical analysis , it appears that NZDJPY has successfully formed a Rising Wedge Pattern .
Also, we can see the Regular Divergence(RD-) between Consecutive Peaks.
Based on the above explanation , I expect NZDJPY to drop to at least 87.159 JPY if the lower line of the Rising Wedge Pattern and the Support zone(86.50 JPY-87.00 JPY) are broken, the second target could be 86.043 JPY .
Note: Stop Loss(SL): 88.378 JPY
Please respect each other's ideas and express them politely if you agree or disagree.
New Zealand Dollar/ Japanese Yen Analyze (NZDJPY), 4-hour time frame.
Be sure to follow the updated ideas.
Do not forget to put a Stop loss for your positions (For every position you want to open).
Please follow your strategy and updates; this is just my Idea, and I will gladly see your ideas in this post.
Please do not forget the ✅' like '✅ button 🙏😊 & Share it with your friends; thanks, and Trade safe.