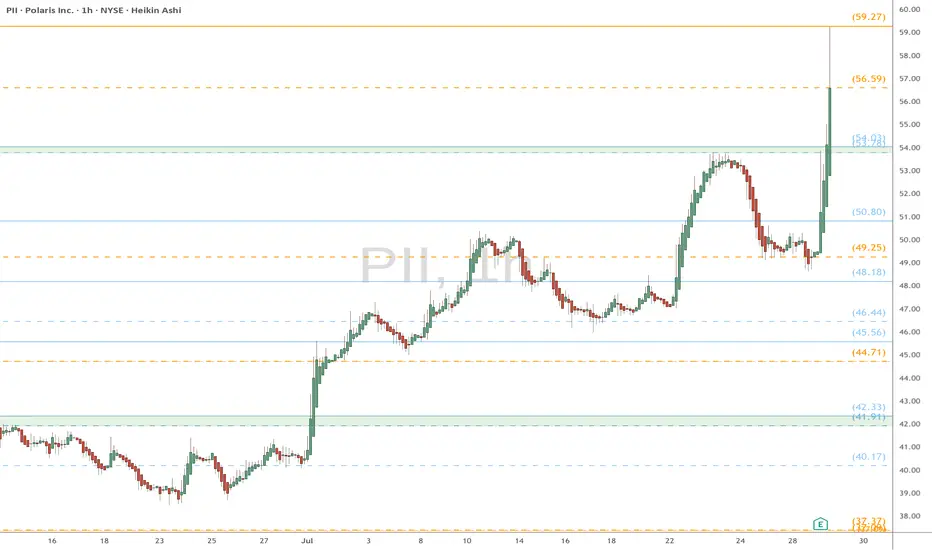
PII eyes on $59.27: Golden Genesis may give a Dip-to-Fib entryPII earnings report spiked it into Golden Genesis at $59.27
Looking for a dip to enter on the strength of earnings.
Golden Covid below at $56.59 or green zone around $54
Fibonacci
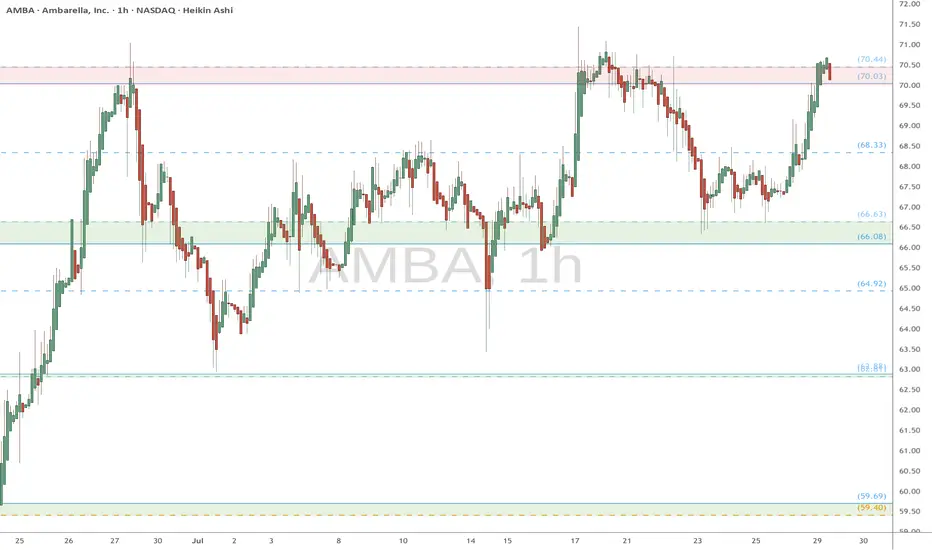
AMBA watch $70.03-70.44: Proven resistance holding up new highs AMBA has been trying to float upwards with the market tide.
Currently struggling against a proven resistance $70.03-70.44
Looking for a Break-n-Retest ideally or Dip-to-Fib for entries.
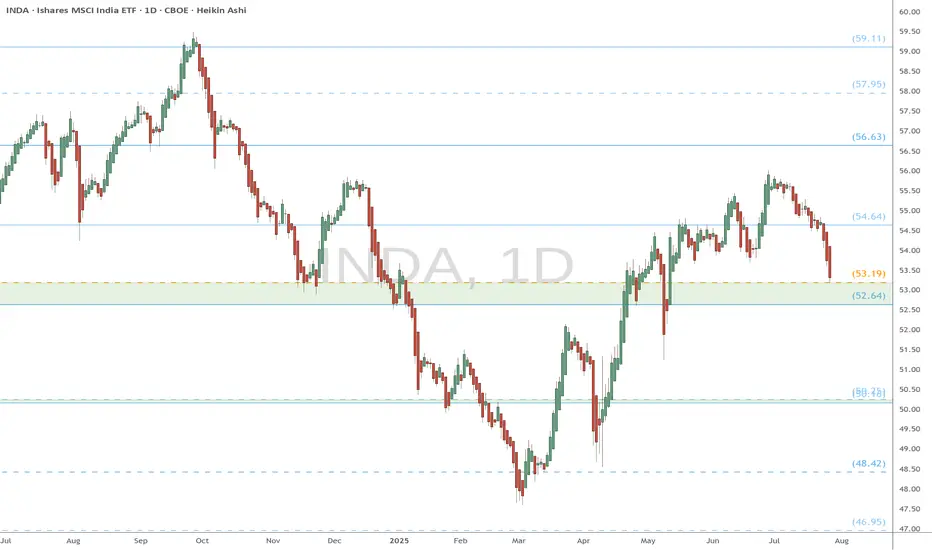
INDA eyes on $52.64-53.19: Major support could mark the BottomINDA painting a bottom with an inverted Head-n-Shoulders.
The neckline happens to be a fib confluence $52.64-53.19
Good spot to consider longs with stop loss just below zone.
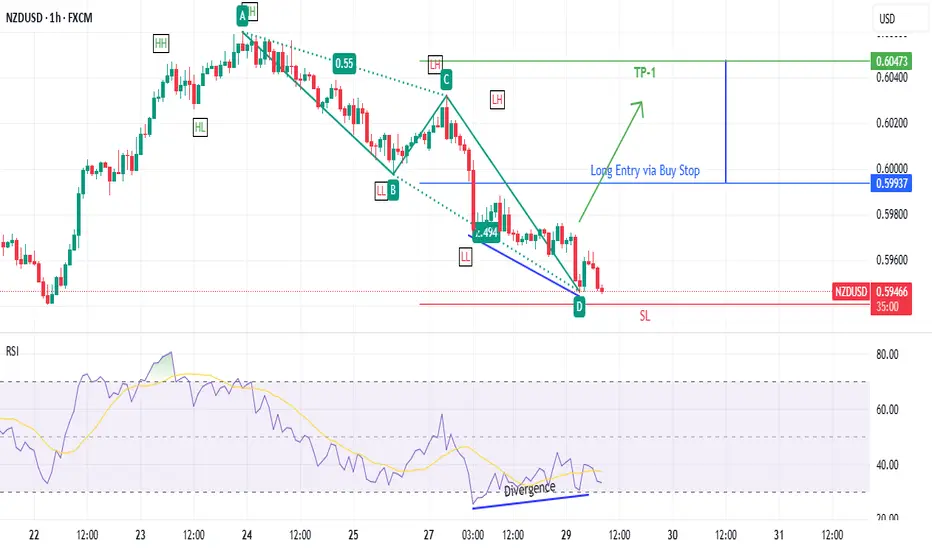
NZDUSD long trade dated 29 July 2025- Breakout of last LH will suggest that the odds are in favour of the long trade
- Presence of a bullish AB=CD pattern increases our chances. However entry set via Buy Stop after confirmed trend reversal
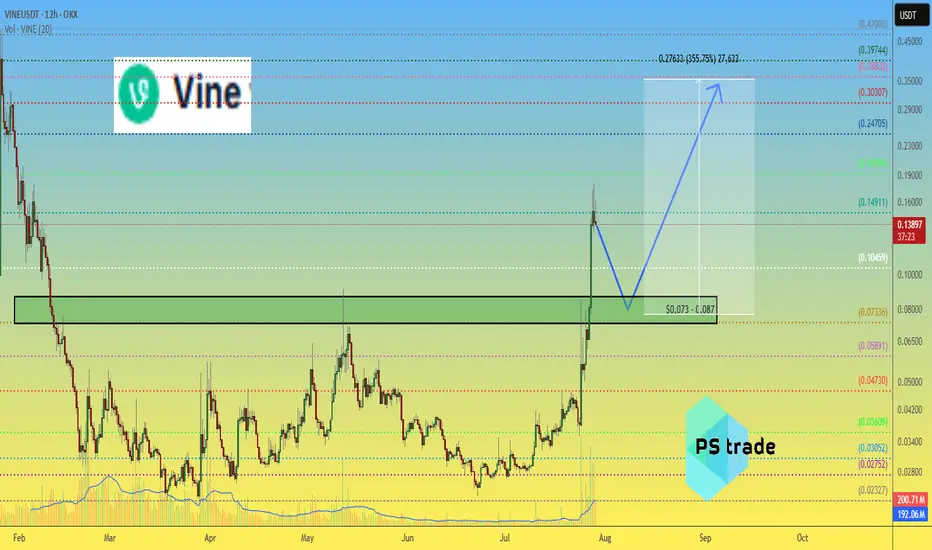
VINEUSDT – Possible "Double Bottom" in PlayPerhaps the OKX:VINEUSDT chart is continuing to working out the “double bottom” pattern.
🎯 The maximum target for this pattern is $0.35, but so far the price is half that.
💥 Trading #VINE is a complete gamble, as it is a meme coin from the PumpFun platform mentioned by Musk, a manipulative combo with no fundamentals.
🎲 But if the price of #Vine stays above $0.073-0.087, and you like gambling, then maybe this trade, with a potential +350%, is just for you)
________________
📚 Follow us ❤️ for daily crypto insights & updates!
🚀 Don’t miss out on important market moves!
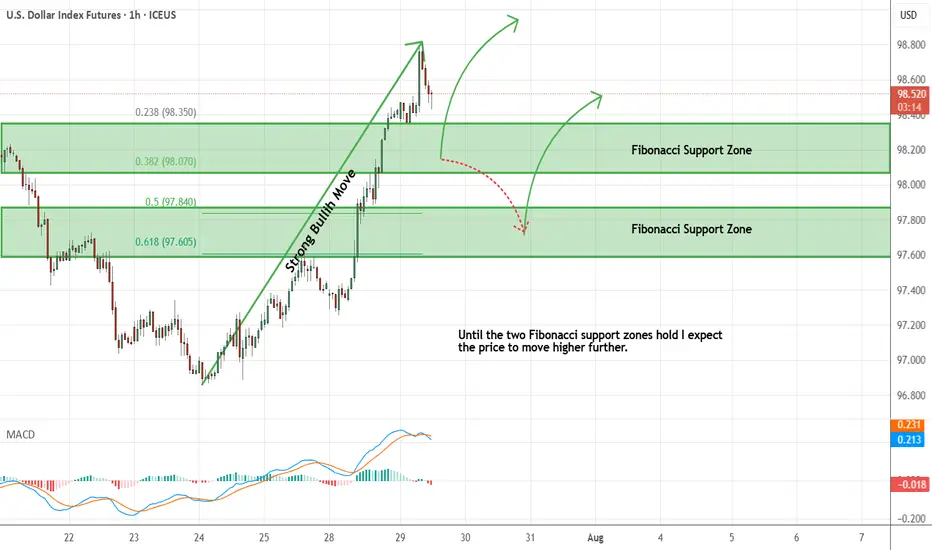
Dollar Index - Expecting Bullish Continuation In The Short TermH4 - Strong bullish momentum followed by a pullback.
No opposite signs.
Until the two Fibonacci support zones hold I expect the price to move higher further.
If you enjoy this idea, don’t forget to LIKE 👍, FOLLOW ✅, SHARE 🙌, and COMMENT ✍! Drop your thoughts and charts below to keep the discussion going. Your support helps keep this content free and reach more people! 🚀
--------------------------------------------------------------------------------------------------------------------
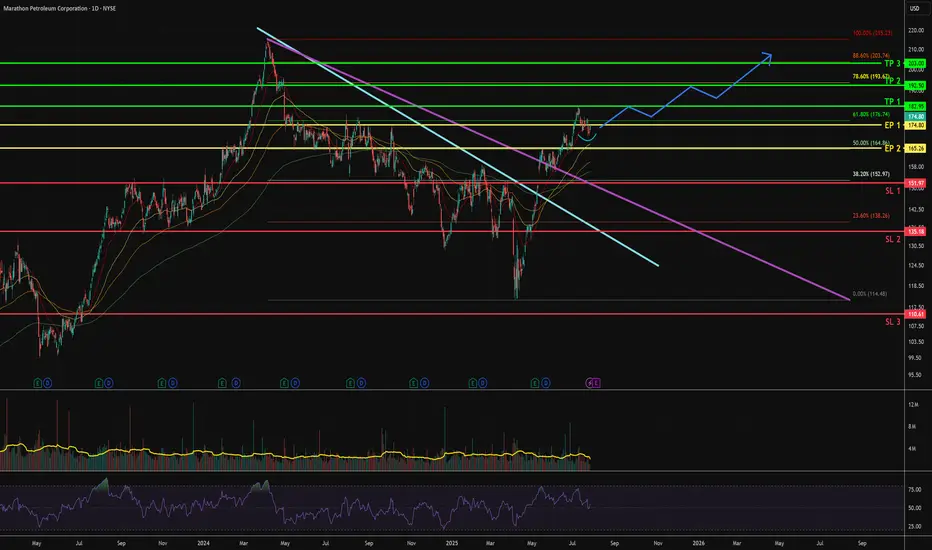
MPC - Upside swing [ 1 to 3 months ]1. Downtrend line of 11 months is broken
- Price gapped up, and sustained above Fib 38.2% and 50%.
- This concludes the end of bear trap and the switch from bear to bull trend.
2. In the last month, weak selling pressure is noticed.
- Rounding bottom above previous 1D resistance at $171.50
- Closes are creeping near to Fib 61.8%
- Flipping to bullish stance
3. Entry points
EP 1 - buy spot with 1 or 0.5 size
EP 2 - Enter another 1 or 0.5 size if closing prices stay above Fib 50% at $164.8
Gold is in the Bearish Direction after Breaking SupportHello Traders
In This Chart GOLD HOURLY Forex Forecast By FOREX PLANET
today Gold analysis 👆
🟢This Chart includes_ (GOLD market update)
🟢What is The Next Opportunity on GOLD Market
🟢how to Enter to the Valid Entry With Assurance Profit
This CHART is For Trader's that Want to Improve Their Technical Analysis Skills and Their Trading By Understanding How To Analyze The Market Using Multiple Timeframes and Understanding The Bigger Picture on the Charts
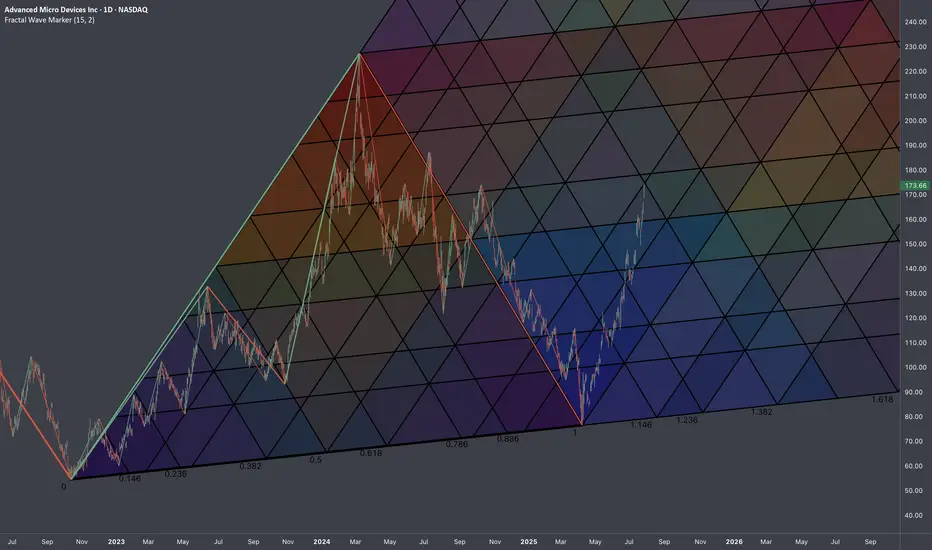
$AMD: Fractal Geometry (Cycle 2022-2025)🏛️ Research Notes
3 Coordinates used for base L-H-L
Fragmented with color spectrum fibs:
Extending structure with same scaling laws:
The chart intended to show objective structure covering unfolding progressions within cycles.
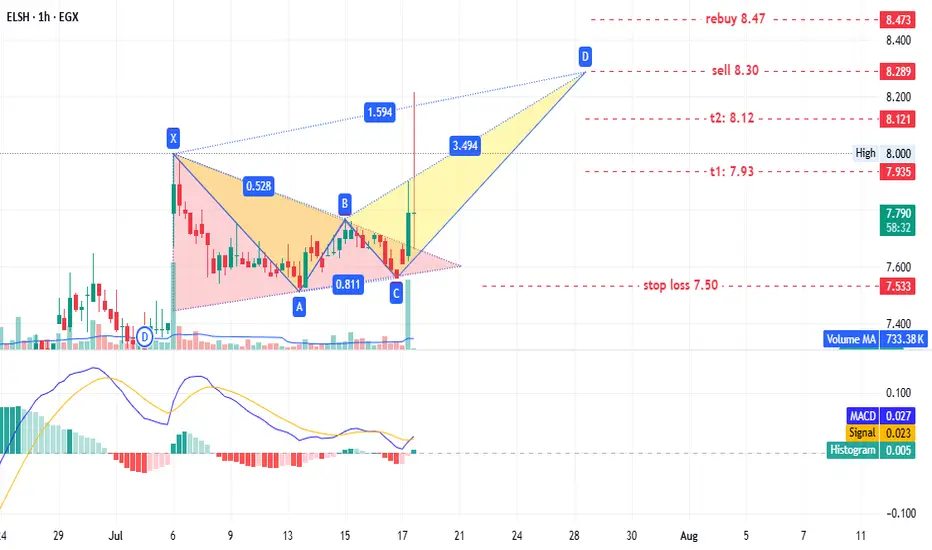
ELSH - old player EGX:ELSH timeframe: 1 hour.
A triangle pattern was identified, targeting 8.20. No new entry is recommended for shareholders, but if prices retest the triangle pattern at 7.65–7.60, it could present a low-risk entry opportunity.
This may also form a potential bearish Gartley pattern with targets:
- T1: 7.93
- T2: 8.12
- T3: 8.30 (sell point)
Stop loss: 7.50.
If prices continue rising and close above 8.47, consider rebuying what was sold at 8.30.
Disclaimer: This is not financial advice, only our analysis based on chart data. Consult your account manager before investing.
Good luck!
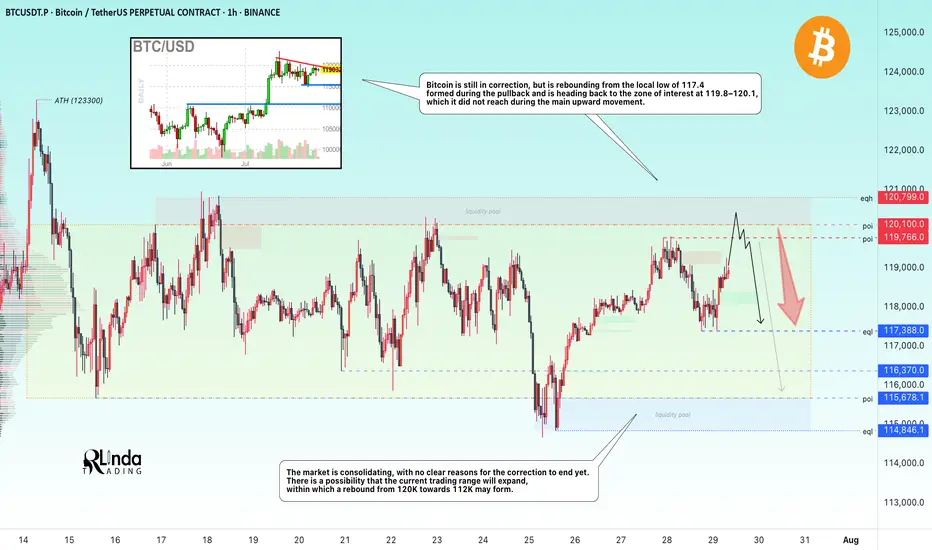
BITCOIN → Hunting for liquidity. Retest resistance before a fallBINANCE:BTCUSDT.P continues to consolidate after a strong rally. There is no strong driver yet, and Bitcoin is reacting weakly to economic data. There is a possibility of a continued correction...
Bitcoin is still in correction, but is rebounding from the local low of 117.4, formed during the pullback, and is heading back up towards the zone of interest at 119.8-120.1, which it did not reach during the main upward movement. I see no fundamental or technical reasons for the correction to end and for growth beyond 121K. I expect a rebound from the resistance zone towards 115-114K. However, in the medium term, I expect the market to attempt to close half or all of the gap between 112K and 114.8K, thereby expanding the key trading range.
Resistance levels: 119.77, 120.1K, 120.8K
Support levels: 117.4, 116.37, 115.68
Technically, a false breakout (liquidity capture) of key resistance and price consolidation in the selling zone could trigger bearish pressure on the market, which in turn would lead to a correction.
Best regards, R. Linda!
Ethereum Long: Using Log Chart to Analyze, Target $6600In this video, I go through the analysis using the log chart for Ethereum and shows the potential of this cryptocurrency where I expect the price to reach new high in the coming days with a longer-term target of $6600.
For shorter-term trading, I recommend placing the stop a distance below recent support on the daily chart, around $3372.
Good luck!

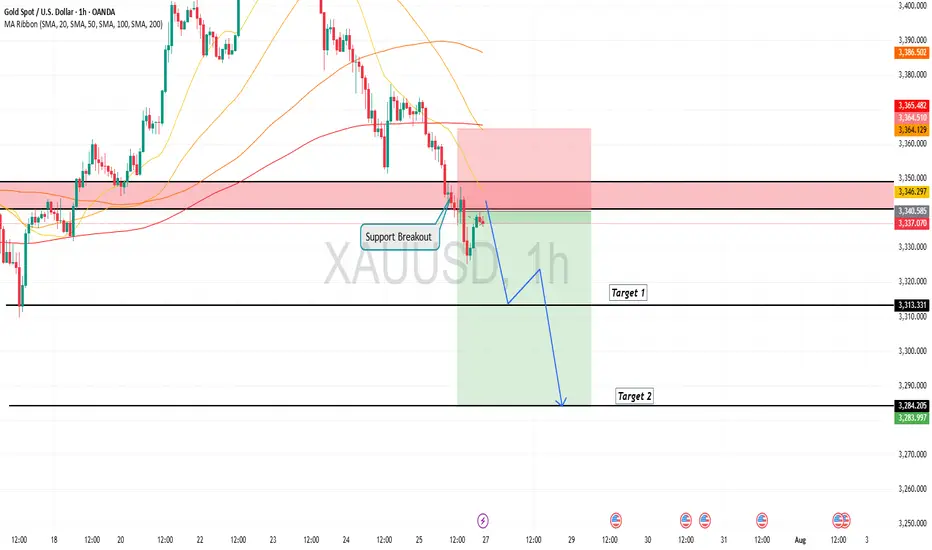
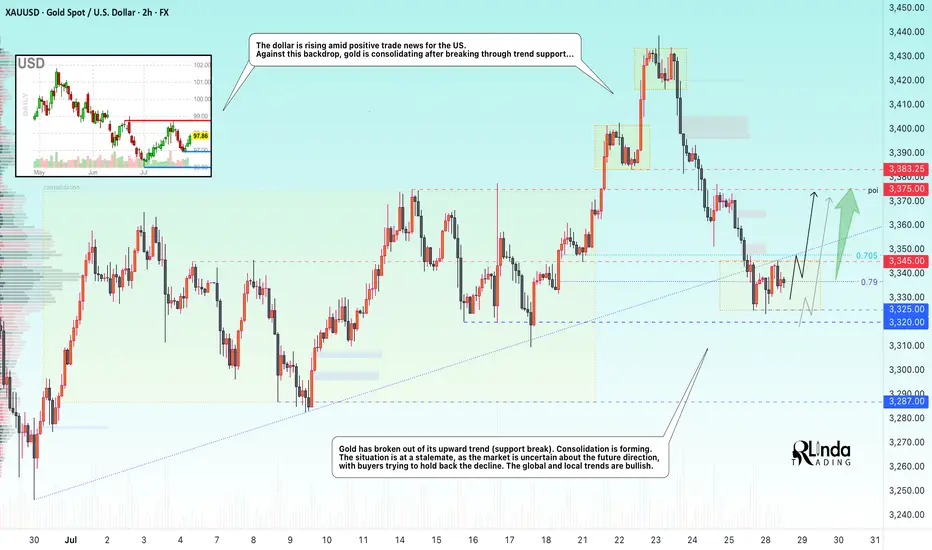
GOLD → Retest of trend support. Consolidation...GOLD is consolidating below the previously broken trend support. On Sunday, Trump announced a trade deal with the EU, which is putting pressure on the market along with the rising dollar...
Gold rebounded from support at $3310 after a week-long low, interrupting a three-day decline amid profit-taking. However, the overall downtrend remains intact as markets brace for a busy week with the release of US GDP data and the Fed's decision. Optimism surrounding US-China trade talks and the US-EU framework agreement is reducing demand for safe-haven assets. Additional pressure on gold is coming from easing geopolitical tensions: Thailand and Cambodia have agreed to ceasefire talks. The metal's recovery may be short-lived.
Technically, we have global and local bullish trends, against which gold is testing support, but as we can see, buyers are trying to hold back the decline due to uncertainty over interest rates. There is a chance that we will see active action by the Fed, behind which lies a rate cut, this week...
Resistance levels: 3345, 3375
Support levels: 3320, 3287
At the moment, I do not see a proper reaction to the support breakout. The price is consolidating after confirming the key trigger at 3345. Thus, if the price starts to return to 3345, test and consolidate above the level, we will have a chance for growth. I do not rule out a liquidity grab from 3325 (false breakout) before the rise.
BUT! The structure will be broken if the price breaks 3325 - 3320 and begins to consolidate below this zone. In this case, gold may fall to 3287
Best regards, R. Linda!
USDJPY – Strap in For the Central Bank Rollercoaster The next 4 trading days could be crucially important for FX markets, with traders bracing for the outcomes of a variety of different events including several central bank meetings, economic data readings and trade deal/tariff negotiations. No currency pair within the majors is likely to feel the impact of these events more than USDJPY, given that both the Federal Reserve (Fed) and Band of Japan (BoJ) interest rate decisions take place within a 9-hour window late on Wednesday evening and early Thursday morning, UK time (Fed 1900 BST Wed, BoJ 0400 BST Thurs).
The first move in USDJPY at the start of this week has been higher. This was in response to the announcement of a trade deal between the EU/US, which sees tariffs of 15% on most EU goods imported into the US and has been taken as a success for President Trump and his trade team. (general USD positive). When coupled with the political uncertainty surrounding Japanese PM Ishiba, who is fighting to keep his job, (potential JPY negative) USDJPY has traded from opening levels at 147.51 on Monday up to a high of 148.71 earlier this morning in Asia.
Looking forward, both the Fed and BoJ are expected to keep interest rates unchanged. This could make what is said at the accompanying press conferences by Fed Chairman Powell (1930 BST Wed) and BoJ Governor Ueda (0730 BST Thurs) on the timing of their next respective interest rate moves potentially pivotal for the direction of USDJPY into the weekend.
Tier 1 US economic data may also be important, with the Fed’s preferred inflation gauge (PCE Index) due for release at 1330 BST on Thursday, and the next update on the current health of the US labour market due on Friday at 1330 BST in the form of Non-farm Payrolls. Sentiment may also be impacted on Friday by any headlines or social media posts from President Trump regarding trade deals and updates on whether he may extend or hold certain countries to his current deadline of August 1st.
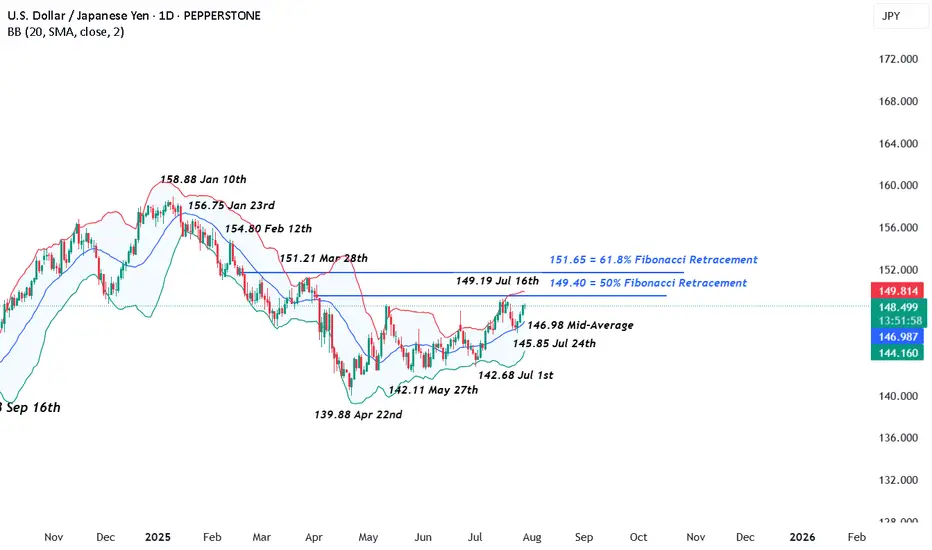
Technical Update: Focus on Fibonacci Retracement Resistance at 149.40
On July 16th 2025, USDJPY traded to a price high of 149.19, nearing what might have been considered a resistance level by traders at 149.40. This level is equal to the 50% Fibonacci retracement of the price weakness seen from 158.88 on January 10th down to 139.88, the April 22nd low. Having been capped by this resistance level, a setback in price developed last week.
However, this phase of price weakness encountered buying support around the Bollinger mid-average, currently at 146.98, from which fresh attempts at price strength have emerged. As a result, it might be argued that this type of price action is more constructive in nature, especially as since the April 22nd low was posted a pattern of higher price lows and higher price highs has so far materialised, as the chart above shows.
That said, with potential for a sustained period of USDJPY volatility in the week ahead let’s consider what may be the important support and resistance levels that could influence the direction of prices moving forward.
Potential Resistance Levels:
Having previously capped price strength, the 149.40 retracement level may prove to be successful in doing so again, meaning closing breaks above 149.40 might now be required to suggest a further period of price strength.
As the chart above shows, if successful breaks above 149.40 do materialise, potential may then turn towards tests of the next resistance at 151.21, the March 28th session high, even 151.65, the higher 61.8% Fibonacci resistance level.
Potential Support Levels:
Having seen it offer support to recent price declines, traders may still be focusing on the 146.98 Bollinger mid-average as an important level that if broken on a closing basis, might lead to a further phase of price weakness.
Closing breaks under the 146.98 support while not a guarantee of further declines, could suggest potential to test 145.85, the July 24th session low and rally point, even towards 142.68, the July 1st low.
The material provided here has not been prepared accordance with legal requirements designed to promote the independence of investment research and as such is considered to be a marketing communication. Whilst it is not subject to any prohibition on dealing ahead of the dissemination of investment research, we will not seek to take any advantage before providing it to our clients.
Pepperstone doesn’t represent that the material provided here is accurate, current or complete, and therefore shouldn’t be relied upon as such. The information, whether from a third party or not, isn’t to be considered as a recommendation; or an offer to buy or sell; or the solicitation of an offer to buy or sell any security, financial product or instrument; or to participate in any particular trading strategy. It does not take into account readers’ financial situation or investment objectives. We advise any readers of this content to seek their own advice. Without the approval of Pepperstone, reproduction or redistribution of this information isn’t permitted.
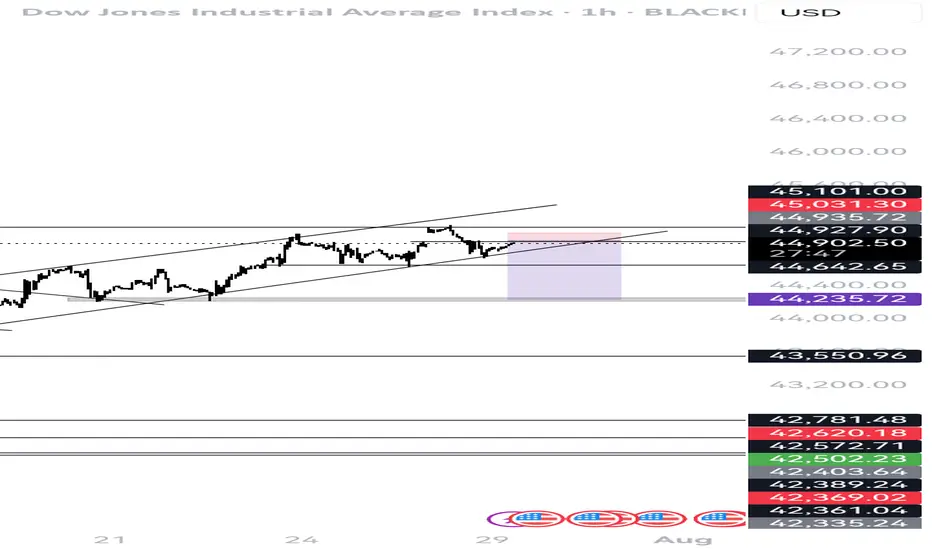
US30 DOW JONESwe are stopping losses tiks above previous high, Shorting chasing the last low 1:1, 1:2
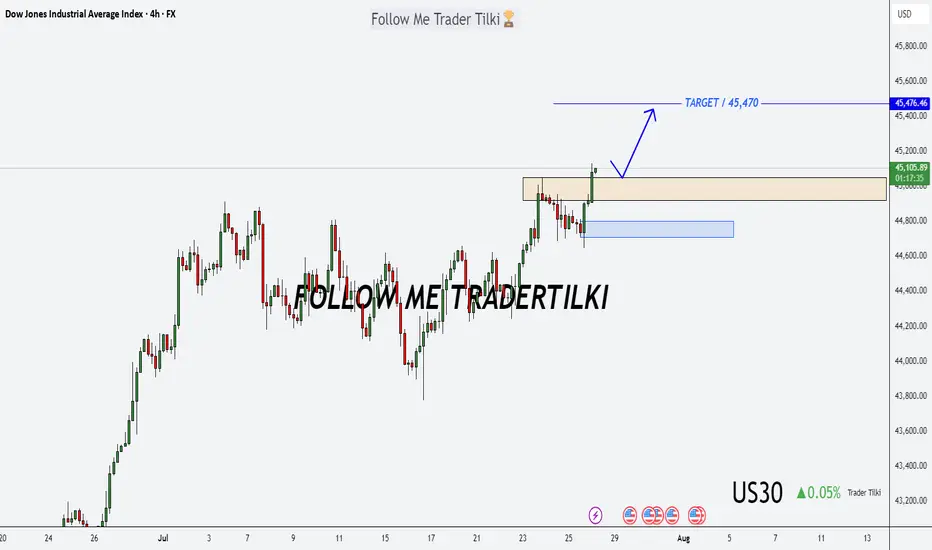
US30 Forecast: Target Locked, Buy Zones in Sight!Good morning friends ☀️
I've prepared a fresh analysis for US30 (Dow Jones).
My current target is 45,470. Even if the price dips to 45,050 or 44,800, I fully expect it to reach that 45,470 mark.
These levels represent strong buying zones and powerful retest regions—don’t forget that.
Every like from you is my biggest source of motivation to keep posting these insights. 💬📊
Big thanks to everyone supporting with a thumbs-up.
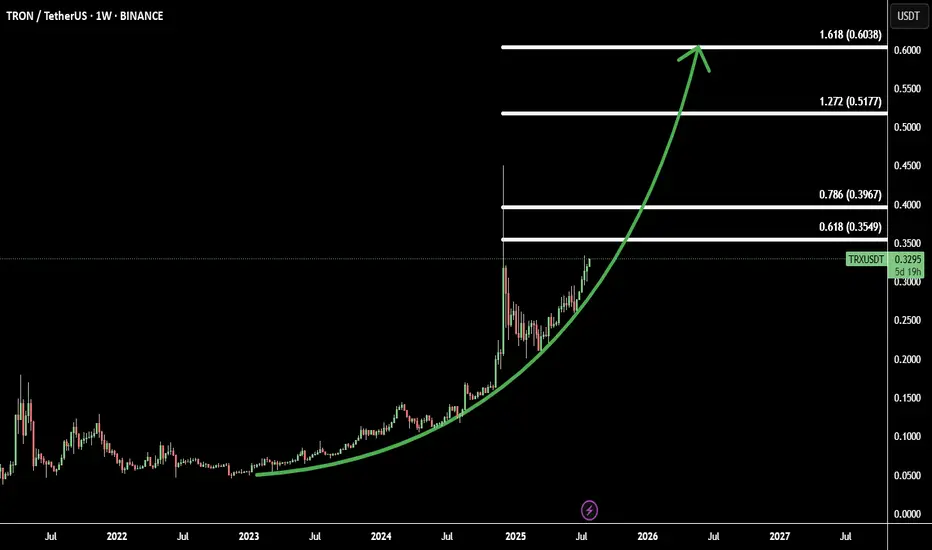
TRX/USDT Starting Parabolic Move: 4 Fibonacci Targets in SightTRX (Tron) is showing early signs of a parabolic breakout, supported by strong momentum and a solid technical structure.
After a long accumulation phase, TRX has gained bullish traction and is now accelerating. The price action suggests the beginning of a steep upward curve, often associated with parabolic rallies.
Using Fibonacci extensions, we identify 4 bullish targets:
Target 1: 0.618 Fib - 0.35 – initial breakout confirmation zone
Target 2: 0.786 Fib – 0.39 - key mid-level resistance
Target 3: 1.272 Fib – 0.51 - extended bullish target
Target 4: 1.618 Fib – 0.60 - full parabolic potential
This setup provides a great opportunity for trend traders aiming to ride the wave early.
GBPUSD SELL After seeing the previous daily close below the low of the weekly bullish support we could expect this pair to continue its move down following the 4hr structure now at a low point we could see a retracement into the Fibonacci area

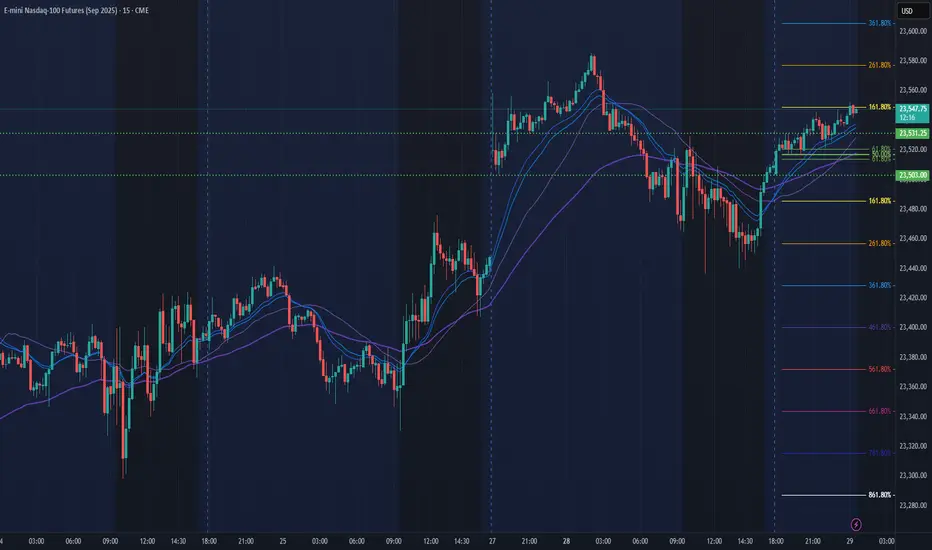
NQ Power Range Report with FIB Ext - 7/29/2025 SessionCME_MINI:NQU2025
- PR High: 23531.00
- PR Low: 23503.00
- NZ Spread: 62.5
Key scheduled economic events:
10:00 | CB Consumer Confidence
- JOLTs Job Openings
Session Open Stats (As of 12:25 AM 7/29)
- Session Open ATR: 233.38
- Volume: 17K
- Open Int: 280K
- Trend Grade: Long
- From BA ATH: -0.2% (Rounded)
Key Levels (Rounded - Think of these as ranges)
- Long: 23811
- Mid: 22096
- Short: 20383
Keep in mind this is not speculation or a prediction. Only a report of the Power Range with Fib extensions for target hunting. Do your DD! You determine your risk tolerance. You are fully capable of making your own decisions.
BA: Back Adjusted
BuZ/BeZ: Bull Zone / Bear Zone
NZ: Neutral Zone
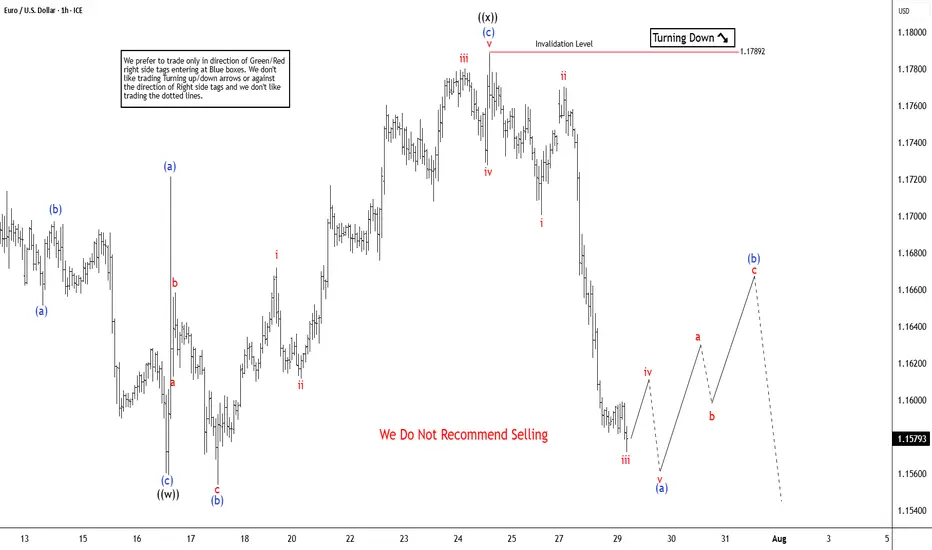
Elliott Wave Update: EURUSD Favors Weakness In To Support ZoneThe EURUSD favors upside in 3 swings from September-2022 low & should extend towards 1.1929 or higher against 1.13.2025 low. In 4-hour, it favors double correction lower from 7.01.2025 high to correct 5.12.2025 low. It favors short term pullback into 1.1512 – 1.1340 area in 7 swing pullbacks before continue rally in cycle from 1.13.2025 low. Above January-2025 low, it ended (1) at 1.0533 high, (2) at 1.0210 low, (3) at 1.1573 high, (4) at 1.1065 low & favors higher in (5). Within 4-hour, it placed 1 at 1.1830 high & correcting in 2 as double three correction before two more highs. It placed ((w)) at 1.1559 low in 3 swings zigzag correction. In ((w)), it ended (a) at 1.1659 low, (b) at 1.1714 high & (c) at 1.1559 low of 7.16.2025. Later, it unfolded expanded flat correction in ((x)) that ended at 1.1788 high of 7.24.2025. Within ((x)), it placed (a) at 1.1721 high, (b) at 1.1554 low & (c) in 5 swings at 1.1788 high.
Currently, it favors downside in ((y)) of 2 & expect sideways to lower in to support zone. It favors zigzag correction lower in ((y)) to finish 2 into extreme area before resume rally. Short term, it favors downside in (a) of ((y)) since 7.24.2025 high. In (a), it placed i at 1.1700 low, ii at 1.1771 high & favors downside in iii of (a) towards 1.1576 – 1.1569 area before bounce in iv. It expects a bounce soon in iv followed by one more push lower in v to finish (a) in 5 swings. Wave (a) of ((w)) should end near 1.1578 before bounce in (b) in 3 or 7 swings connector. The bounce in (b) should fail below 1.1788 high to extend lower in (c) into 1.1512 – 1.1340 area to finish correction. It should find next support into that area to rally higher as the part of daily sequence targeting 1.1929 or higher. We like to buy in to that area for next leg higher or at least 3 swings bounce. If it breaks above 7.01.2025 high, it expects two more highs to finish cycle from January-2025 before next pullback start.
ETH eyes on $3431.83: Golden Genesis fib may END this SurgeETH finally got a surge after a long consolidation.
But has just hit a Golden Genesis fib at $3431.83
Like hitting a brick wall, it is now staggering back.
It is PROBABLE that we orbit this fib a few times.
It is POSSIBLE that we reject here to end the surge.
It is PLAUSIBLE that we Break-n-Retest to continue.
We were here at this EXACT spot 8 months ago:
=============================================
.

DKS watch $170-172: Major Support that could mark a BottomDKS earnings report apparently disappointed.
Fell into a major support zone $170.01-172.12
Looking for a bounce to long or break to short.
.
Last Plot with a Perfect Road Map
=================================================
