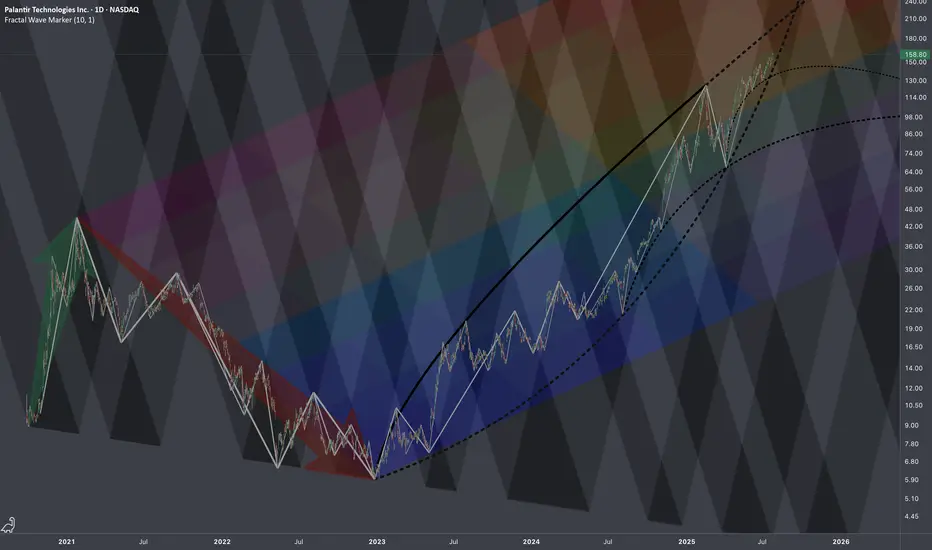
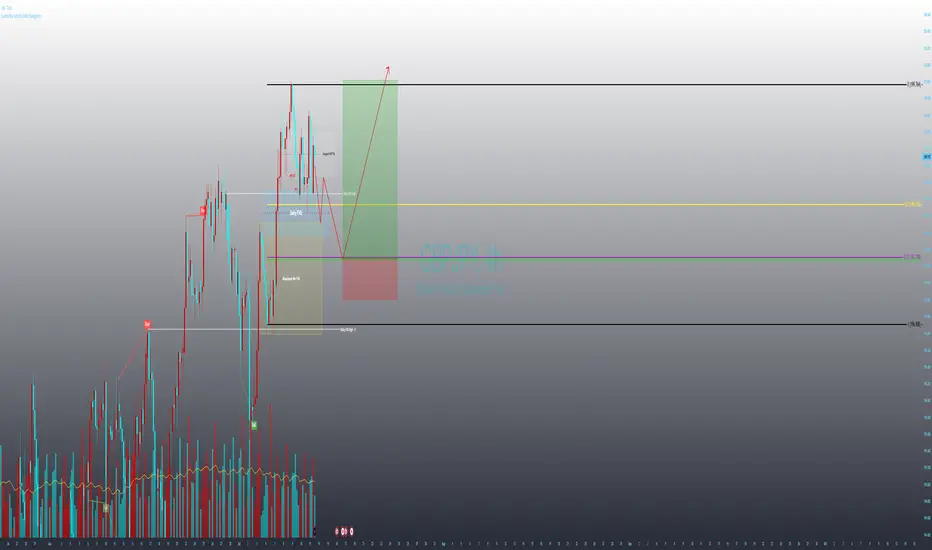
$PLTR: Regressive Heatmap🏛️ Research Notes
Technically this looks overbought, but fundamentally we know that under current administration this company is clear beneficiary (new contracts). Seems to explain why chart's dips were bought off extending bullish phases of cycle. However, there is still always a limit (as price keeps moving up, it alters the chances and magnitude of counter-move). Therefore, I'll test how wide range of 2021-2022yrs drop (prev cycle) can define the bullrun of current cycle. I'd say the very fact of anchoring the structure to actual chart points inherits its texture in next series of fractal based fib ratios.
All observed key coordinates build up into the following cross-cycle interconnections:
Fibonacci
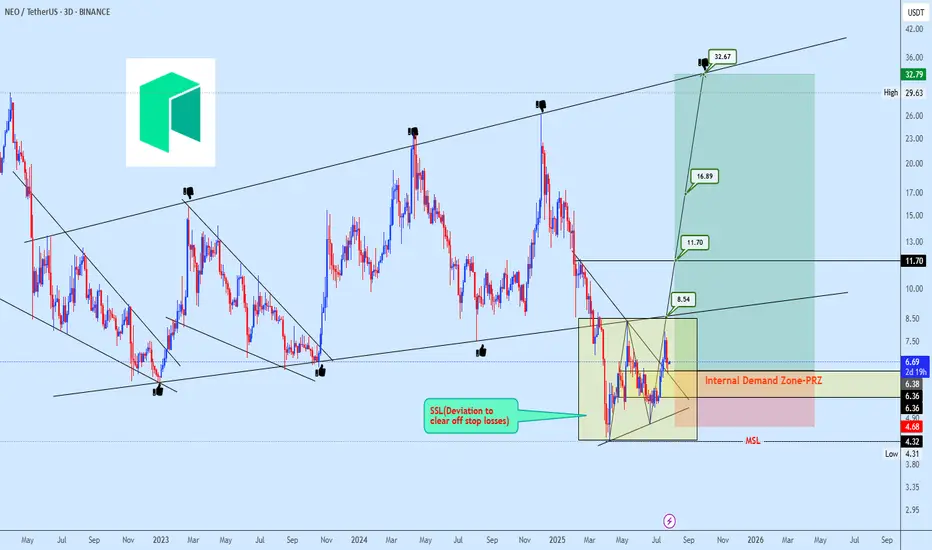
NEOUSDT Accumulation in Progress After Strategic Stop-Loss SweepNEOUSDT broke below its micro ascending broadening structure in what appears to be a strategic deviation to trigger stop-loss liquidity. Following this flush, price action has settled into a brief consolidation phase, often indicative of underlying bearish weakness losing momentum.
Our focus shifts to the internal demand zone, which is currently acting as a strong platform for accumulation. With price reclaiming the prior range low and reacting positively from the projected reversal zone (PRZ), we are positioning for a potential multi-leg bullish expansion.
Targets are projected at 8.54 → 11.70 → 16.89, with a final extension towards 32.67, aligning with the macro channel resistance.
Risk is clearly defined below 4.68, which serves as invalidation of this bullish view.
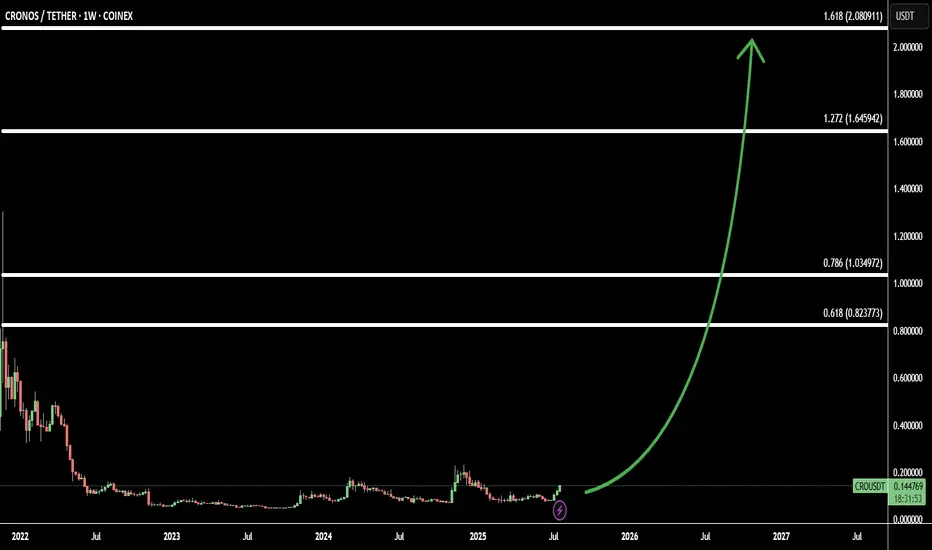
CRO Signals Big Move: 3 Soldiers Pattern + 4 Fibonacci Target(CRO/USDT) is showing a strong bullish reversal on the chart, forming the classic Three White Soldiers pattern — a powerful signal of trend reversal and sustained momentum.
This move comes after a prolonged consolidation phase, making CRO an ideal low-capital investment with the potential for a high reward.
Using Fibonacci extensions, I’ve identified 4 bullish targets:
Target 1: 0.618 Fib – 0.82 - confirmation of trend shift
Target 2: 0.786 Fib – 1.03 - key resistance zone
Target 3: 1.272 Fib – 1.64 - major breakout level
Target 4: 1.618 Fib – 2.08 - full bullish potential zone
With technicals and sentiment aligning, CRO may be gearing up for a big move, and current prices offer one of the best risk-reward opportunities in the market.
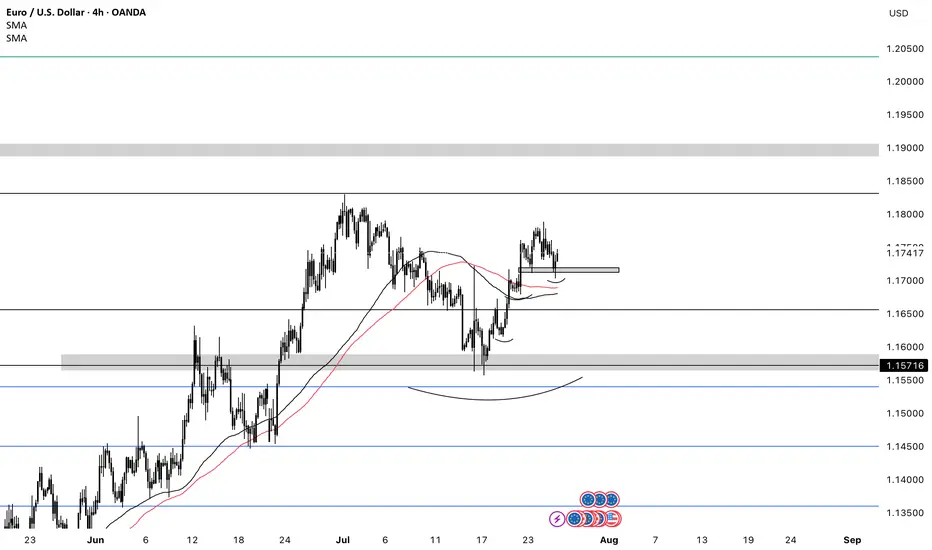
EURUSD BUYSEU is bullish. It has been consistently making HHs & HLs. I’d look for price to push towards the daily resistance @ 1.83000 then I’d look for price to push towards 1.19000.
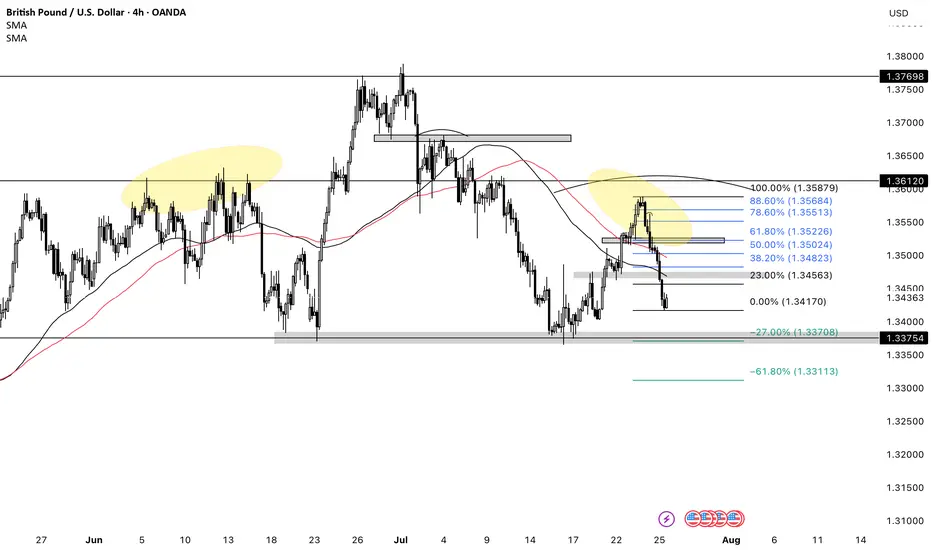
GBPUSD SHORTSPrice closed the week bearish. There’s a daily head and shoulders pattern as well. Looking for price to continue bearish towards daily support. I’d like for price to retrace and create a LH before looking to get back into shorts.
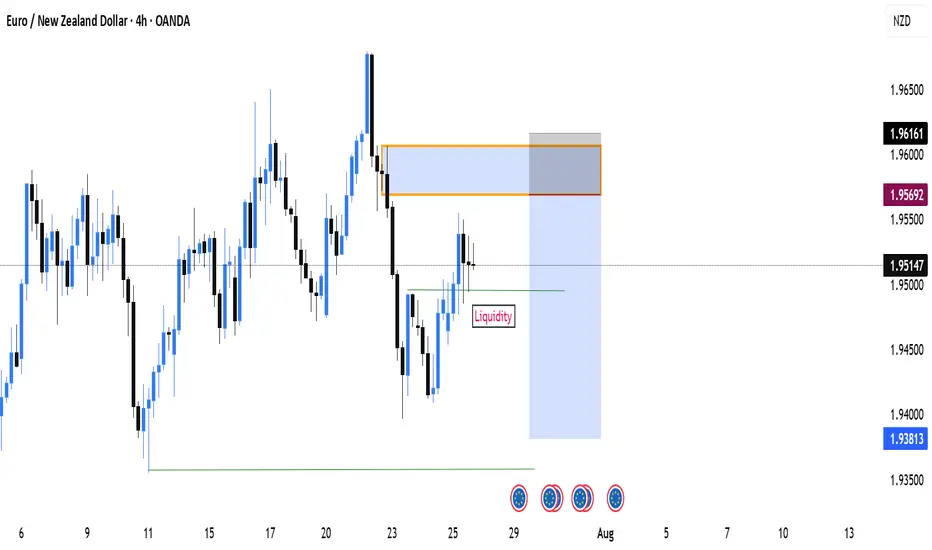
EURNZD ShortAfter a recent Market Structure Shift (MSS) signaling a bearish direction, I'm looking to short at 1.95692. The supply zone aligns perfectly with the 61.8% retracement level, and there's a potential liquidity/inducement level forming, adding confluence to the trade.
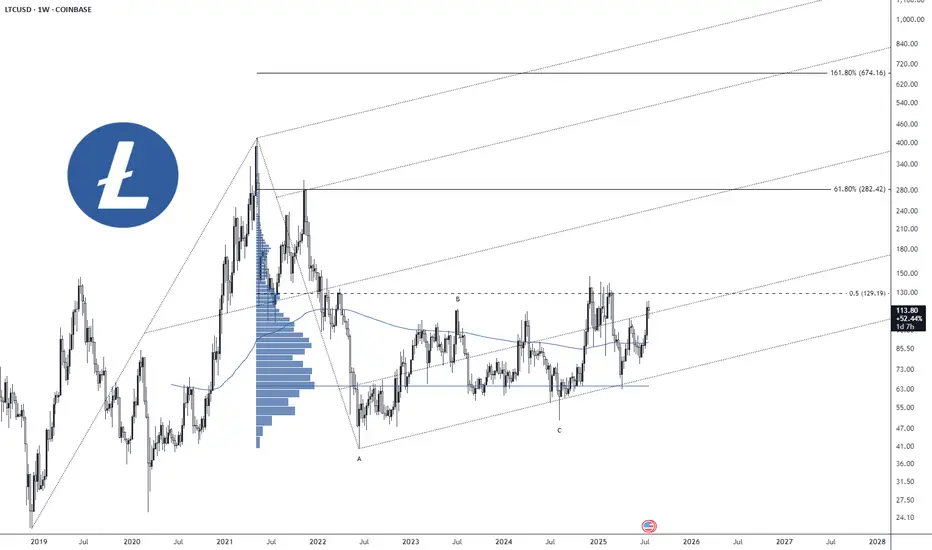
Litecoin is Lagging.Company held Litecoin is emerging, we're only getting started. Arriba.
P.S. ETF deadline on August 4th, 2025.
CRYPTOCAP:LTC $113.80
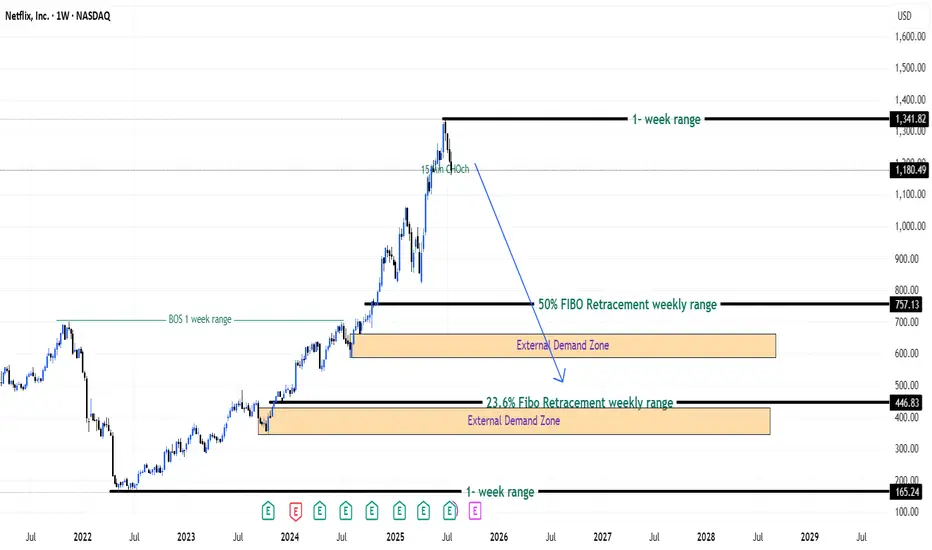
Bulls Quit? Bears Ready! - Netflix Stock (USA) - {27/07/2025}Educational Analysis says that Netflix (USA Stock) may give trend Trading opportunities from this range, according to my technical analysis.
Broker - NA
So, my analysis is based on a top-down approach from weekly to trend range to internal trend range.
So my analysis comprises of two structures: 1) Break of structure on weekly range and 2) Trading Range to fill the remaining fair value gap
Let's see what this Stock brings to the table for us in the future.
DISCLAIMER:-
This is not an entry signal. THIS IS FOR EDUCATIONAL PURPOSES ONLY.
I HAVE NO CONCERNS WITH YOUR PROFITS OR LOSS,
Happy Trading,
Stocks & Commodities TradeAnalysis.
My Analysis is:-
Short term trend may be go to the external demand zone.
Long term trend breaks the new high after going from discount zone.
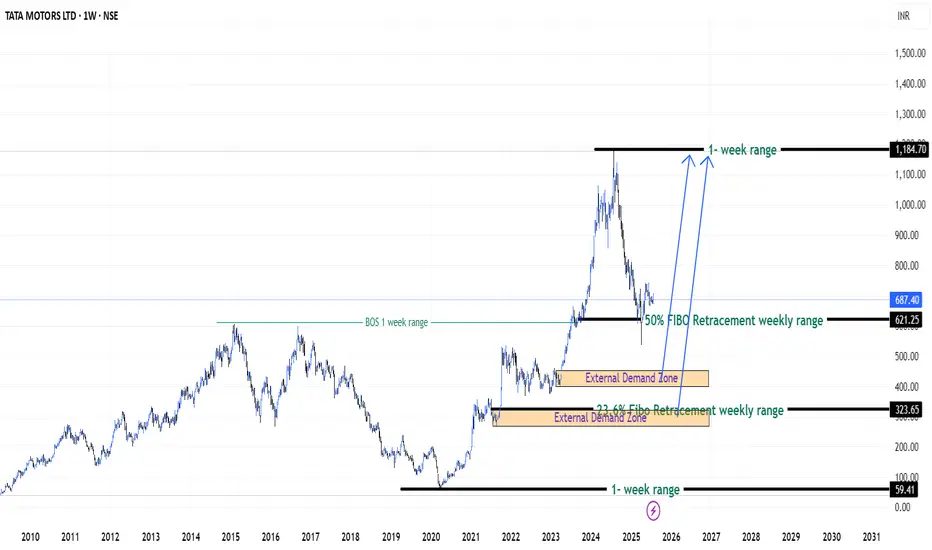
Patience on Tata Motors Stock (India) - {27/07/2025}Educational Analysis says that Tata Motors (Indian Stock) may give trend Trading opportunities from this range, according to my technical analysis.
Broker - NA
So, my analysis is based on a top-down approach from weekly to trend range to internal trend range.
So my analysis comprises of two structures: 1) Break of structure on weekly range and 2) Trading Range to fill the remaining fair value gap
Let's see what this Stock brings to the table for us in the future.
DISCLAIMER:-
This is not an entry signal. THIS IS FOR EDUCATIONAL PURPOSES ONLY.
I HAVE NO CONCERNS WITH YOUR PROFITS OR LOSS,
Happy Trading,
Stocks & Commodities TradeAnalysis.
My Analysis is:-
Short term trend may be go to the external demand zone.
Long term trend breaks the new high after going from discount zone.
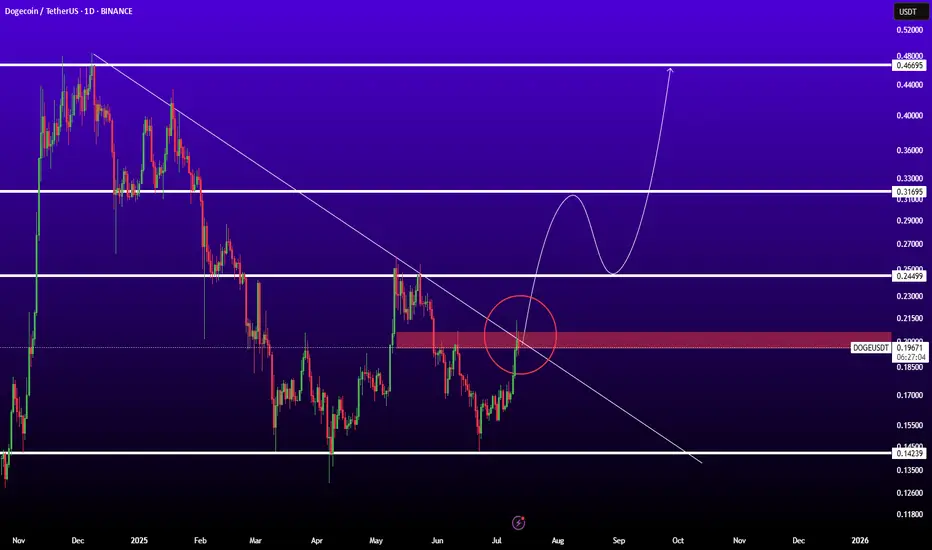
DOGEUSDTBINANCE:DOGEUSDT is in good level for pump because if breaked trendline and resistance 0.200$ ready for sharp movement to next levels.
Resistances: 0.25 - 0.32 - 0.45
Support: 0.15
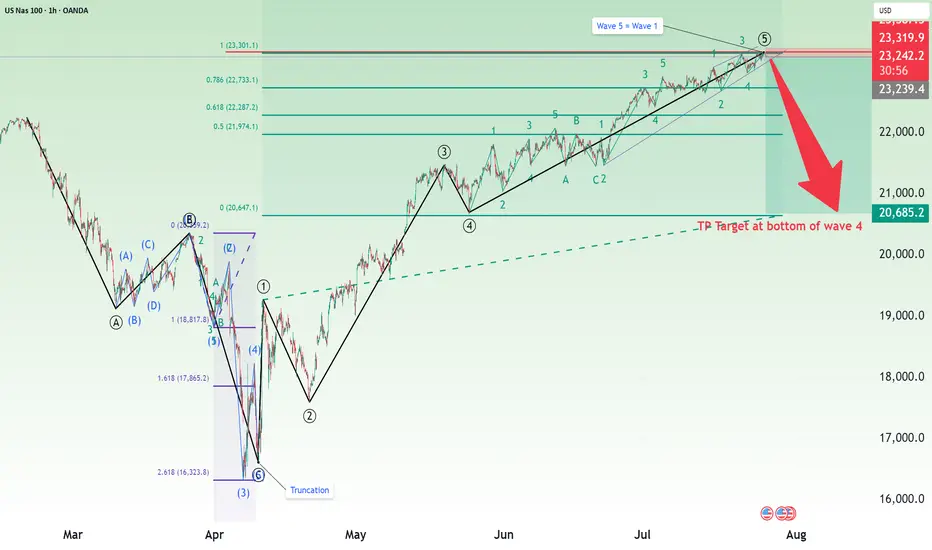
Nasdaq Short: Completion of 5 waves with wave 5=wave 1Over here, I present a short case for Nasdaq (and S&P500 by default since their correlations are high). The main reasons are:
1. Completion of 5 waves structure both on the high degree and on low degree, as shown in the chart.
2. Fibonacci measurement where wave 1 = wave 5.
The stop of this idea is to be placed slightly above the high, in this case, I placed it at around 23320. The take profit target is at the bottom of primary wave 4, around 20685.
Take note that this is a positional short, meaning the strategy is to short and hold and periodically adjust your stop loss based on unfolding on wave structure. Sizing is based on your risk tolerance.
Good luck!
Guppy - Long TradeExpecting a bearish move down and then a strong reversal at the levels displayed!
Happy Trading!
Bitcoin Long: Completion of Sub-wave 4, riding wave 5I updated the Elliott Wave counts for Bitcoin and we should have completed sub-wave 4 and is currently onto sub-wave 5. Based on my counts, sub-wave 3 has extended and is slightly more than 1.618x of wave 1, thus I expect sub-wave 5 to NOT extend. Based on Fibonacci extensions, the price target is around $124,600.
The stop loss for this idea is around $114,600.
Towards to end of the video, I zoomed out for Bitcoin and observed that Cycle level wave 1 and 3 are HUGE (red font) and the current Cycle Wave 5 looks too small. Thus, the entire 5-wave structure of what we are going through now may be just a Sub-Wave 1 of Cycle Wave 5. And that means that longer-term, Bitcoin may really go to $200,000 and beyond. But for traders, keep our foot on the ground and trade what is in front of us.
Good luck!

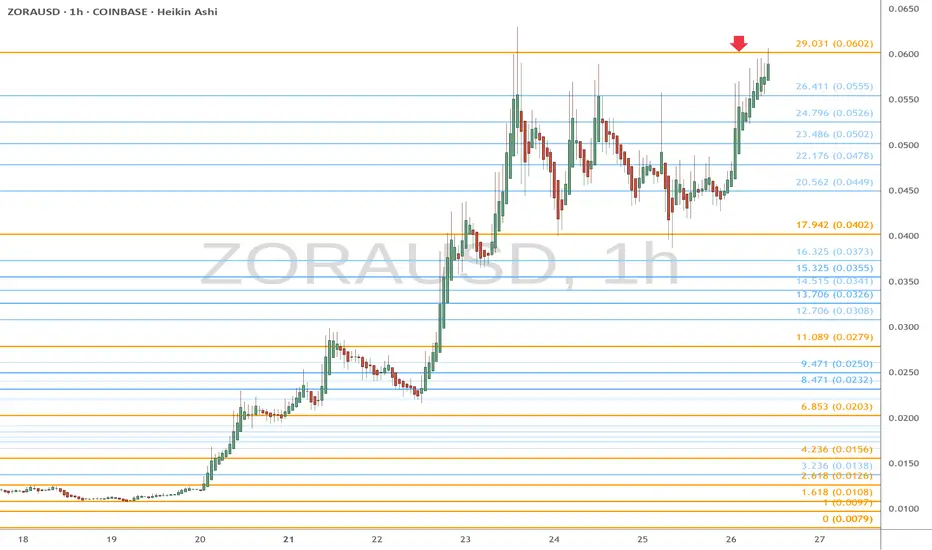
ZORA.usd eyes on 6 cents: Golden Genesis fib a TOP or RELOAD? ZORA has been flying since Coinbase integration.
Currently range bound by Goldens at 4 and 6 cents.
Look for a Rejection-Short or Break-n-Retest for longs.
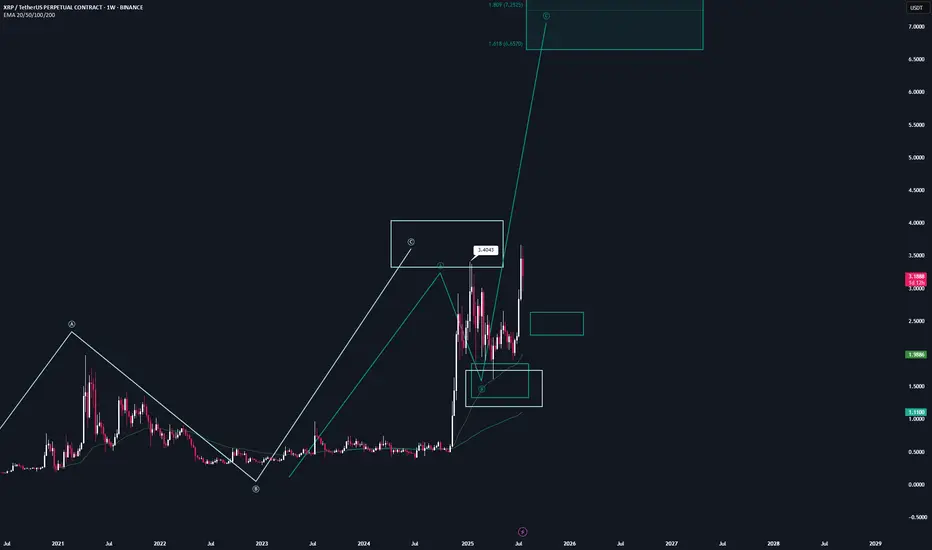
XRP | Full AnalysisHere is the full analysis for CRYPTOCAP:XRP as requested 🫡
Let’s start with the weekly timeframe:
With the recent breakout above the $3.40 high, we’ve activated a new, larger bullish sequence on the weekly chart. This sequence has its target region between $6.57 and $7.84, which I believe we will reach at minimum during this bull run.
From now on, every pullback into the B-C correction area (turquoise) can be considered a legitimate re-entry opportunity.
Daily chart:
We successfully broke the all-time high with another breakout sequence (orange), which has already completed its target region.
Now, we’re trading the overall correction level — this is the same area as the B-C correction area from the weekly timeframe. It’s the Fibonacci retracement drawn from the start of the move to point C.
Local Price Action:
After reaching the target zone (orange), we activated a new bearish sequence in the upper region, which has just completed its target zone.
Now we expect a move back into the overall correction level (blue), and after that, according to the rulebook, the next legitimate U-turn could follow.
It gets really interesting if we enter the overall correction level and then start forming a bearish structure on the lower timeframes — this is where we can apply a multi-timeframe approach, which significantly increases the probability of a successful trade.
-----
Thats the my full Analysis for CRYPTOCAP:XRP , hope it was helpful if you want me to do another analysis for any other pair just comment down below.
Also, if anyone is interested in how my trading system works, let me know and I’ll post some educational content about it.
Thanks for reading❤️
SharpLink Eyes 1M ETH Goal After $145M Deal as ETH Targets $4KIn a move that’s set to reshape the intersection of digital assets and sports betting, SharpLink Gaming Ltd. has announced a landmark $145 million acquisition of a global data and analytics firm, with the explicit goal of accumulating 1 million ETH over the next 24 months. The deal underscores growing institutional interest in Ethereum as a digital commodity, and may catalyze upward momentum as ETH inches toward the $4,000 psychological resistance level.
SharpLink, a technology company specializing in real-time conversion tools for online betting platforms, sees Ethereum not only as an asset but as a strategic reserve and infrastructure layer for future blockchain-native products in sports engagement.
ETH as a Strategic Reserve Asset
According to sources close to the deal, the target firm will integrate its decentralized transaction engine directly onto Ethereum Layer 2, allowing near-instant settlement for in-app microtransactions and loyalty systems. SharpLink executives confirmed that part of the transaction includes an ETH-based performance clause, further tying company equity to the appreciation of Ethereum itself.
“Ethereum is not just a vehicle for holding value—it’s a programmable platform that enables the gamification of loyalty, rewards, and even prediction markets,” said Robert Wheeler, CFO at SharpLink. “Our 1 million ETH target is a long-term bet on infrastructure, not speculation.”
Institutional Flows Signal Confidence
The acquisition comes amid surging Ethereum ETF inflows, with U.S.-based funds seeing over $453 million in net capital in July alone. As institutional allocations deepen, Ethereum’s price has responded, currently trading at around $3,730, up nearly 18% month-over-month.
Analysts believe that a clean break above $4,000 could lead to an accelerated rally toward new cycle highs, especially with the anticipated rollout of EIP-7623, a scaling-focused upgrade designed to enhance Layer 2 throughput.
Industry Implications
SharpLink’s strategy mirrors a broader trend where companies are building Ethereum exposure directly into corporate structure, treating ETH as both capital and infrastructure. This hybrid approach reflects a shift from speculative crypto adoption to utility-based asset management.
“It’s a new model of treasury allocation,” noted Mia Langston, digital finance strategist at Veridian Global. “They’re not just holding ETH as a hedge—they’re deploying it across services.”
Conclusion
With Ethereum’s fundamentals strengthening, growing ETF demand, and now a $145M acquisition tied directly to ETH accumulation, SharpLink’s move may serve as a case study in the next phase of corporate crypto strategy.
If ETH breaches $4,000 in the coming weeks, the company’s early positioning could prove prescient—and possibly spark similar strategic moves across sectors beyond crypto.

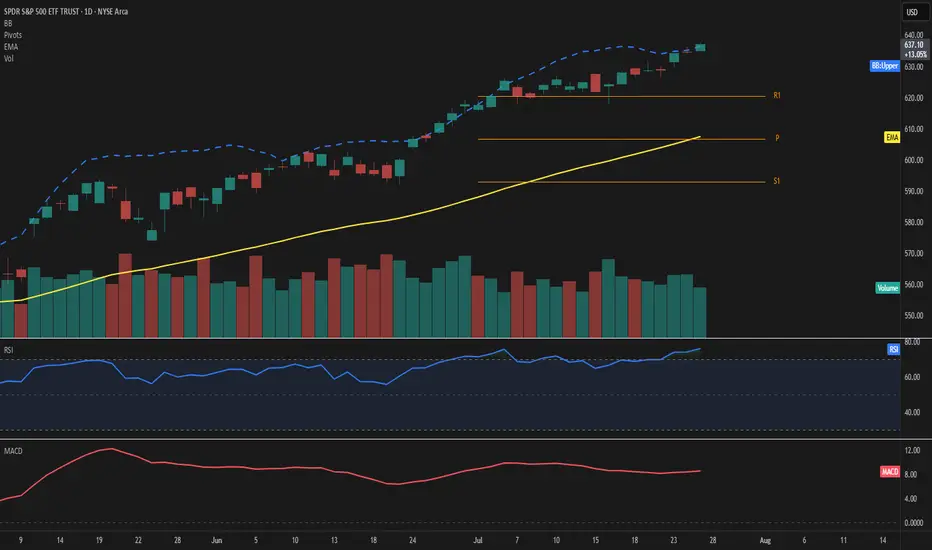
SPY – Explosive strength above resistancePrice extends well above the 50-day EMA and pierces through the upper Bollinger Band, highlighting strong bullish momentum. RSI stands at 76, confirming overbought conditions, while MACD remains firmly positive.
The ongoing move leaves the EMA50 at 608 and the Fibonacci pivot at 607—both now acting as key support levels. With R1 at 620 already surpassed, the next potential resistance zone lies in uncharted territory beyond 636.
Volume has decreased by over 20%, which tempers the move slightly and should be monitored closely.
As long as price holds above 620, the bullish scenario remains valid.
Watch for any sudden spike in volume or a drop back below 636 as a possible shift signal.
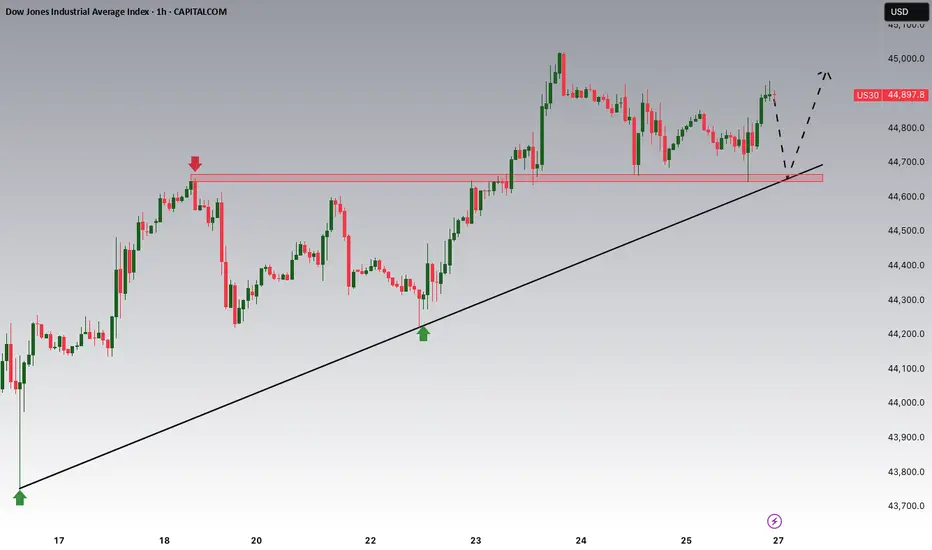
Dow Jones Potential UpsidesHey Traders, in the coming week we are monitoring US30 for a buying opportunity around 44,650 zone, Dow Jones is trading in an uptrend and currently is in a correction phase in which it is approaching the trend at 44,650 support and resistance area.
Trade safe, Joe.
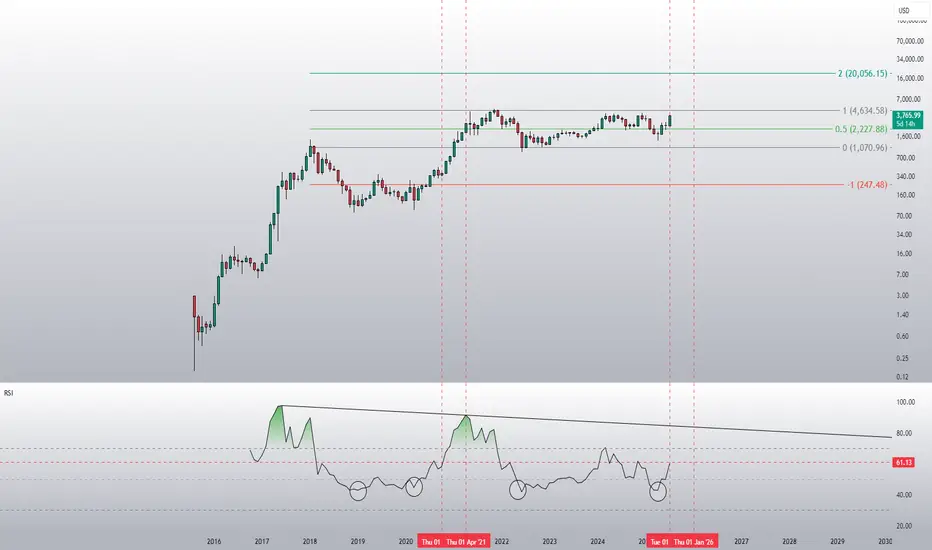
ETH is about to go parabolicDid people realise that Ethereum hit its historical lows on the monthly RSI in April this year? Some people are laughing at the idea of a target of 20k this year, but that would only represent a 20x increase from 2022 to 2025. In contrast, Ethereum achieved a 60x increase from 2018 to 2021.
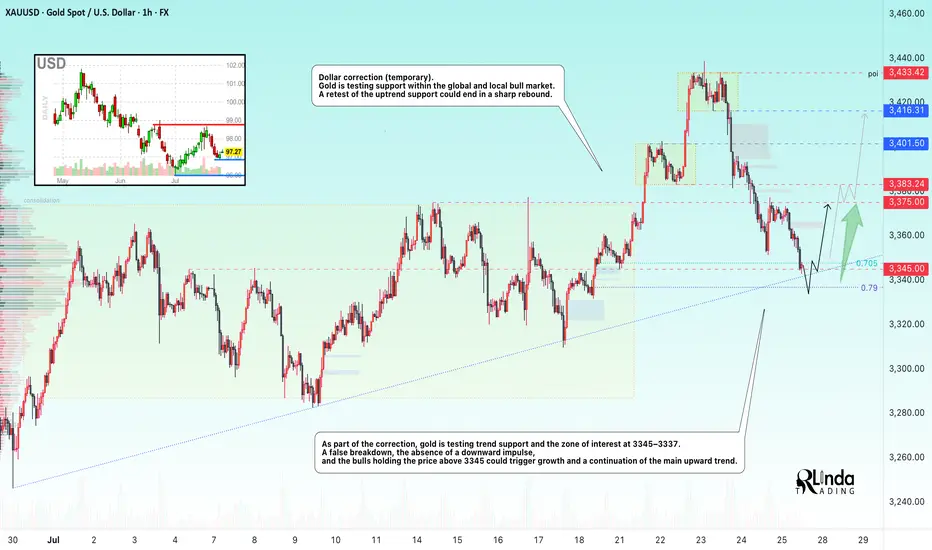
GOLD → Countertrend correction, retest of 3345 before growthFX:XAUUSD , undergoing a deep correction after a false breakout of local resistance at 3433, has reached the support of the upward trend. Will the bulls be able to maintain the trend?
Gold held below $3,400 on Friday, rebounding from $3,350, and is poised to end the week higher. Investors are watching the conflict between Thailand and Cambodia, which is boosting demand for safe-haven assets, and are also awaiting decisions from the Fed and the Bank of Japan next week. The markets received additional support from US trade deals with Asian countries and progress in negotiations with the EU, easing fears of a tariff war.
As part of the correction, gold is testing trend support and the 3345-3337 zone of interest. A false breakdown, lack of downward momentum, and bulls holding prices above 3345 could trigger growth and a continuation of the main upward trend.
Resistance levels: 3375, 3383
Support levels: 3345, 3337, 3330
Technically, the support level of 3345 plays a fairly important role in the market. If, during the correction, the bulls manage to hold their ground above this zone, the prospects for recovery will be high, especially against the backdrop of geopolitical problems.
Best regards, R. Linda!
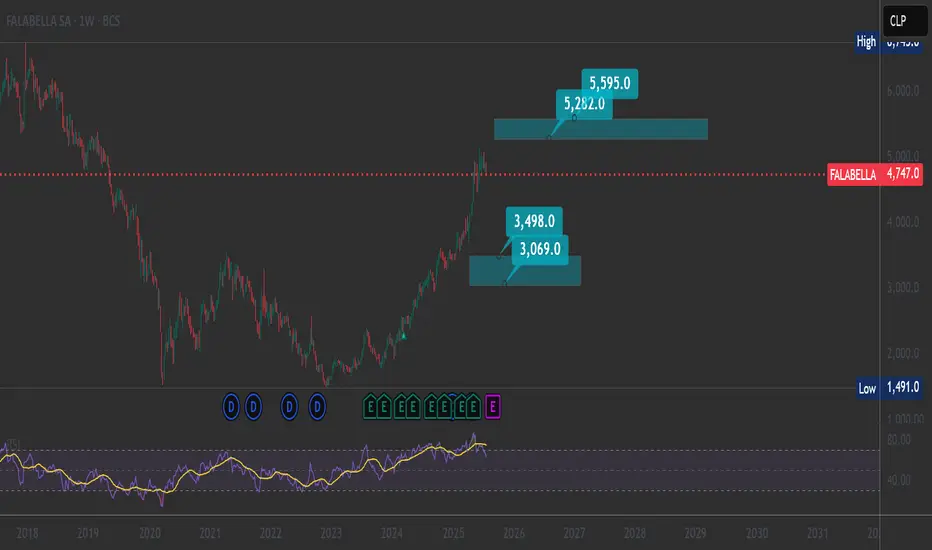
New Target Prices for FALABELLA S.A.ENG
Market targets and debts already given upwards in BCS:FALABELLA
With this upward movement, debts are confirmed by a reverse wave on a monthly/weekly timescale.
Bearish debts at:
3069
3498
We can use these prices as new buying zones if we want to look for bullish debts at:
5282
5595
_________________________________________________________________
GBPUSD → Retest of previously broken resistance...FX:GBPUSD has entered a correction phase after breaking through the local downtrend. If the price remains in the 1.3450–1.346 zone, this will confirm the formation of a new trading range...
The market is entering a correction phase due to the dollar. A countertrend retest of the support zone is forming. Earlier, the currency pair broke the local trend and is entering a flat phase. The retest of support may end with a recovery. If, within the local movement and after a false breakout of the 1.345 - 1.3467 zone, the bulls keep the price above the buying zone, then in the short and medium term, we can expect growth to continue.
Support levels: 1.3467, 1.345
Resistance levels: 1.35, 1.3584
A false breakdown of support at 1.3467 will confirm a change in the local trend (correction). The market may return to the recovery phase of the global trend.
Best regards, R. Linda!

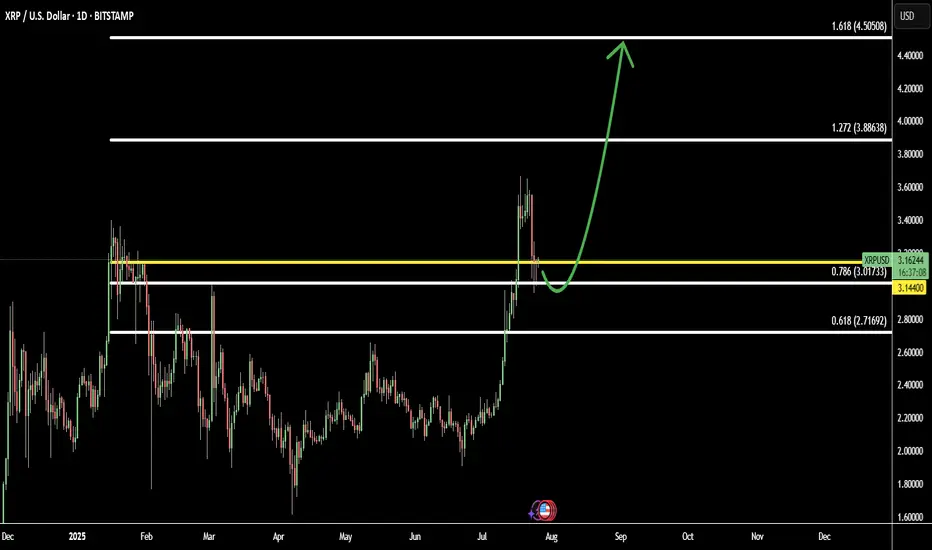
XRP Pullback Complete: Bulls Step In Toward Fibonacci TargetsAfter a healthy pullback, XRP (XRPUSD) is showing signs of renewed strength as new buyers re-enter the market. This correction phase appears to have attracted smart money, setting the stage for the next bullish leg.
The chart structure suggests XRP is now in a re-accumulation phase, with price aiming for mid-term Fibonacci targets:
Target 1: 1.272 Fib – 3.88 - continuation zone after breakout
Target 2: 1.618 Fib – 4.50 - strong extension level aligned with prior highs
If momentum holds and volume builds, XRP may resume its upward trajectory toward these targets in the coming weeks.