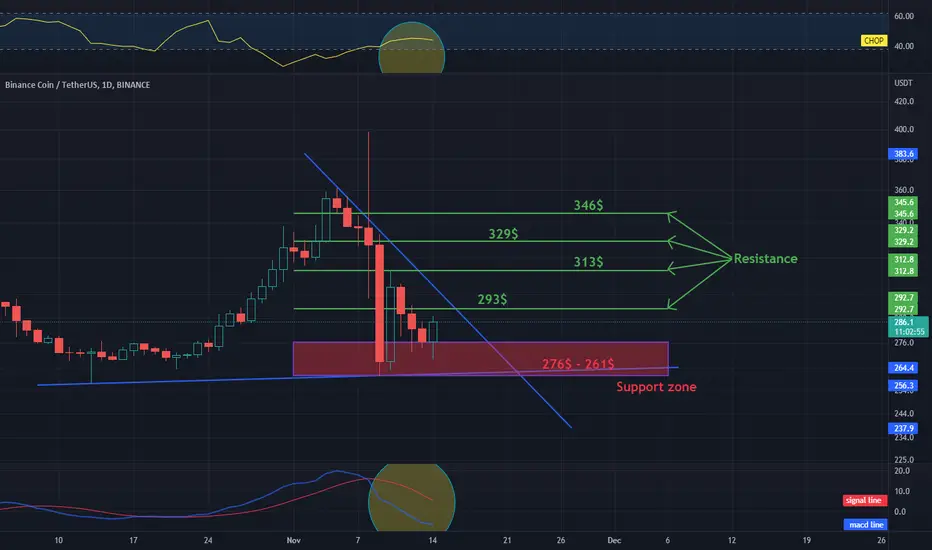
BNB / USDT 1D INTERVAL, Support and ResistanceI invite you to the BNB chart, just like its predecessors, on a 1-day interval. As we can see, the BNB price is moving in a triangle marked with blue lines.
At the beginning, it is worth checking what support BNB has on its way when the price of the token starts to fall again and so we see that in the first place we have a strong resistance zone that starts at $ 276 and ends around $ 261, this is an important zone that already previously held the price.
Now let's move on to the resistance line, as you can see the first resistance that the price has to face is $293, only when we manage to overcome it upwards we can move towards the next resistances at $313, the next at $329 and $346.
Let's now pay attention to the CHOP index, where you can see that the energy is growing very slowly, while the MACD indicator on the one-day interval indicates a downward trend.
Fibonaccianalysis
Daily review of ETH interval 1DHello everyone, let's look at the ETH to USDT chart on a one-day timeframe. As you can see, the price is moving in a triangle marked with blue lines.
Let's start with the support line and as you can see the first support in the near future is $1209, if the support is broken then the next support is $1119 and $1046.
Now let's go from the resistance line, as you can see the first resistance is $1275, if you manage to break it, the next resistance will be $1310, $1342 and $1388.
Looking at the CHOP indicator, we see that the energy is exhausted on the one-day timeframe, and the MACD indicator indicates a downtrend.

Daily review of BTC interval 4HHello everyone, let's look at the BTC to USDT chart on a 4-hour timeframe. As you can see, the price is moving below the local downtrend line.
Let's start with setting the support and as you can see the first support is the zone from $16780 to $15925, if the support is broken then the next support is $15233.
Now let's go from the resistance line, as you can see the first resistance is $16995, if you manage to break it, the next resistance will be $17376, $17862 and $17994.
Looking at the CHOP indicator, we see that in the 4-hour interval we have a lot of energy for the next move, and the MACD indicator indicates that we are close to entering a downtrend.

CHZUSDT 1WInterval - Targets and StoplossHello everyone, let's look at the 1W CHZ to USDT chart as you can see that the price is moving above the local uptrend line.
Let's start by setting goals for the near future that we can take into account:
T1 = $0.208
T2 = $0.237
T3 = $0.279
T4 = $0.335
and
T5 = $0.488
Now let's move on to the stop loss in case the market goes down further:
SL1 = $0.192
SL2 = $0.163
and
SL3 = $0.103
Looking at the CHOP indicator, we see that on the 1W interval, I have a lot of energy for subsequent moves, and the MACD indicator indicates that we are in a downtrend.

Great fear on the CRO token !!!Hello everyone, let's look at the 4H CRO to USDT chart as you can see that the price is moving in the downtrend channel.
Let's start by setting goals for the near future that we can take into account:
T1 - $0.0725
T2 - $0.0773
T3 - $0.0819
T4 - $0.0862
and
T5 - $0.0917
Now let's move on to the stop loss in case the market goes down further:
SL1 - $0.0604
and
SL2 - $0.0501
Looking at the CHOP indicator, we see that the energy has been used up on the 4H interval, and the MACD indicator indicates a local downtrend.

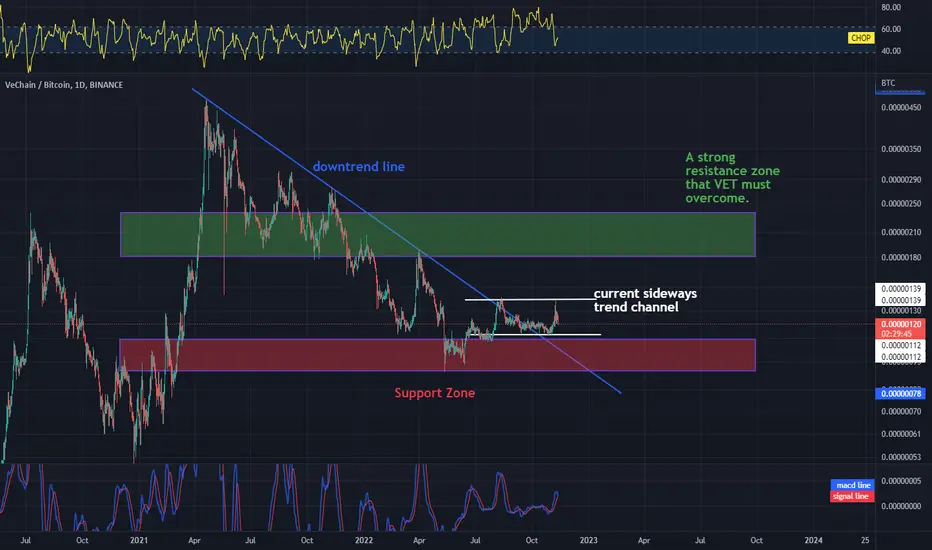
VET / BTC 1Day IntervalAs you can see, VET in comparison to BTC is moving above the support zone, which has already defended the price against further declines.
We are currently moving in a local sideways trend channel, which can be used for short-term plays.
If the price starts to rise, it has a strong resistance zone from 181 to 237 satoshi on its way.
Daily review of BTC interval 4HHello everyone, let's look at the BTC to USDT chart on a 4-hour timeframe. As you can see, the price has left the triangle sideways and is currently just above the local uptrend line.
Let's start with the support line and as you can see the first support in the near future is $16727, if the support is broken then the next support is $16451, $16234 and $16015.
Now let's move on to the resistance line, as you can see the first resistance the price is currently fighting is $16967, if you manage to break it the next resistance will be $17352, $17649 and $17964.
Looking at the CHOP indicator, we see that in the 4-hour interval we have a lot of energy for the next move, while the MACD indicator indicates that the blue line is above the red one, which confirms the maintenance of the local uptrend.

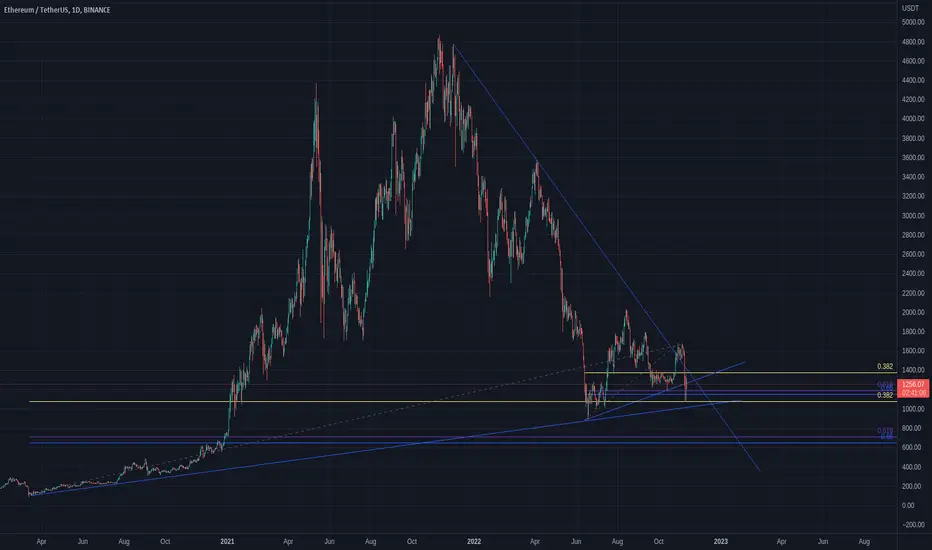
ETHUSDT - Monthly - Trend Lines & Fibs - Current Range Very interesting chart at the moment - Has ETH formed a channel (range) between the two 0.382 fibs? ETH/BTC note: Double top and possible Bullish Gartley formation one to keep an eye out for in support of trading analysis.
BTC/USDT - Monthly - Head & Shoulders and Fib RetracementHead and shoulders from neckline down to fib retracement 0.618

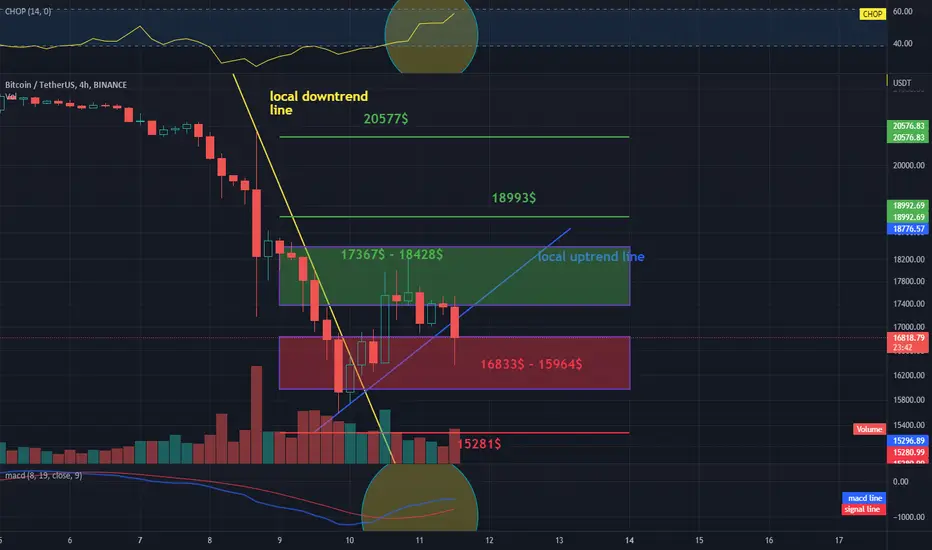
DailHello everyone, I invite you to the 4H BTC to USDT Chart Review.
We are seeing dynamic changes in the direction in which price is moving. The price descended quickly below the downtrend line, there would be a breakout, and we dropped again below the local uptrend line.
Now let's move on to determining the support and as you can see, we have a strong support zone from $ 16833 to $ 15964 in the first place, if the support is broken, the next support is at $ 15281.
We will also check what resistance BTC has to overcome to keep growing, first we have a strong resistance zone from $ 17367 to $ 18428, we have to overcome the resistance at $ 18993, only breaking this resistance will open the way back to $ 20,577.
As you can see, the CHOP index shows that we have a lot of energy, and the MACD indicator shows a local upward trend. Looking at the volume, we can see that the sellers have an advantage.
ETH - USDT, 1D Interval Resistance and Support I invite you to discuss the behavior on the ETH versus USDT chart. We can see that the price from June to September moved above the uptrend line, which we left the bottom on September 18, moving in the downtrend channel marked by blue lines.
Despite this, the price of XRP came up from this channel, after negative news about the FTX exchange, it dived quickly and returned to the downward channel.
In recent days, the price has moved above the local uptrend line, but now it has to overcome the downward trend in order to return above it.
Now, with the help of the Fibonache tool, we will mark the support zones for the XRP price, and as you can see, we have a support zone from one thousand three hundred twenty six dollars to one thousand one hundred thirty five dollars where the price is currently located, then we have support lines at a price of eight hundred eighty five dollars.
We can also check that a strong resistance zone, when the price starts to rise, we have from one thousand six hundred and seventy-four dollars to one thousand eight hundred and thirty-five dollars, but before that we have to overcome two places of resistance at one thousand five hundred and fifty-four dollars and before that, one thousand four hundred and forty-two dollars.
The CHOP index indicates that the energy is depleted on the one-day interval, the makdi indicator shows a downward trend, and on the volume we see a small red candle that says that sellers have an advantage on November 11th.

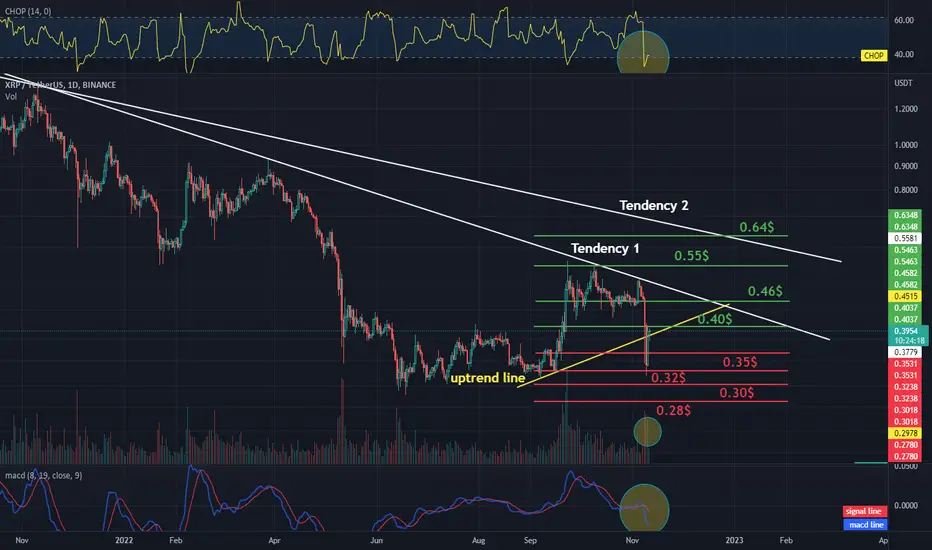
XRP / USDT 1daychartHello everyone, I invite you to review the XRPUSDT chart for one day. As we can see, the price dived strongly and quickly returned to the uptrend line.
It is worth noting that the price has two trend lines on its way that must be overcome, so we can see that XRP has already tried to overcome the first trend three times.
Now let's move on to the designation of the support line and in this situation we can see that the first support is at $ 0.35, the second at $ 0.32, the third at $ 0.30 and the fourth at $ 0.28.
Likewise, we will set the resistance lines that the price must overcome in order to continue rising. We have the first resistance at $ 0.40, the second at $ 0.46, the third at $ 0.55 and the fourth at $ 0.64.
Now let's move to the CHOP index which indicates that the energy is slowly starting to rise, on the MACD indicator we can see that on the one-day interval we are in a downward trend, and the volume shows a large green buying candle, while today the selling candle has a small advantage.
BNB / USDT 4H INTERVAL, STOPLOSS AND TARGETSHello everyone, let's take a look at the 4H BNB to USDT chart as you can see the price is moving above the local downtrend line.
Let's start by setting goals for the near future that we can consider:
T1 - $ 309
T2 - $ 317
T3 - $ 323
T4 - $ 329
and
T5 - $ 338
Now let's move on to the stop loss in case of further market declines:
SL1 - $ 289
SL2 - $ 274
SL3 - $ 262
and
SL4 - $ 250
Looking at the CHOP indicator, we can see that in the 4H interval, most of the energy was used, and the MACD indicator shows a local upward trend.

Daily review of BTC interval 4HHello everyone, let's take a look at the BTC to USDT chart over the 4 hour timeframe. As you can see, the price is moving above the local downtrend line.
Let's start with the designation of the support line and as you can see the first support in the near future is $ 16594, if the support breaks down, the next support is $ 15706, $ 14998 and $ 14321.
Now let's move to the resistance line as you can see the first resistance is $ 17688, if you can break it the next resistance will be $ 18040, $ 18343, $ 18579 and $ 19003.
Looking at the CHOP indicator, we can see that in the 4-hour interval, the energy slowly begins to rise, and the MACD indicator shows a local upward trend.

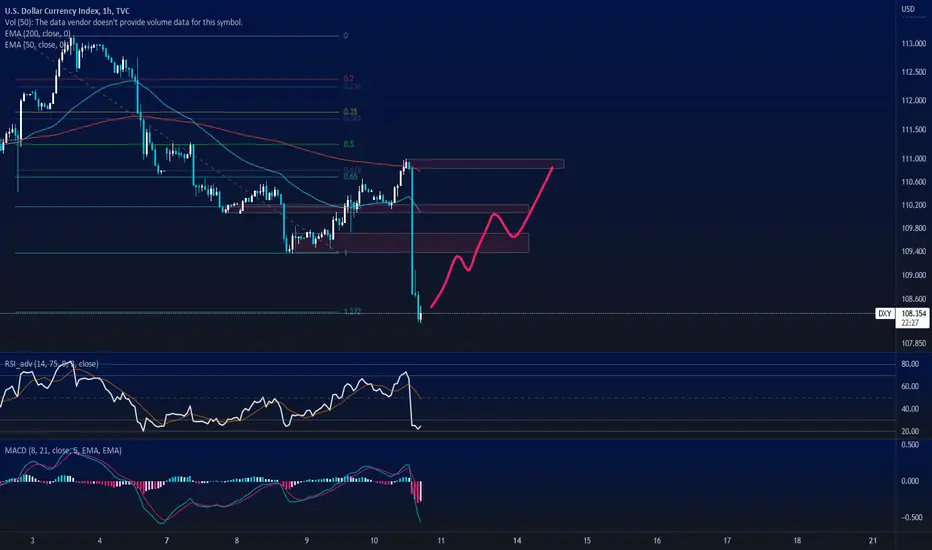
DXY about to rekt crypto? Strong downwards move after US CPI came out - which looks good and people are now expecting FED to pivot into more dovish stance. But is that really going to happen in short term?
We had a very nasty downfall in crypto markets yesterday with the whole FTX fiasco and the fear in markets is expected after that. Plus Solana unlocking 5M worth of SOL which was another catalyst for this big bang.
Now we had a very nice recovery, which might be interpreted as break-down and honestly DXY could continue to dump. Still, there is a good chance that market-makers are not done with scooping up liquidity from very bullish long traders. There is still money on the table to be taken.
Let's see if this plays out according to my plan.
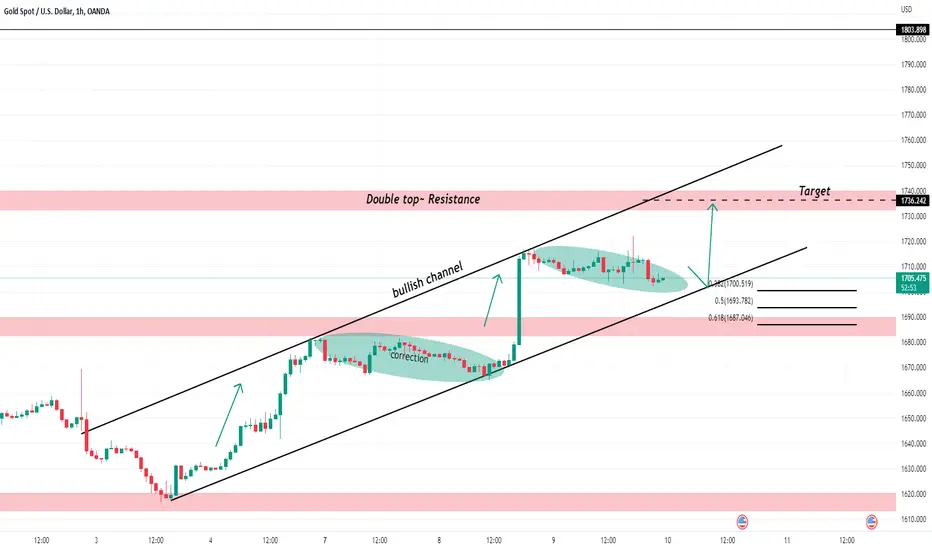
Xauusd setupwatch gold at 1700 level if a price respect this level chance to go with price to 1735 different scenario if broke the level of 1696 , please Beware the news of the cpi use risk management
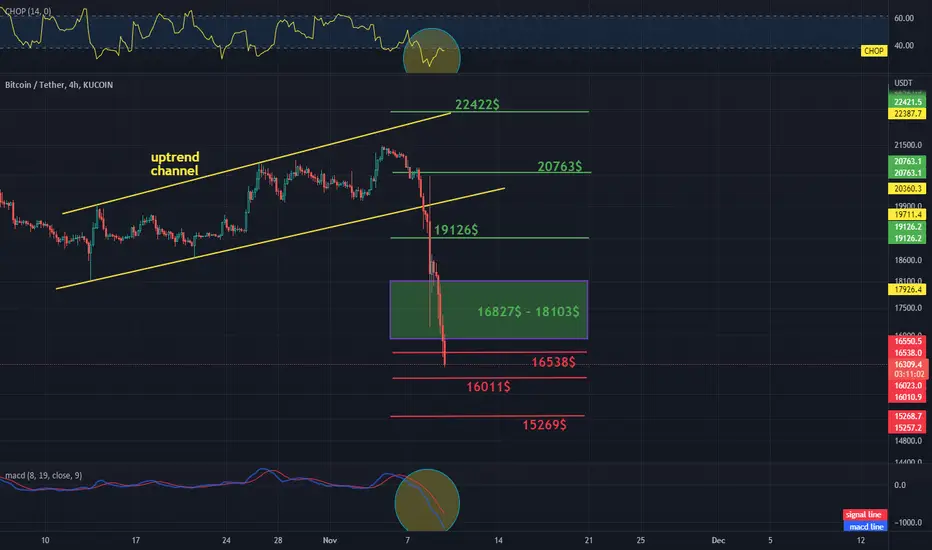
Daily review of BTC interval 4HHello everyone, let's take a look at the BTC to USDT chart over the 4 hour timeframe. As you can see, the price came down from the uptrend channel, but the current declines are mainly caused by problems of the FTX exchange.
Let's start with the designation of the support, and as you can see, the first support is at $ 16,538, if the support breaks down, the next support is $ 16,011 and $ 15,269.
Now let's move to the resistance, as you can see we first need to overcome a large resistance zone from $ 16827 to $ 18103, if the price comes out of the top, the next resistance will be $ 19,126, $ 20,763 and $ 22,422.
Looking at the CHOP indicator, we can see that in the 4-hour interval some energy is slowly starting to rise, and the MACD indicator shows a local downward trend.
CRO / USDT 4H Interval- Targets and StoplossHello everyone, let's take a look at the 4H CRO to USDT chart as you can see the price has returned to our downtrend channel.
Let's start by setting goals for the near future that we can consider:
T1 - $ 0.106
T2 - $ 0.115
T3 - $ 0.123
T4 - $ 0.129
and
T5 - $ 0.139
Now let's move on to the stop loss in case of further market declines:
SL1 - $ 0.087
SL2 - $ 0.075
and
SL3 - $ 0.061
Looking at the CHOP indicator, we can see that in the 4H range the energy has been exhausted, while the MACD indicator shows a local downward trend.

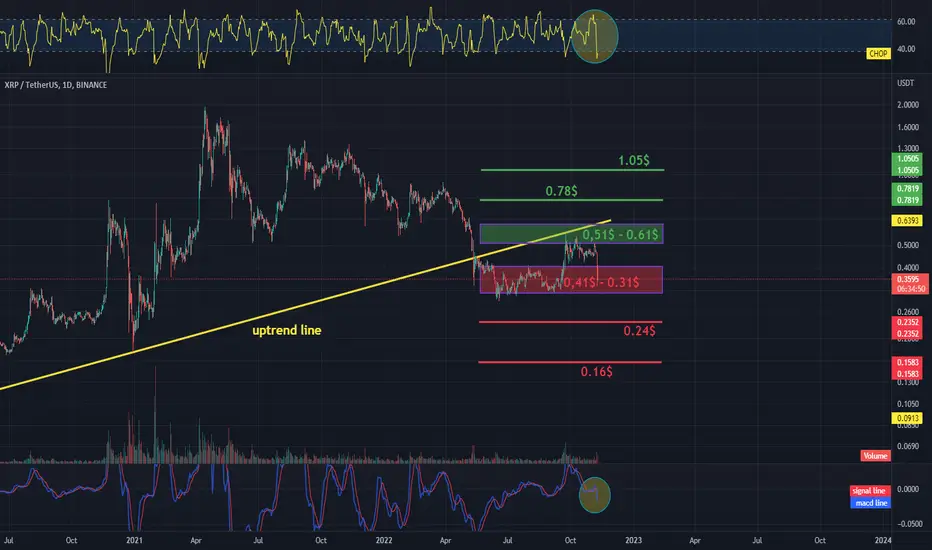
XRP / USDT 1daychartHello everyone, I invite you to review the XRP to USDT chart on a one-day interval. As you can see the price has dropped below the uptrend line.
Let's start by determining the support that XRP has in the event of further declines. First, we have a support zone from $ 0.41 to $ 0.31, if this zone is broken, the next support is at the price of $ 0.24 and $ 0.16.
Looking the other way, it is worth determining the resistance and as you can see, the first one has a resistance zone from $ 0.51 to $ 0.61, when it is overcome, the next resistance is at the price of $ 0.78 and $ 1.05.
Let's take a look at the CHOP index which indicates that energy has been used up, and the MACD indicator points to a downward trend. Remember that currently the entire market is suffering and most cryptocurrencies have declines of around 30%.
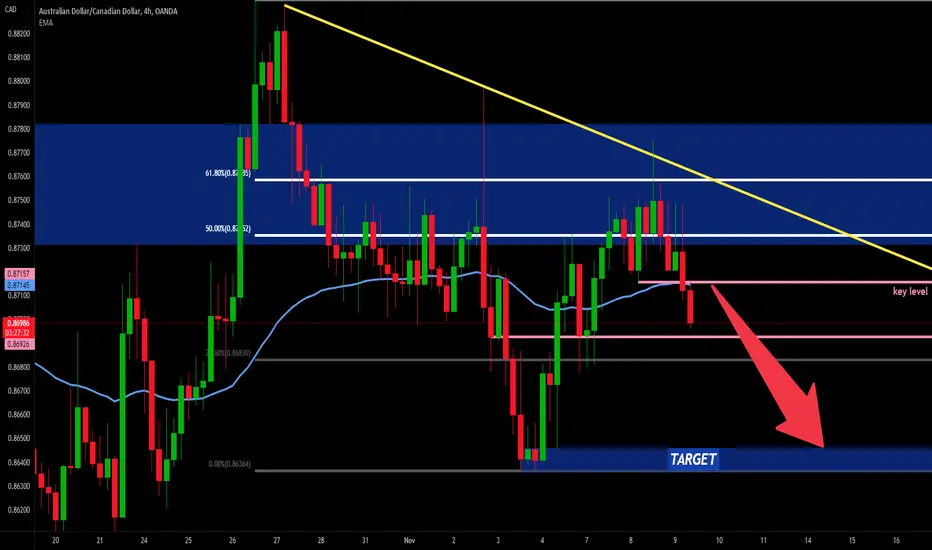
AUDCAD - BREAK OF STRUCTURE 📉The AUDCAD price is in Daily Resistance Level and 61.80% FIB LEVEL🧐
The key level is broken 🔥
so, i predict a bearish move 📉
TARGET: 0.86440🎯
...
if you agreed with this IDEA, please leave a LIKE, FOLLOW or COMMENT!
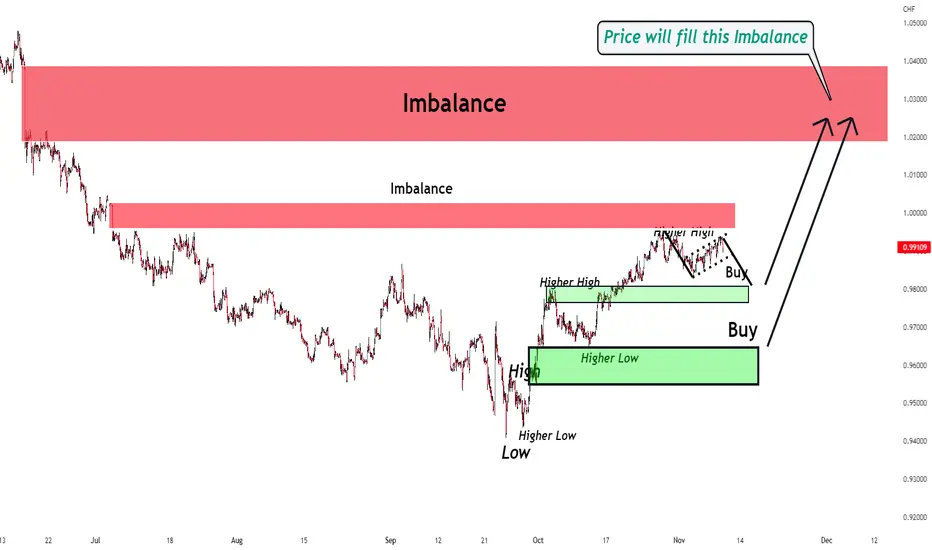
EURCHF Analysis by ForexBeeIn eurchf, there is a clear imbalance zone and price is most likely to fill that imbalance area near in future. From the bottom, price is also completing first wave and now third wave will start after minor retracement. i have mentioned high probability buy zones from where price is most likely to reverse.
Is Gold (XAUUSD) Bullish? Think Again! - Full Top-Down AnalysisTraders and Investors,
The gold started to rise on NFP data last week. Now that it showed a few patterns playing out and rejection from a level forming triple bottom, is it really bullish? There are few scenarios which first look at before we start to make any decisions.
In this Gold (XAUUSD) analysis update we will look at what happened and what sort of opportunities can be there in coming days and possibly weeks.
Please support this analysis by liking and sharing. 👍🙂
Rules:
1. Never trade too much
2. Never trade without a confirmation
3. Never rely on signals, do your own analysis and research too
✅ If you found this idea useful, hit the like button, subscribe and share it in other trading forums.
✅ Follow me for future ideas, trade set ups and the updates of this analysis
✅ Don't hesitate to share your ideas, comments, opinions and questions.
Take care and trade well
-Vik
____________________________________________________
📌 DISCLAIMER
The content on this analysis is subject to change at any time without notice, and is provided for the sole purpose of education only.
Not a financial advice or signal. Please make your own independent investment decisions.
____________________________________________________

Daily review of BTC interval 4HHello everyone, let's take a look at the BTC to USDT chart, in the 4 hour timeframe. As you can see, the price is moving below the local downtrend line.
Let's start with the designation of the support line and as you can see the first support in the near future is $ 19,445, if the support breaks down, the next support is $ 19,217, $ 19,035 and $ 18,854.
Now let's move to the resistance line as you can see the first resistance is $ 19,871, if you can break it the next resistance will be $ 20,871, $ 20,501 and $ 20,706.
Looking at the CHOP indicator, we can see that in the 4-hour interval the energy has been depleted, the MACD indicator shows a local downward trend. It is also worth adding that the volume is getting smaller and we have the first small green candle.
