Fibonaccianalysis

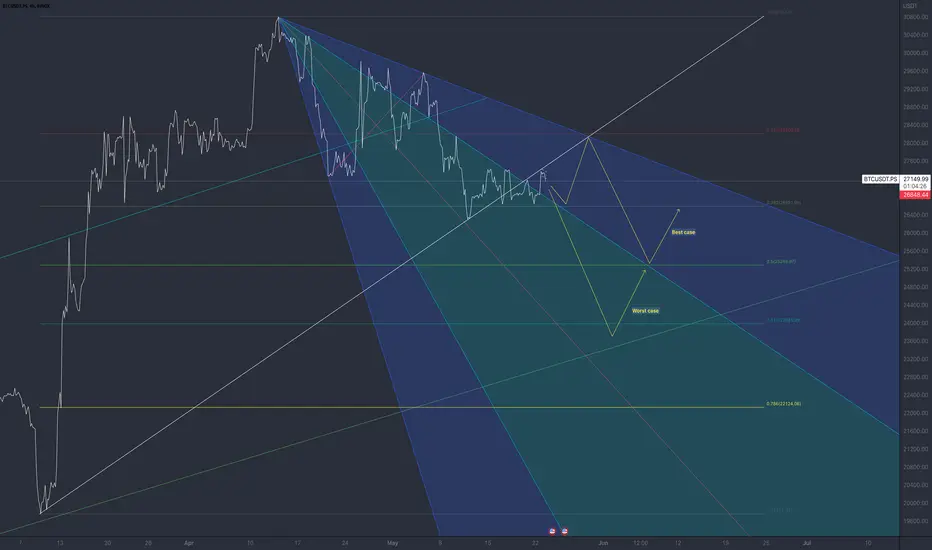
BTC retesting the resistance and May go deeper (25000$- 24000$)BINGX:BTCUSDT.PS
BTC almost retest the resistance and there is two possible scenario:
1- Best case:
Will support on Fibonacci 0.382. Then retest the 0.236 resistance ( topside of pitchfan and daily resistance at the same time too). I guess after that will move to fibonacci 0.5 level (25200$)
2- Worst case:
Will dump straight to test the fibonacci level 0.618 and center of pitchfan at the same time (near 23900$)
DOT/USDT 1DInterval Resistance and SupportHello everyone, I invite you to review the DOT chart in pair to USDT, on a one-day timeframe. First, using the yellow line marked with the uptrend line from which the price broke down, and then we move in the channel marked with blue lines from which the price also goes down.
When we turn on the EMA cross 200, we can see that we are below this line as to the actual downtrend, while with the Ema cross 10 and 30, the downtrend is also visible.
Going further, we can move on to marking the place of support in a situation when we increase the correction. Here you go very strong support is at $4.98, if the support doesn't hold the price we can see a drop in the area and very strong support at $4.26.
Watching the other side of the picture that the price has rebounded off the $5.53 resistance which is still the first first resistance for the price, then we have the second resistance at $5.91, then the third resistance at $6.22, then the price of the change in the direction of return at the level of $6.53.
Please enter the CHOP index, which shows that there is still energy for the next move, MACD shows that you are on the verge of returning to the downtrend, while on the RSI we have a rebound and we are approaching the border of the border which may also indicate that a correction is coming till the end.

📈 Fibonacci Power in Uptrends📍 What Are Fibonacci Retracement Levels?
Fibonacci retracement levels—stemming from the Fibonacci sequence—are horizontal lines that indicate where support and resistance are likely to occur.
Each level is associated with a percentage. The percentage is how much of a prior move the price has retraced. The Fibonacci retracement levels are 23.6%, 38.2%, 61.8%, and 78.6%. While not officially a Fibonacci ratio, 50% is also used.
The indicator is useful because it can be drawn between any two significant price points, such as a high and a low. The indicator will then create the levels between those two points.
📈 To effectively trade Fibonacci retracements during an uptrend and strategically enter the market during pullbacks, follow these steps:
🔷Identify the uptrend: Determine the presence of a clear upward price movement.
🔷Apply Fibonacci tool: Utilize the Fibonacci retracement tool to identify potential retracement levels within the uptrend.
🔷Focus on pullbacks: Wait for the price to experience a pullback or retracement within the uptrend.
🔷Assess Fibonacci levels: Analyze the price's interaction with key Fibonacci levels, such as the 61.8% or 65% zone, to identify potential support or resistance areas.
🔷Higher highs confirmation: Look for the formation of higher highs after the price touches a Fibonacci level, indicating a continuation of the uptrend.
🔷Entry opportunity: Consider entering the market after a pullback when the price resumes its upward movement, using appropriate risk management strategies.
By combining the power of Fibonacci retracements, recognizing pullbacks in uptrends, and waiting for higher highs, traders can position themselves to capitalize on the potential profit opportunities offered by the market.
👤 @QuantVue
📅 Daily Ideas about market update, psychology & indicators
❤️ If you appreciate our work, please like, comment and follow ❤️

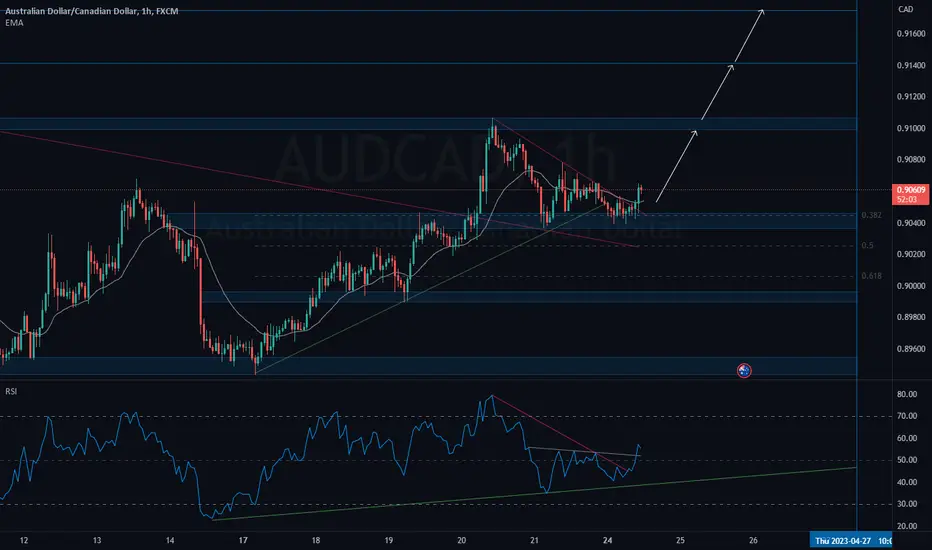
AUD/CAD This is just an example of technical analysisIf helps you, please like and share.
#price_action FX:AUDCAD
Gold Epic Bull RunGold has been in the ascending channel since the second half of 2022.
We have seen 2 small falling channel formations within this huge channel and we are currently experiencing the 3rd falling channel formation.
We can understand that we have come to the end of this small falling channel, so we have come to the support of the rising channel.
The rejection of gold from these levels will indicate that it is entering a potential bull run.
As we can analyze from the Fibonacci time zone indicator, this run has the potential to continue until mid-July.
Breaking the ascending channel and falling below the $1900 level will invalidate this analysis and stop it.

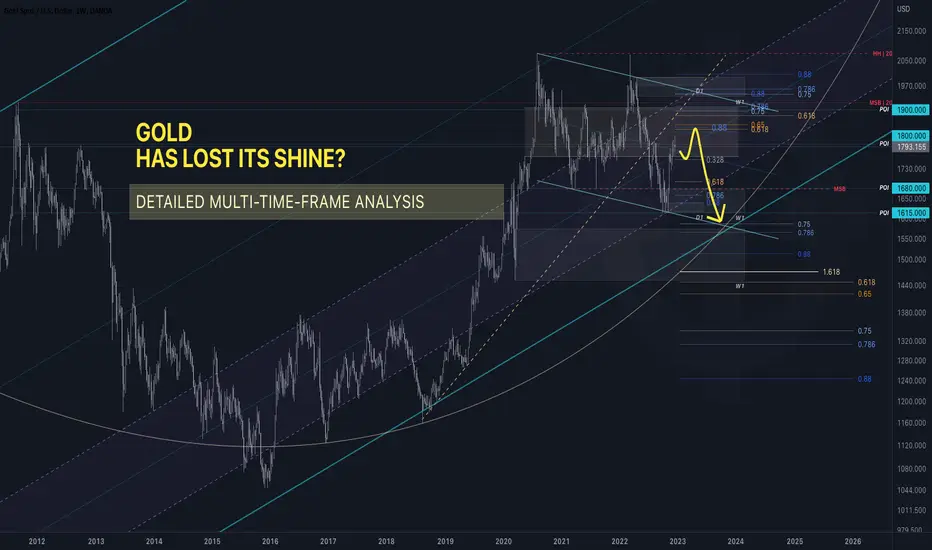
HTF - GOLD - HAS LOST ITS SHINE?My analysis today deals with how the further course of our most popular precious metal "GOLD / XAU" could look like.
For this I have carried out a "MULTI-TIME-FRAME" analysis, which refers to the higher time units (month - week - day) and thus makes the big picture visible.
Normally, all time units below "1h" are called noise, but even a - 1h-4h - analysis is of no use to you, if the knowledge about the big and whole is missing.
> We traders know that nobody can predict the future, and that's exactly why you have to be prepared for all initial situations.
> If the DXY should rise again, it means "BLOOD" for the traditional and crypto markets.
> This creates dangers, but also opportunities - it is important to look at the big picture.
> I have explained in detail which levels are RELEVANT in the following pages. .
table of contents
1st part = INTRODUCTION
2nd part = TECHNICAL ANALYSIS
= Monthly - Time frame
= Weekly - Time frame
= Dayly - Time frame
3rd part = CONCLUSION
PART ONE
"INTRODUCTION"
After "XAU/USD" formed a double top between 2020-2022, a strong sell-off has been unleashed thereafter.
> This sell-off paused in October this year to test the strength of it.
> With a subsequent bullish monthly candle, many retail investors now feel on the safe side that new highs will be reached.
> Here I do not want to take away the joy, but the big picture does not suggest anything like that.
> Once you look at the DXY (USD index) on the higher timeframes, the following sell-off in gold is "indirectly" confirmed.
(My DXY analysis is linked below this post, for confirmation purposes.)
GOLD SAFE HARBOUR .
If you follow popular wisdom, GOLD is classified as a safe and reliable haven.
SPEAKING LIKE ...
> "All that glitters is not gold."
> "Talk is silver, silence is gold."
> "Much gold, much future."
That, the precious metal gold got such a high value awarded - HAD - its reasons.
> Inflation protection and security - are definitely the two most associated words with this precious metal.
Unfortunately, at the latest, since the year 2021, this no longer seems to apply.
> If one compares the loss of inflation and the gain in value of gold, a significant gap can be seen, at which there can no longer be any talk of "inflation compensation".
> Gold will therefore no longer live up to its reputation and a rethinking of its value will have to take place in the future.
SECOND PART
TECHNICAL ANALYSIS
For the analysis of the higher time levels, I proceed according to the onion-skin principle.
> MONTH - level > WEEK - level > DAY - level
These are divided into
> SUMMARY > CHARTS
The charts are presented in logarithmic scaling, as the given information can be visually presented in a more harmonious way.
1st MONTH – Time frame
SUMMARY
The trend channel plotted on the chart formed in March|2007 and has since maintained its position as a legitimate trend channel. Its mid-trend line showed reactions when confronted and was respected by the market.
> Price is in the area below the mean line and had last touched the channel in 2018.
> September|2020 the price ran into the mid-line but was not strong enough. This becomes very clear when looking at the moving away middle line despite the "double top".
> The trend arc is another resistance, which should be taken into account for a future downward movement.
If we go into more detail about the "SUPPLY & DEMAND" zones, you can look at two zones in the chart.
> The "SUPPLY" zone is VERY STRONG because it is a RBD (Rally Base Drop).
> The "DEMAND" zone is VERY WEAK, as it is a DBD (Drop-Base-Drop).
> If we get another rise in the DXY, the drawn "DEMAND" zone will break and the sell-off will continue.
The Fibonacci retracements should serve us as additional confirmation, and have been proved in past moves (last decades) .
> Should the price rise even further, FIB (1) will serve as a Strong Resistance Zone, although the "FIB Zone = 0.75-0.88 - is the Strongest Resistance. (1)
> If the sell-off continues, FIB (2) cannot do much in the monthly chart, but if necessary there will be a reaction on the "smaller" time levels.
> The FIB (3) = 1.618 level, will resemble a large magnet and in combination with the FIB (4), will trigger a large resistance reaction in the market.
Past highs and lows usually serve as resistance / support, of which we have three.
> HIGH | 08/20 - Already showed a reaction (double top).
> HIGH | 09/11 - Point of Control
> LOW | 03/21 - Broken and recaptured
Points and levels of interest are in front of us, which have played a strong role for the market since 2011 .
> The most significant resistance, represents the plotted - POI (1800 USD), which is still contested at the time of this analysis.
> The other POIs have non-negligible resistance and support characteristics and should be kept in mind.
CHARTS
XAU - Overall picture
XAU - Trend lines
XAU - Supply & Demand ZONES + Market Structure Break
XAU - Fibonacci
XAU - POI
ATTENTION
In the following time levels, I will only deal with the NEW, added elements. .
2nd WEEK – Time frame
SUMMARY
In addition to the already mentioned trend channel, now three more become visible, which may have escaped the one or the other.
> The "Purple" trend channel formed at the same time as its big brother (monthly channel) and thus represents a major significance for the market.
We are at the middle line of the channel and the market seems to have used it as support.
> The "Turquoise" trend channel accompanies us since the last high and has a big say with its many interactions.
My guess is that its resistance line will decide whether the sell-off will continue or be broken with confirmation.
> The "Earth-colored" trend channel is a small sideways accumulation and accompanies us in this area.
Currently, the price has fought its way back into the channel, confirmed it and is now targeting the top of the sideways channel.
> The "Orange colored" trend line , has been respected since 2018, 07|2022 broken.
The price suggests that the trend line is approaching for a final retest.
The additional "SUPPLY & DEMAND" zones join the two existing ones and remain untouched.
As additional Fibonacci additions, we have:
> The 0.88 FIB (1), combined with the levels from the FIB (2). This represents with the 0.88 levels from FIB (2) - two very relevant resistance ranges.
> FIB (3) is only valid if the price does not rise further and therefore the input values do not change. Should this be the case, the 0.786 + 0.88 area is the most important to watch out for.
CHARTS
XAU - Overall picture
XAU - Overall picture + Month
XAU - Trend Channels + Trend Lines
XAU - Supply & Demand ZONES
XAU - Fibonacci
ATTENTION
In the following time levels, I will only deal with the NEW, added elements. .
3rd DAY – Time frame
SUMMARY
The chart shows a falling triangle which has been broken .
> As a result, the price has confirmed this break, with a close at the break point.
> At this time level, there will be a sell-off, especially if the DXY rises.
To give a little comment on the "Supply & Demand" zones:
> The upper two "SUPPLY" zones are definitely very strong. 1800 + 1980.
> The bottom "DEMAND" zone is very strong, as it is a DBR (Drop-Base-Rally) zone. (ca. 1640 - ca. 1615)
> The "DEMAND" zones in between are incidental, will trigger small reactions on the lower time frames, but nothing significant. (ca. 1760 - ca. 1660)
CHARTS
XAU - Overall picture + Month + Week
XAU - Supply & Demand ZONES + Trend Lines
THIRD PART
CONCLUSION
"The central banks, themselves, are behind the gold price manipulation. What should you get out of it?"
Run this question through your head and let me know in the comments what you think is more likely.
> Another sell-off or a positive gold price for now?
In summary, based on technical analysis, there are a few reasons for a weak GOLD price .
> If you look at the area between 1,950 USD - 1,840 USD, it almost seems like an arm guarding the upper levels.
> To bring down this defense, I think, needs more momentum than what we have and are getting right now. (Christmas, New Year, Chinese New Year)
For this reason, I expect a weak gold rate and a strong USD, and an accompanying bloodbath in the traditional and crypto markets.
> Positioning after confirmation of this thesis = SHORT .
If this idea and explanation has added value to you, I would be very happy to receive an evaluation of the idea.
Thank you and happy trading!
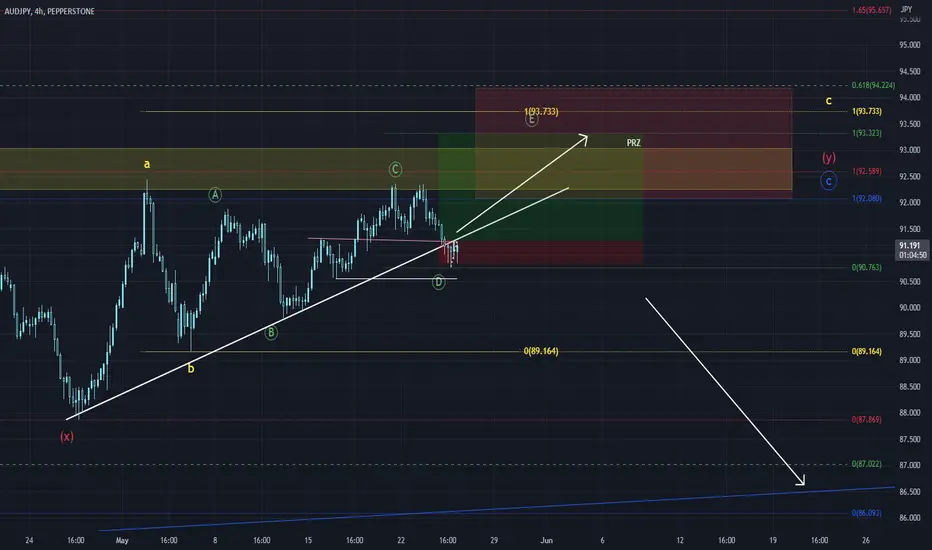
AUDJPY 2023 05 25 Go LongLet's put a buy limit slightly above the lasati high candle stick and SL below the lowes candle.
TP about 200 pips at 1.0 fibonacci extension around 93.300.
Good luck!
$EURUSD Can Jump #EURUSDTraders and Investors,
EURUSD has been falling after reaching one of our long-term targets. Now it is at a junction from which it can make a little jump. The price action is still weak, so we must be watchful and wait for good confirmations.
Please support this analysis by liking and sharing. 👍🙂
Rules:
1. Never trade too much
2. Never trade without a confirmation
3. Never rely on signals, do your own analysis and research too
✅ If you found this idea useful, hit the like button, subscribe and share it in other trading forums.
✅ Follow me for future ideas, trade setups, and updates on this analysis
✅ Don't hesitate to share your ideas, comments, opinions, and questions.
Take care and trade well
-Vik
____________________________________________________
📌 DISCLAIMER
The content of this analysis is subject to change at any time without notice and is provided for the sole purpose of education only.
Not financial advice or signal. Please make your own independent investment decisions.
____________________________________________________

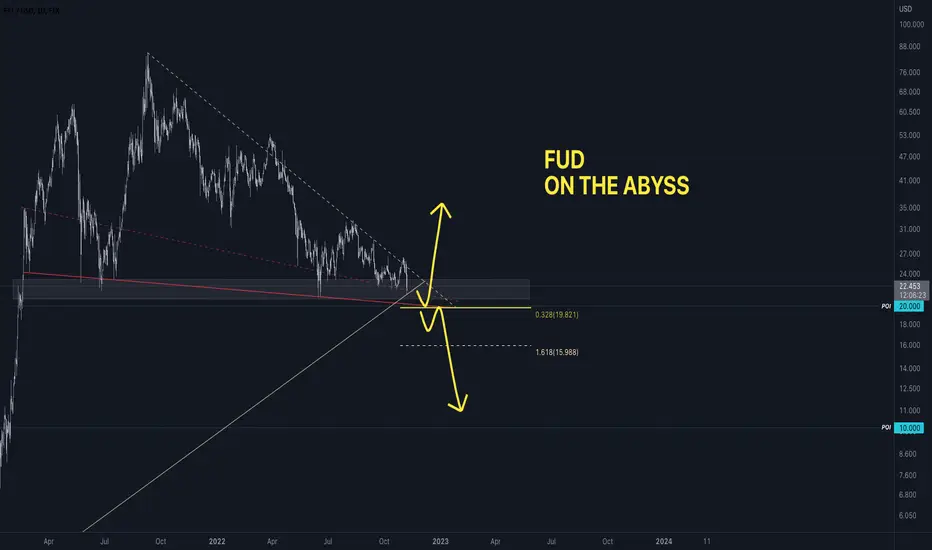
FTT - FUD ON THE ABYSSThe "FTT token" is the native cryptocurrency token of the trading platform FTX.
> Sam Bankman-Fried is one of the founders of the platform and is considered the "young Elon Musk" in community circles.
> For some time, "rumors / speculations" started that the separate company behind FTX = ALAMEDA (investment fund) might be insolvent. (both companies are owned by Sam Bankman-Fried).
> The reason is lack of liquidity of ALAMEDA balance sheet, which consists of Illiquid crypto collateral, + lack of cash reserves.
> After asking for evidence, the answer was indirectly dodged.
Yesterday, the founder of BINANCE had announced on Twitter that he will liquidate his existing FTT tokens.
As a reason for his decision, he cited a lack of trust and looking back at the last "disasters" with "Celsius", "LUNA" + "3Arrow", he does not want to expose himself to any additional risk.
It should be noted that the announcement of the Binance founder from the timing, a supposed death blow - Spartan scale resembles.
> With this he poured oil on the existing fire and the situation could escalate at any time.
> Should there be a "bank run" on the company + the token here if necessary, you can in the following analysis, get a picture of the possible crash.
The probability that this problem will be solved is of course in the room, a possible "loss of face" Sam / FTX / ALAMEDA - can no longer afford.
> Result = wait and see and rather stay out of trading - that will end in liquidation, both directions. .
We are, with the course, at several last SUPPORT levels.
> Should these be significantly broken, it will be a fast descent!
> If the rumors are true, this will additionally mean another sell-off for the crypto markets.
RELEVANT LEVEL
- 22.00 USD
- 20.00 USD
- 19.82 USD (SIGNIFICANT BREAK = crash)
WEEKLY VIEW
3 DAY VIEW
DAY VIEW
> Feel free to discuss it in the comments and share our perspectives, I'd be "burning" to hear your take on the whole thing.
If this idea and explanation has added value to you, I would be very happy to receive a review of it.
Thank you and happy trading!
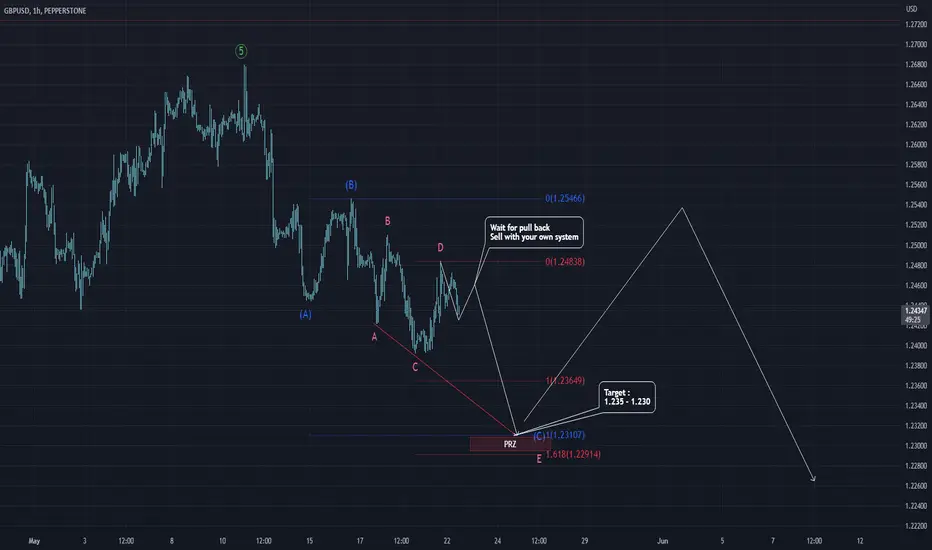
GBPUSD Short Term Plan.1 alternative scenario.
Short term trade.
On the way to complete wave E, (C) and A.
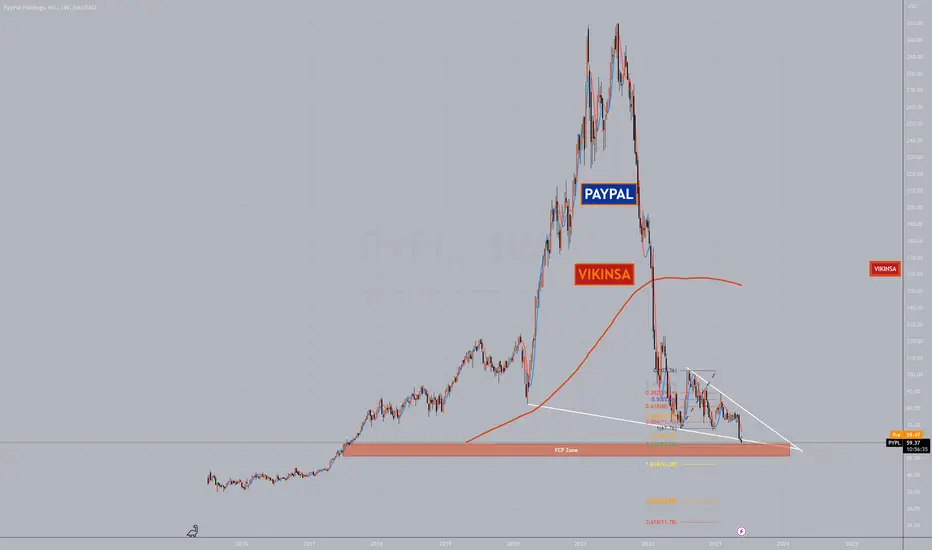
$PYPL Can Rise #PayPalOne of the fallen super heroes of one time has broken through 5 year lows. At this moment in time, the price is getting ready to reach an FCP zone which can be a potentially very good idea to buy or accumulate.
Please support this analysis by liking and sharing. 👍🙂
Rules:
1. Never trade too much
2. Never trade without a confirmation
3. Never rely on signals, do your own analysis and research too
✅ If you found this idea useful, hit the like button, subscribe and share it in other trading forums.
✅ Follow me for future ideas, trade setups, and updates on this analysis
✅ Don't hesitate to share your ideas, comments, opinions, and questions.
Take care and trade well
-Vik
____________________________________________________
📌 DISCLAIMER
The content of this analysis is subject to change at any time without notice and is provided for the sole purpose of education only.
Not financial advice or signal. Please make your own independent investment decisions.
____________________________________________________
BTC/USD - SHORT SZENARIOS - ANALYSE – DThe "BTC/USD" is in a downtrend since Nov – 2021, and it is obvious that we can expect a further - final sell-off if necessary.
-> The coupling of the traditional markets to the BTC is very high because of the institutional investors (example: S&P500 falls = BTC falls).
-> In which key areas we can expect a local bottom, I will analyze in more detail in today's post.
-> For this, we will look at the "BTC/USD" from the daily view and integrate elements of the daily, weekly and monthly chart.
table of contents
- 1st part = EXPLANATION - indicators used + levels.
- 2nd part = SCENARIOS - pro + con breakdown
- 3rd part = CONCLUSION
FIRST PART
1. FIBONACCI RETRACEMENT .
For this Fibonacci retracement, we take the movement,
which started in - March/2020 - and ended in - Nov/2021 -.
-> 0.786 FIB = 17,738.75 USD | Completed
-> 0.88 FIB = 11,608.27 USD | Pending processing
> As "BLUE + dotted" lines - drawn in the chart.
2. | FIBONACCI RETRACEMENT |
For this Fibonacci retracement, we take the movement,
which started in - Dec/2018 - and ended in - Nov/2021 -.
-> 0.786 FIB = 17,246.82 USD | Pending processing
-> 0.88 FIB = 11,057.51 USD | Pending processing
> As "BLUE" lines - drawn in the chart.
3. | FIBONACCI RETRACEMENT |
For this Fibonacci retracement we take the movement,
which started in - May/2022 - and ended in - Aug/2022 -.
-> 1.618 FIB = 12,931.80 USD | Pending processing
> As "orange" lines - drawn in the chart.
4. DEMAND ZONES |
The demand zones formed at the beginning of the upward movement,
thus they were created and in - June-Oct/2020.
-> WEEK ZONE | 1 | = 9,825.00 – 11,720.01 USD | Pending processing
-> WEEK ZONE | 2 | = 8,833.00 – 9,345.00 USD | Pending processing
-> DAY ZONE | 1 | = 9,825.00 – 10,681.87 USD | Pending processing
-> DAY ZONE | 2 | = 9,047.25 – 9,221.52 USD | Pending processing
> As "GREY" areas - drawn in the chart.
5. | POINT OF INTEREST |
The points of psychological interest,
were created the first time Nov - 2017 - and showed some reactions since then.
-> POI | 1 | = 16.000 USD | Pending processing
-> POI | 2 | = 14.000 USD | Pending processing
-> POI | 3 | = 12.000 USD | Pending processing
-> POI | 4 | = 10.000 USD | Pending processing
| POI should be used as support in the upcoming situation.
| POI is used as ZONE -> no point exact support.
> As "Orange" line - drawn in the chart.
SECOND PART .
As soon as the price reaches the broken down levels, we can expect a reaction from the market, which depends on the "weighting" of each level.
1st | SCENARIO | BOTTOM - at around 16,000-17,250 USD (Unlikely).
What speaks in favor of:
- "BREAK OF THE SIDEWAYS TREND CHANNEL"
- "FIBONACCI RETRACEMENT (1) + (2) | 0.786 + 0.786 FIB"
- "LIQUIDITY HUNT
+ this idea must be supported by the DXY + S&P500!
= DXY rises + S&P500 falls
What is the argument against:
- "POINT OF INTEREST (1-4)
- "FIBONACCI RETRACEMENT (1) + (2) | 0.88 +0.88 FIB"
- "USD (DXY)" = further depreciation
- "S&P500" = recovery and no market crash
2. | SCENARIO | BOTTOM - at approx. 11,000-13,000 USD (Very likely)
What speaks for this:
- "FIBONACCI RETRACEMENT (1) + (2) | 0.88 +0.88 FIB"
- "POINT OF INTEREST (2-3)
- "SUPPLY ZONES | D1 (1) + W1 (1)"
- downtrend lines serve as support
+ this idea must be supported by the DXY + S&P500!
= DXY rises + S&P500 falls
What is the argument against:
- "POINT OF INTEREST = Existing liquidity cascade (4).
- "SUPPLY ZONE" = D1 (2) + W1 (2)"
- "USD (DXY)" = further appreciation.
CONCLUSION .
At the moment, it is impossible to say what the exact scenario for "BTC/USD" will be.
The correlation relevant for us to make decisions is as follows:
- DXY (USD) is currently like a kind of indicator of fear in the market, with which it controls the S&P500.
- The S&P500 is currently at a very relevant level (3,600 points), if this breaks sustainably (with confirmation), we will see a strong sell-off in all markets - market crash!
- Should this market crash occur, then this will also have a significant impact on BTC. (Liquidation cascades of stop loss orders and fear from retail market participants.)
= The marked levels should have large order blocks ready, which will consume this sharp sell-off within a short period of time .
-> As soon as the BOTTOM formation crystallizes, I will upload a detailed LONG execution.
-> Feel free to discuss it in the comments and share our perspectives, I'd be "burning" to hear your take on the whole thing.
If this idea and explanation has added value to you, I would be very happy to see a review of it .
Thank you and a successful trading!
The following image should show you where the support line comes from:
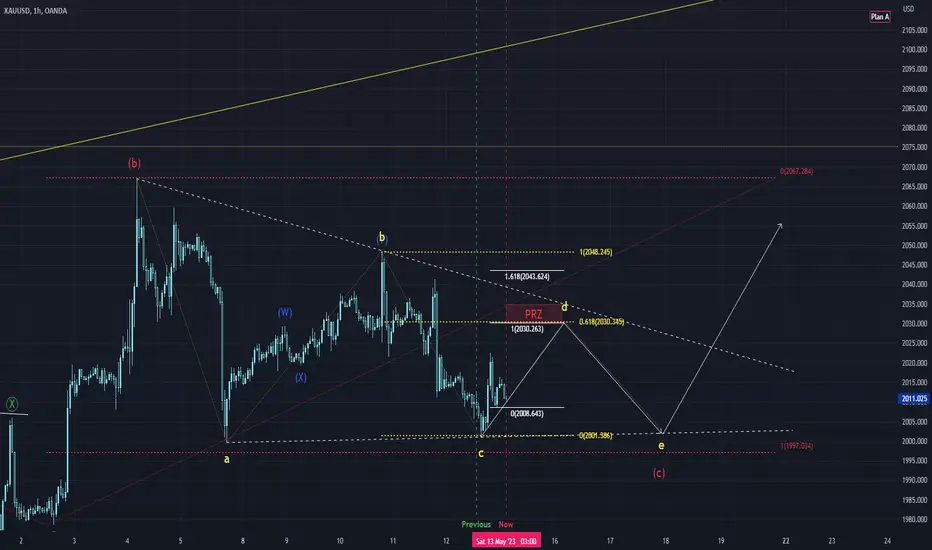
xauusd. Expecting for this early weekday 2023 05 15
This is my plan for Monday.
IMHO xauusd will bounch at 0.618 level and go down again to level a and c leg.
And then I'm expecting the big correction ended, and it will go back to the main uptrend.
Let's see what the market will perform in this early weekday.
Please CMIIW.
Please share your thoughts. Thank you...
#CryptoMarketCap Analysis #Crypto $BTCTraders and Investors, Let's talk about the crypto market. There has been a lot of discussion lately about each and every little move that Bitcoin makes. A little move up sends bullish sentiments and over-the-moon projections across social media. Whereas a downward move creates despair. 🙂 This has been going on for weeks and months.
So let's see what has been happening to the crypto market overall.
1. Crypto market capitalization reached an all-time high of approximately around 3 Trillion
2. As with all hype, what goes up must come down, it took a massive correction finally.
3. This created a major M pattern on the weekly/monthly time frames which is quite evident. In fact, there are 2 M patterns.
4. Once the M pattern completes, the market goes up so it started bouncing up.
5. It reached its one target exactly at 23.6 Fibonacci
6. It then took a correction again from there which was quite understandable and expected
7. Now this is simply consolidating in a range which has its mid-set at 1 Trillion market cap. This can keep going on for a long time and is a common behaviour after a huge move followed by a 23.6 correction.
So what is next?
1. There will be a breakout from this range at some point.
2. But usually it first creates a major trap on one side and then goes to the other.
3. So wait for a move which will make nearly everyone think in one direction. This will create a major bias (general consensus) 🙂
4. Start thinking in the opposite direction unless you get a piece of solid evidence or confirmation to follow the general consensus. Remember a market can do anything. If BTC could go from 3500 to 67000 in a matter of weeks and if USOIL can go to zero then anything can happen in a market.
5. The upper breakout can take it to 1.6 market cap level
6. Lower breakout can take it to 500 billion market cap.
Our bias: (Not advice or recommendation)
1. Wait for a general consensus to build up and go against it on confirmation
2. Downside is more likely at the moment but we will have to wait for further evidence.
Please support this analysis by liking and sharing. 👍🙂
Rules:
1. Never trade too much
2. Never trade without a confirmation
3. Never rely on signals, do your own analysis and research too
✅ If you found this idea useful, hit the like button, subscribe and share it in other trading forums.
✅ Follow me for future ideas, trade setups, and updates on this analysis
✅ Don't hesitate to share your ideas, comments, opinions, and questions.
Take care and trade well
-Vik
____________________________________________________
📌 DISCLAIMER
The content of this analysis is subject to change at any time without notice and is provided for the sole purpose of education only.
Not financial advice or signal. Please make your own independent investment decisions.
____________________________________________________

$TSLA Can Fall #TeslaTraders and Investors, Tesla has been in a downtrend and is looking weaker at the moment. It is forming a potential M pattern which can push the price down. A good confirmation may be needed to initiate a position.
Please support this analysis by liking and sharing. 👍🙂
Rules:
1. Never trade too much
2. Never trade without a confirmation
3. Never rely on signals, do your own analysis and research too
✅ If you found this idea useful, hit the like button, subscribe and share it in other trading forums.
✅ Follow me for future ideas, trade setups, and updates on this analysis
✅ Don't hesitate to share your ideas, comments, opinions, and questions.
Take care and trade well
-Vik
____________________________________________________
📌 DISCLAIMER
The content of this analysis is subject to change at any time without notice and is provided for the sole purpose of education only.
Not financial advice or signal. Please make your own independent investment decisions.
____________________________________________________

CADJPY - DAILY - Bullish Breakout & Continuation TradeTechnical analysis of a potential breakout & trend continuation trade using price action analysis, Fibonacci, structure & volume to predict the direction of the breakout & the ideal location for placing profit targets.
If you have any questions or comments about anything discussed in the video, please leave them below & before you leave DO ME A FAVOR & show your support by hitting that LIKE BUTTON.
I hope you guys have a great weekend!
Your Trading Coach - Akil

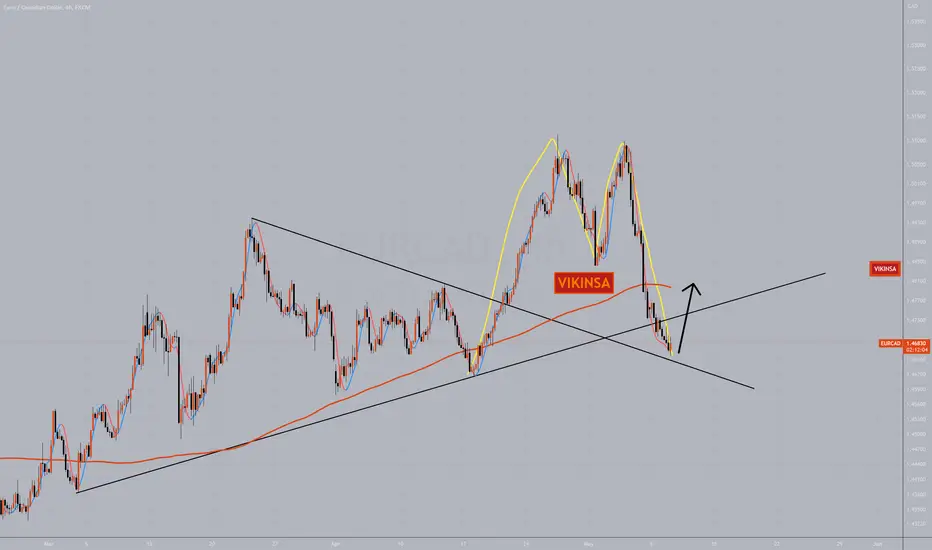
$EURCAD Can Rise Now #EURCADTraders, EURCAD has been falling nicely and gave us a very good short trade. Now it has completed an M pattern in a medium time frame. When the M pattern completes the market goes up. So we can expect this market to rise up any time.
Beware that this can still form an extended M pattern as we have a trend lines cross. So trade what you see and only with a confirmation.
Please support this analysis by liking and sharing. 👍🙂
Rules:
1. Never trade too much
2. Never trade without a confirmation
3. Never rely on signals, do your own analysis and research too
✅ If you found this idea useful, hit the like button, subscribe and share it in other trading forums.
✅ Follow me for future ideas, trade setups, and updates on this analysis
✅ Don't hesitate to share your ideas, comments, opinions, and questions.
Take care and trade well
-Vik
____________________________________________________
📌 DISCLAIMER
The content of this analysis is subject to change at any time without notice and is provided for the sole purpose of education only.
Not financial advice or signal. Please make your own independent investment decisions.
____________________________________________________
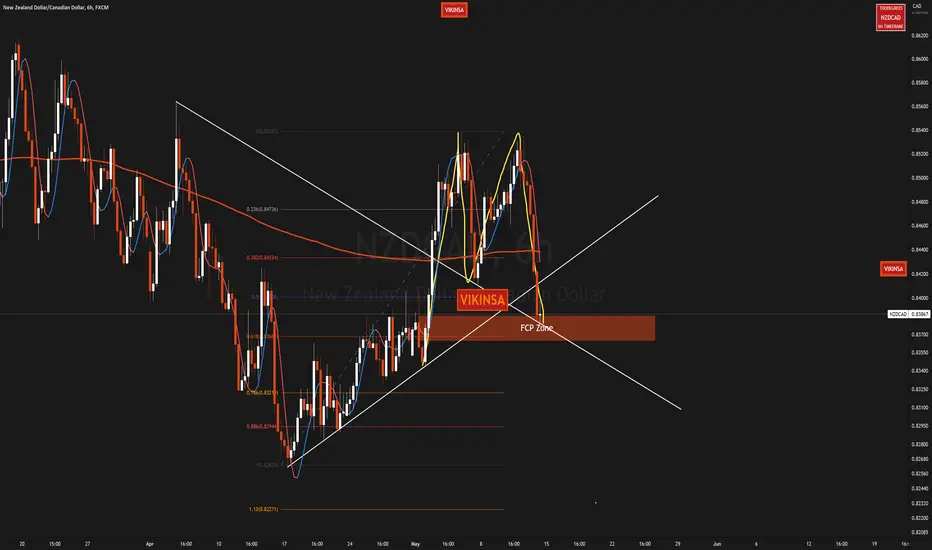
$NZDCAD Can Rise On An M Pattern #NZDCADTraders, NZDCAD has been falling nicely and gave us a very good short trade. Now it has completed an M pattern in a medium time frame. When the M pattern completes the market goes up. So we can expect this market to rise up any time.
Please support this analysis by liking and sharing. 👍🙂
Rules:
1. Never trade too much
2. Never trade without a confirmation
3. Never rely on signals, do your own analysis and research too
✅ If you found this idea useful, hit the like button, subscribe and share it in other trading forums.
✅ Follow me for future ideas, trade setups, and updates on this analysis
✅ Don't hesitate to share your ideas, comments, opinions, and questions.
Take care and trade well
-Vik
____________________________________________________
📌 DISCLAIMER
The content of this analysis is subject to change at any time without notice and is provided for the sole purpose of education only.
Not financial advice or signal. Please make your own independent investment decisions.
____________________________________________________
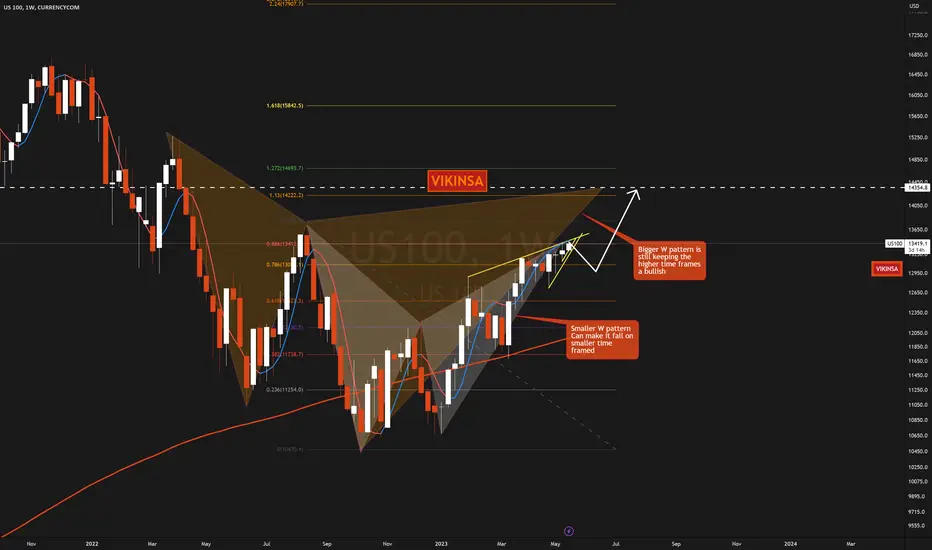
#NASDAQ Can Go Higher $NQ $NDX On The Higher Time FramesTraders, We have been bullish since the last quarter of 2022 on this market. NASDAQ now is reaching a point of a possible breakout. Short term it can go a down a bit but on this higher time frame, it is still forming a bigger W FCP Pattern which means that it is still on its target to reach higher levels.
Please note that the chart is Weekly timeframe.
Please support this analysis by liking and sharing. 👍🙂
Rules:
1. Never trade too much
2. Never trade without a confirmation
3. Never rely on signals, do your own analysis and research too
✅ If you found this idea useful, hit the like button, subscribe and share it in other trading forums.
✅ Follow me for future ideas, trade setups, and updates on this analysis
✅ Don't hesitate to share your ideas, comments, opinions, and questions.
Take care and trade well
-Vik
____________________________________________________
📌 DISCLAIMER
The content of this analysis is subject to change at any time without notice and is provided for the sole purpose of education only.
Not financial advice or signal. Please make your own independent investment decisions.
____________________________________________________
LVS Short with an change of trend after resistance breakoutNYSE:LVS was in a clear uptrend after the higher high couldn't be confirmed. We have a breakout through the resistance zone at ~60.60. The plan is to wait until the price reverses for a correction back to the resistance zone where we are entering. The stop loss is placed above the zone with a take profit at RR 1:1.

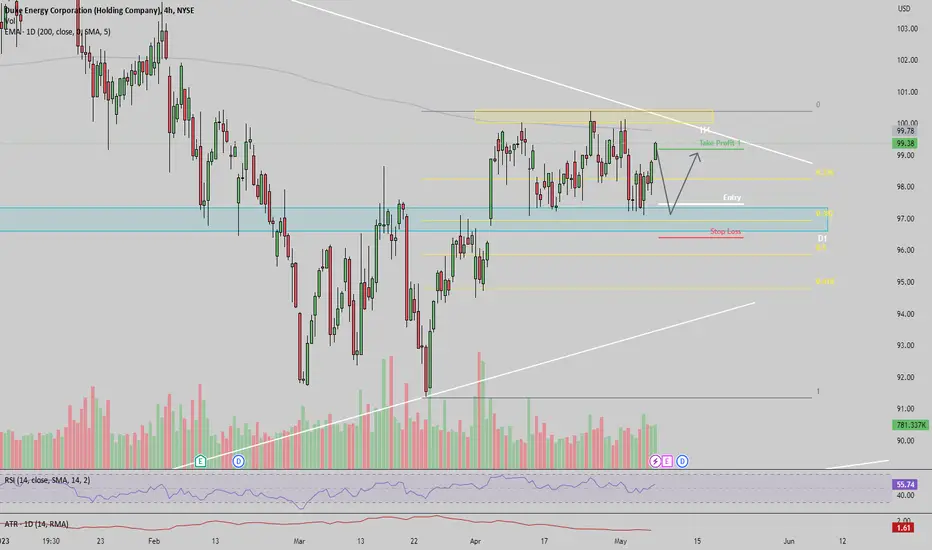
DUK Long with a resistance at ~97.00I plan a trade at 97,48 just before the resistance zone at ~97.00. in the past, this zone was often confirmed and the course changed the direction there. We also have the 0,382 Fibonacci just in this zone, increasing the probability of a reverse in this area. The stop loss is placed below the resistance with a little bit of buffer to breathe. The take profit is placed below the upcoming trendline which can be a resistance.
#NaturalGas Can Rise Up Very Quickly #NATGASTraders, Natural gas has created several bullish breakouts over the past weeks but failed to push higher. Now as we are reaching the end of the wedge pattern, a breakout is imminent. This can create a W pattern which in turn can push the prices higher.
Please support this analysis by liking and sharing. 👍🙂
Rules:
1. Never trade too much
2. Never trade without a confirmation
3. Never rely on signals, do your own analysis and research too
✅ If you found this idea useful, hit the like button, subscribe and share it in other trading forums.
✅ Follow me for future ideas, trade setups, and updates on this analysis
✅ Don't hesitate to share your ideas, comments, opinions, and questions.
Take care and trade well
-Vik
____________________________________________________
📌 DISCLAIMER
The content of this analysis is subject to change at any time without notice and is provided for the sole purpose of education only.
Not financial advice or signal. Please make your own independent investment decisions.
____________________________________________________
