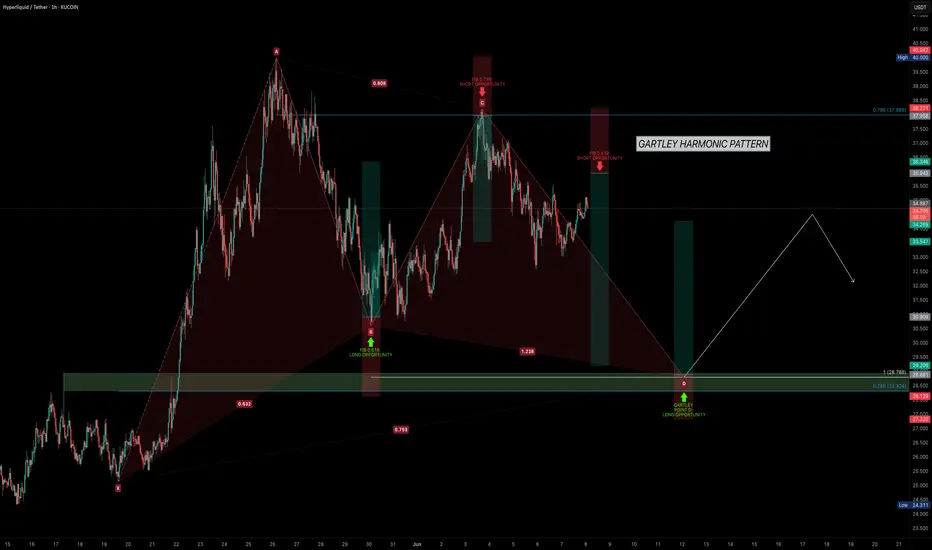
HYPE Precision Trading — Pattern, Patience, ProfitHYPE has shown strong performance since early April, maintaining a clear uptrend. Currently, the market is consolidating in a range between $30 and $40 and it’s setting up for something interesting. Let’s break it down and map the next high-probability trade setup.
Potential Gartley Harmonic Pattern Forming
A valid Gartley pattern may be developing, with point D potentially forming around the $29 level. This zone offers solid confluence for a high-probability long setup.
🟢 Long Setup – Gartley Harmonic Pattern Completion at around $29
Confluences around $29–$28.3:
0.786 Fib retracement of XA
Trend-based Fib Extension 1:1
Negative -0.618 Fib as take-profit level for prior short
Anchored VWAP (0.666 band multiplier) acting as dynamic support
200/233 EMA/SMA support on the 4H TF
FVG + liquidity pool resting just below $30
Setup Details:
Entry Zone: Trend-based Fib Extension 1:1 or laddered between $30–$28.3
Stop Loss: Below $27.5 (adjust depending on where point D forms)
Target: 0.618 of CD leg ≈ $34.4
R:R ≈ 1:3.5
🔴 Short Setup – look for rejection at $36
0.618 Fib retracement from previous move (ideal short entry)
Invalidation: Break above $38.2 (above point C)
Take Profit: $30-$29
R:R ≈ 1:3
🧠 Educational Insight:
Harmonic patterns offer precise entries and targets by aligning Fibonacci levels with market structure. When combined with tools like Anchored VWAP and liquidity analysis, they become powerful tools for swing trading.
Summary:
HYPE continues to respect structure beautifully, offering repeated swing setups in the 10%–20% range. With clear fib symmetry and predictable behaviour, it remains one of the more technically sound altcoins.
Stay patient. Wait for the pattern to complete. As always — don’t chase. Let the trade come to you.
_________________________________
If you found this helpful, leave a like and comment below! Got requests for the next technical analysis? Let me know.
Fibonacci Retracement
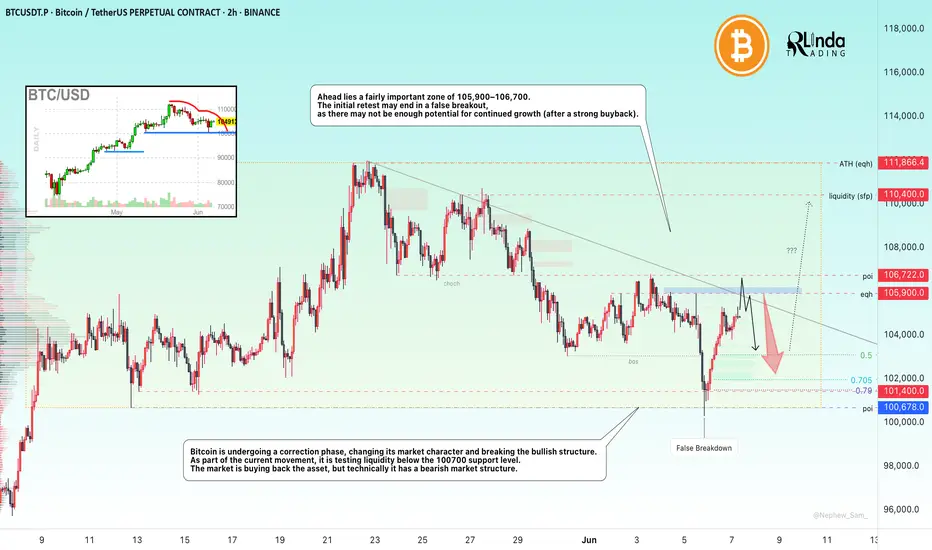
BITCOIN → Correction. The hunt for liquidity...BINANCE:BTCUSDT.P is recovering after liquidity was captured in the 100K zone. Locally, the technical situation is controversial despite the global bullish trend
Bitcoin is changing its market character (106700) and breaking the bullish structure (103000) during a correction phase. As part of the downward momentum, the movement is testing liquidity below the 100700 support level. As for the liquidation, there are several reasons: the conflict between Trump and Musk, strangely enough, the market reacted with a fall; the liquidation of whales, history repeats itself...
Traders are buying back Bitcoin, but technically the market has a bearish structure. Locally, there is a bearish trend, and a countertrend correction, “liquidity hunting,” is forming.
Ahead lies a fairly important zone of 105900-106700. The initial retest may end in a false breakout, as there may not be enough potential for continued growth (after a strong buyback).
Resistance levels: 105,900, 106,720, 110,400
Support levels: 103000, 101400, 100K
After a correction from 105900, which could target half (0.5) of the trading range, the market may attempt to return to a bullish phase, provided that the bulls keep the price from falling and do not allow it to update local lows. That is, in the short term, I expect a decline from 105900 to 103000, but further, if the price starts to return to 105500-105900, there may be chances for growth to 110K
Best regards, R. Linda!
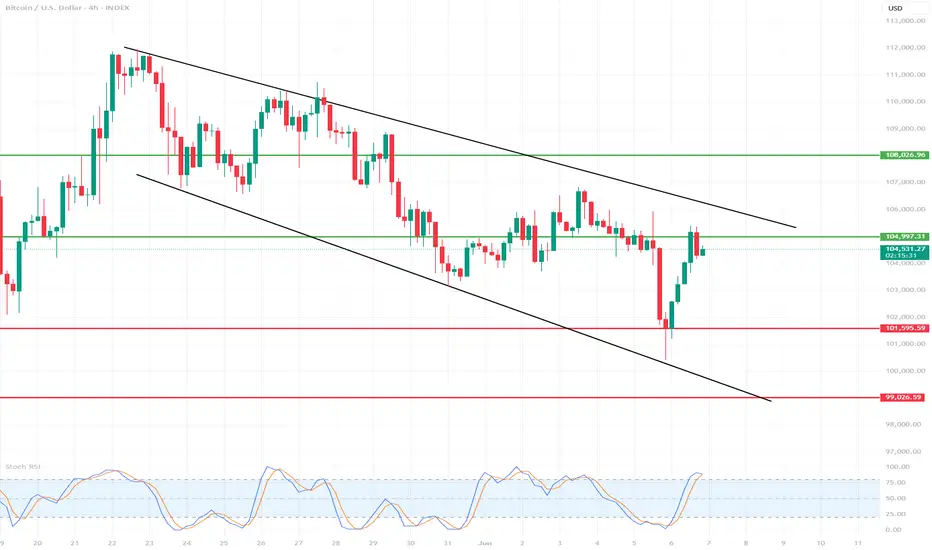
Detailed analysis of the BTC/USD 4H chart🔍1. Chart Context
Interval: 4 hours (H4)
Current price: Around 104,950 – 105,400 USD
Range of recent candles: Strong rebound after a decline to around 101,000 USD.
Lower indicator: Stochastic RSI
📊2. Price Action Analysis
Market structure
Main trend (recent days): Downtrend – from the peaks of ~114,000 USD a clear sequence of lower highs and lower lows.
Recent hours: Dynamic decline, followed by a quick, strong rebound from around 101,000 USD to ~105,000 USD.
Key technical levels
✅Resistance:
~105,500–106,000 USD – local peak of the last rebound wave and earlier lows from the end of May.
~108,000 USD – next key level, with a bigger upward movement.
Support:
~102,000–101,000 USD – bottom of the last movement, quick demand reaction, so-called “stop run” or false breakout.
~99,000 USD – psychological zone and important level in case of further declines.
📊3. Indicators
Stochastic RSI (bottom of the chart)
Currently: Stochastic RSI strongly overbought (above 80 points), both lines (blue and orange) are at the top and slightly curling.
Conclusion: Possible short-term correction/slowdown in growth. Overbought Stochastic RSI often precedes pullbacks, especially when testing important resistances.
🧠4. Possible scenarios
Bulls – Upside scenario:
If BTC breaks above $105,500 with momentum, a move to $106,000–108,000 is possible (another resistance and short squeeze).
The key will be the closing of the 4h candle above $105,500.
Bears – Downside scenario:
If the price does not break $105,500, profit taking and a pullback to $103,000–102,000 are possible.
Strong defense of the $101,000–102,000 level by the bulls – if it is broken again, it threatens to deepen the declines even to $99,000.
📊5. Additional Notes
Reduced Volatility: After such a strong bounce, there is often a period of “calmness” and consolidation.
Potential Traps: False breakouts for 4h and sudden changes in direction (characteristic of the crypto market).
📌6. Warning Signals
Stochastic RSI overbought – suggests to be cautious with long positions “on the top” without additional confirmation.
Lack of continuation after a strong bounce – if the price does not “reach” higher in the next candles, the risk of a correction increases.
🧠Summary:
Currently: BTC/USD in a short-term bounce phase after a strong decline. The price is approaching a significant resistance (~105,500 USD). Stochastic RSI shows overbought – possible correction or sideways movement.
Direction for the next few hours: Reactions at USD 105,500 (resistance) and ~USD 102,000 (support) will be key.
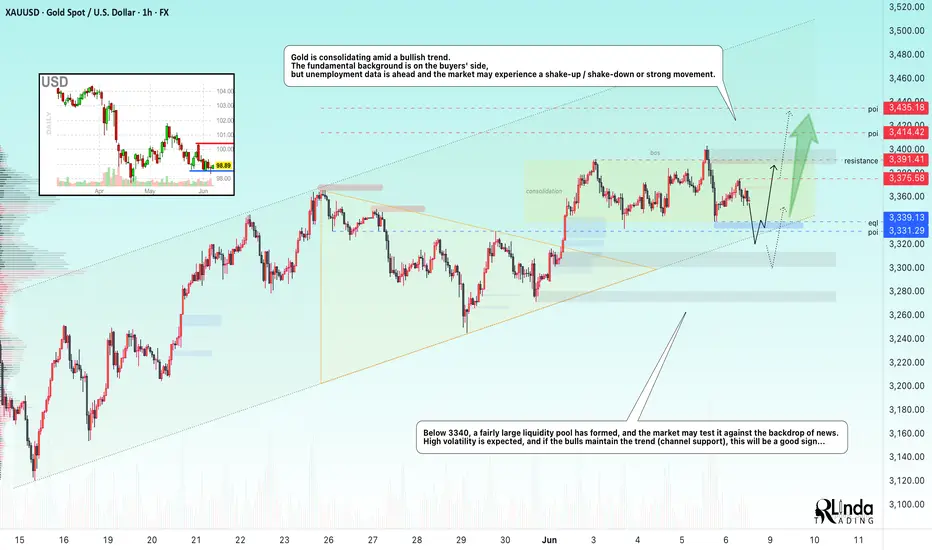
GOLD → Intra-range strategy. Waiting for NFPFX:XAUUSD remains consolidated in the 3340-3391 range. The price is stuck in the middle of the range due to the uncertainty created by upcoming unemployment news...
On Friday, gold rose slightly, remaining within the range ahead of important US employment data (NFP), which could set the direction for the market. Optimism over the US-China deal and profit-taking on the dollar are supporting the USD, holding back gold's rise. A weak NFP (less than 100,000) will reinforce expectations of a Fed rate cut and support gold. A strong report (above 200,000) will have the opposite effect. The probability of a rate cut in September is 54%.
Technically, on the daily timeframe, the market structure is bullish. After a sharp breakout of resistance and a new high, the price is consolidating above the upward trend line, forming a plateau in the 3300-3340 zone. Another shakeout from support is possible before the trend resumes
Resistance levels: 3375, 3391, 3414
Support levels: 3339, 3331
Forming a price forecast ahead of news, especially ahead of NFP, is a thankless task. Therefore, it is advisable to wait for the news and monitor the price reaction. A retest of the consolidation boundary and a rebound are possible. There is a chance that the price will remain in consolidation until next week, but again, it all depends on the fundamental background...
Best regards, R. Linda!
USDCAD → One step away from distributionFX:USDCAD is recovering amid the dollar's growth. Unemployment news is ahead. A return of the price to the buying zone may support the currency pair.
Against the backdrop of the dollar's growth, a change in the market phase is forming (unconfirmed). The price has stopped updating lows and is forming an eql, from which it is breaking out of the downtrend. The initial retest of liquidity at 1.366 may end in a correction. However, a quick retest and consolidation of the price above the level will confirm the change in sentiment
Resistance levels: 1.3686, 1.3732
Support levels: 1.3675, 1.366
Despite the fact that the price broke the downward resistance, the currency pair is still under pressure from sellers who are waiting for the price to fall from 1.3686. A breakout, a change in market sentiment to bullish, and consolidation above 1.3675-1.3686 will confirm readiness for a recovery. Zones of interest: eqh 1.3732
Best regards, R. Linda!

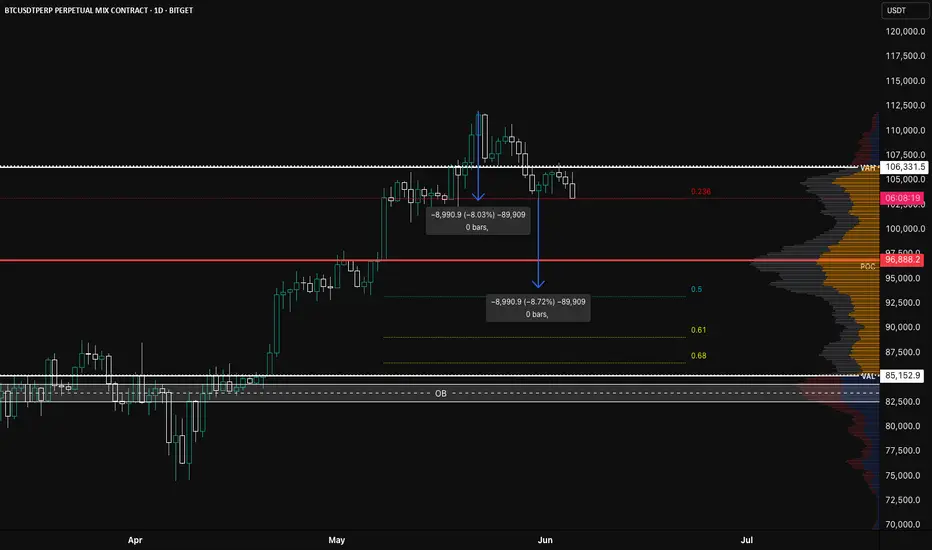
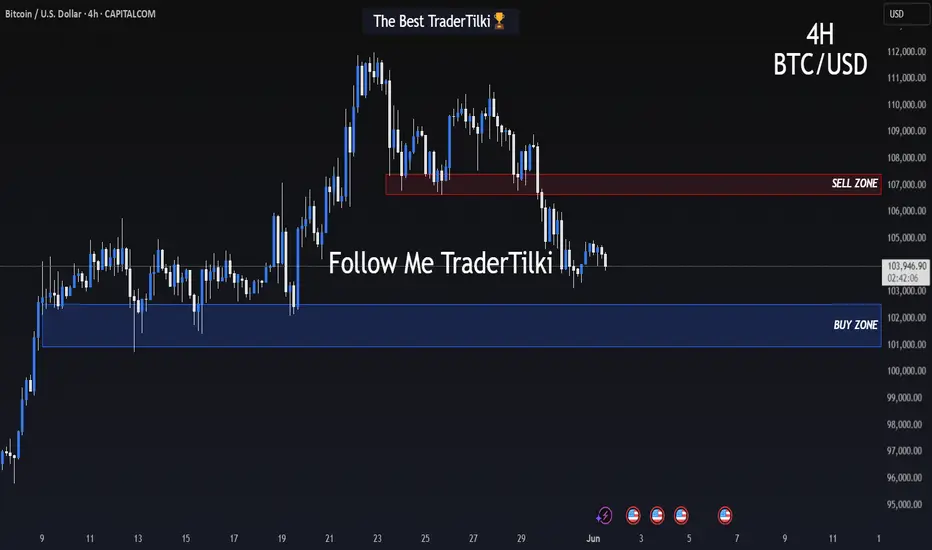
BTC/USDT.P Rejection Confirmed? Eyeing Breakdown Toward 50% FibBitcoin just lost two critical levels in rapid succession:
1️⃣ Value Area High ($106,331)
2️⃣ Previous Monthly High ($105,000)
We’re now closing candles back inside prior structure, showing signs of weakness and potential distribution at the highs.
📉 The Bearish Setup
Price is hovering above the 0.236 retracement. A break and daily close below this level could complete what looks to be the right shoulder of a developing head and shoulders pattern. The distance from head to neckline lines up with a projected move down toward the 50% Fibonacci level ($91,500) — which also aligns closely with the POC ($96,888) as an intermediate stop.
🎯 Targets:
• Neckline/Break Level: $102,800
• Mid-Target (POC): $96,888
• Main Target (0.5 Fib): $91,500
• Confluence zone lower: 0.618 to 0.68 (watch for reversals)
🧠 Context Notes:
• The current 2-leg rejection (~8% each) gives symmetry to the pattern
• High volume nodes around POC could act as reaction areas
• This short setup remains valid while price is closing below ~105k and failing to reclaim VAH
If this structure plays out, it’s a classic example of a failed breakout turning into a strong breakdown — the kind of move that catches late bulls off guard.
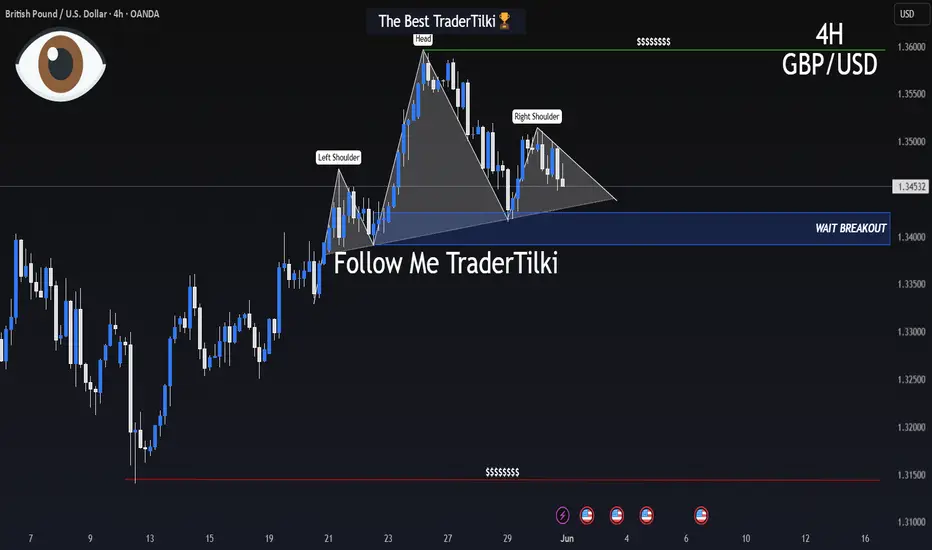
GBPUSD 4H MAJOR REVERSAL SETUP – WATCH FOR THE BREAK!Hey There;
The Head & Shoulders (H&S) pattern in GBPUSD is becoming more defined, approaching a critical neckline level. If a breakout occurs, it could trigger a strong downward move, pushing the price toward new support levels.
Right now, sellers are gaining strength while buyers attempt to defend key support zones. A confirmed close below the neckline could accelerate the sell-off.
📌 If the breakout happens, I’ll share target levels with you—stay tuned for updates
I meticulously prepare these analyses for you, and I sincerely appreciate your support through likes. Every like from you is my biggest motivation to continue sharing my analyses.
I’m truly grateful for each of you—love to all my followers💙💙💙
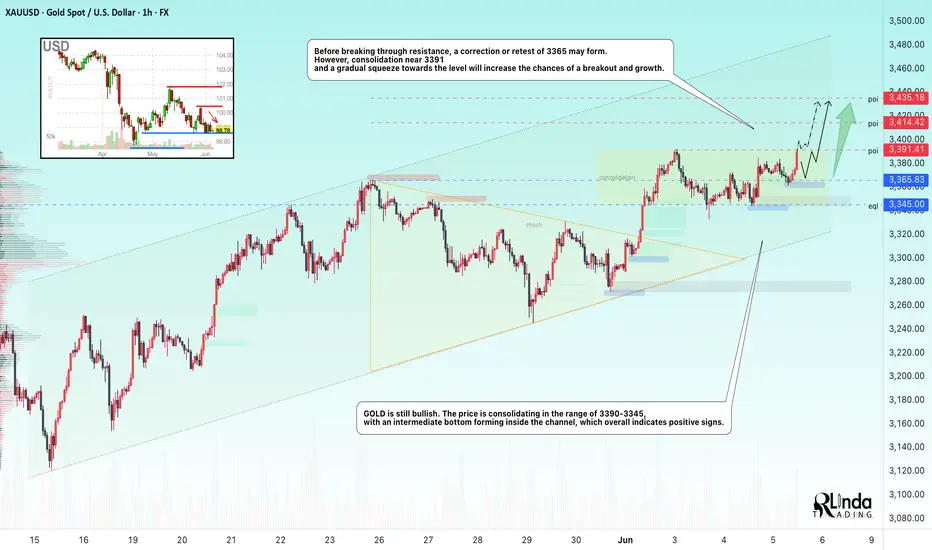
GOLD → Retesting resistance may lead to a breakoutFX:XAUUSD is still bullish. The price is consolidating in the range of 3390-3345, with an intermediate bottom forming inside the channel, which overall indicates positive signs.
On Thursday, gold is consolidating ahead of $3390. Consolidation after growth, within a bullish trend, is a good sign. But, on the one hand, the price is supported by growing tensions between Russia and Ukraine. On the other hand, optimism about US trade negotiations with Canada, the EU, and China is strengthening the dollar and holding back demand for gold.
Additional pressure on the dollar is coming from weak US macro statistics, especially ADP data and the decline in the ISM Services PMI, which have reinforced expectations of Fed policy easing. Traders are waiting for further signals from the regulator.
Resistance levels: 3391.4, 3414, 3435
Support levels: 3365, 3345
Technically, gold is rising and forming a retest of consolidation resistance. If the 3391 level is broken, the price may head towards 3435. Before breaking through resistance, a correction or retest of 3365 may form. However, consolidation near 3391 and a gradual squeeze towards the level will increase the chances of a breakout and growth.
Best regards, R. Linda!
Currently in Consolidation.
Closed at 276.91 (04-06-2025)
Currently in Consolidation.
Crossing 280 would make it more
bullish; but 315 - 317 is the immediate
resistance.
If this level is Crossed with Good Volumes,
we may witness 450+

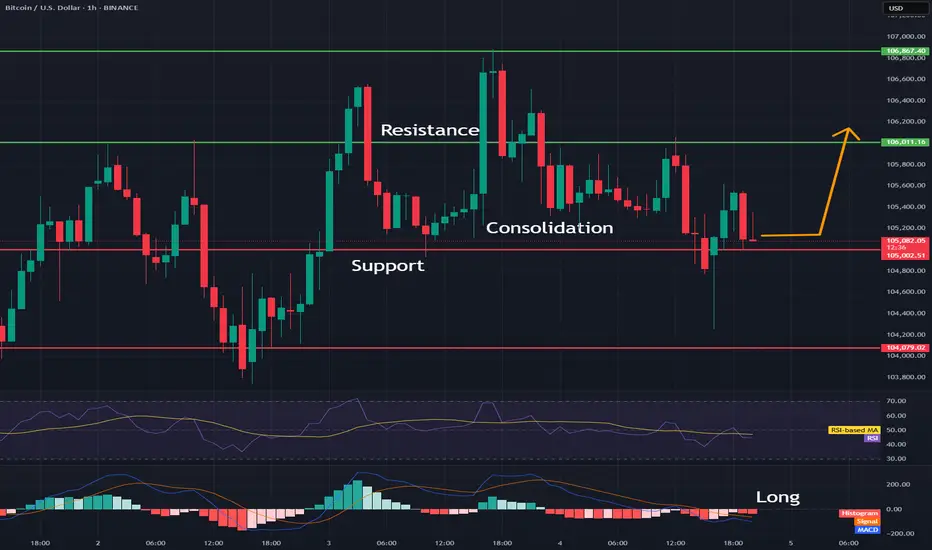
BTC/USD 1H Short-Term🔍1. General Context and Short-Term Trend
Short-Term Trend: The last dozen or so candles have shown strong fluctuations — a typical sideways market (consolidation) after a clear upward impulse and a quick drop. The price is currently trading in the range of around $104,900–$106,500.
Recent Strong Move: Clear upward impulse from around $104,900 to around $106,900, followed by a quick correction.
📌2. Supports and Resistances (H1)
Supports:
$105,000–$105,200 — Bottom of local wicks and several demand tests.
$104,900 — Lowest point of the last few hours, clear buyer reaction.
Resistances:
$106,200–$106,400 — Upper area of several candles, strong price rejection.
106,900–107,000 USD – The peak of the last impulse, a place of clear supply.
✅3. Candlestick formations and price action
Pin bar / long wick: Candles with long lower wicks are visible around 105,000 USD, which suggests that buyers are defending support.
Double top? (Double top): Peaks around 106,900 USD (03.06 and 04.06) – a classic signal of a potential change in direction to the lower.
Possible consolidation: The last few hours have been a series of alternating candles, signaling the lack of a clear advantage of bulls or bears.
🧠4. Technical indicators (MACD and RSI)
MACD (lower panel)
The MACD line crossed the signal line from the bottom to the top, then a quick correction and currently the MACD is close to zero – no clear trend, momentum has slowed down.
MACD Histogram: Declining, close to zero, suggesting potential lack of strong trend and possibility of further consolidation.
RSI (middle panel)
RSI value ~44–48 – not overbought or oversold, neutral market state.
No divergence – RSI generally follows price, no strong divergences are visible.
RSI bounced off 30 (tested oversold zone and returned to neutral range).
🧠5. What could be important?
Volatility Squeeze: Low volatility after a sharp move often heralds another impulse.
Potential Fakeout: If support at $104,900 is broken falsely (e.g. quick wick and return), a move up could occur.
No clear trend on the hourly chart, rather sideways market in the short term.
📊Summary and scenarios
Scenario 1 (bullish):
If the $105,000-$104,900 level holds, we can expect a test of $106,200-$106,400 and perhaps another attempt to approach $107,000.
Scenario 2 (bearish):
If the $104,900 support is broken (with a candle closed below this level), the next target is around $104,500 and below.
What to watch out for?
Timing of macro data releases - may increase volatility.
Sudden breakouts from consolidation - no trend = higher risk of sudden, false moves.
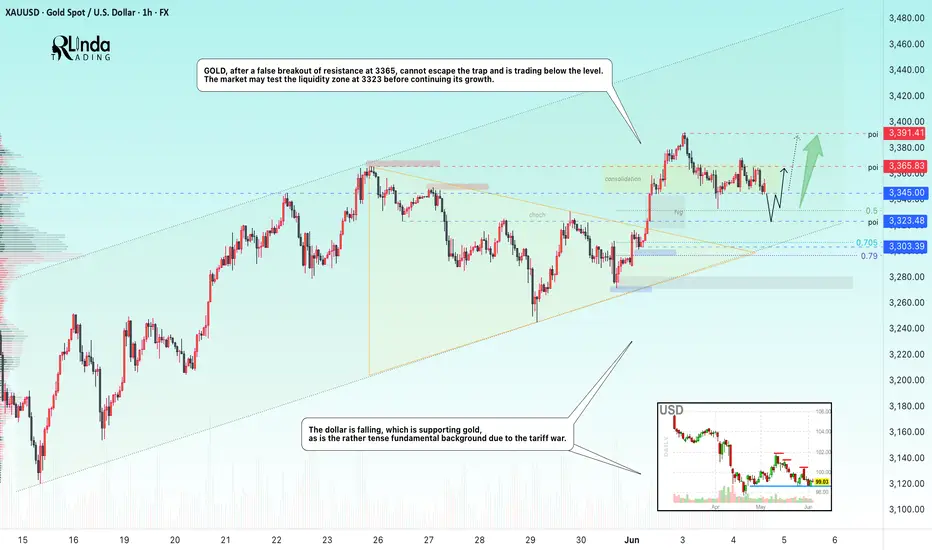
GOLD → Consolidation before a strong move...FX:XAUUSD is consolidating after a false breakout of resistance at 3365, awaiting economic data. The metal remains attractive to investors amid the economic crisis.
Gold is supported by the weakening dollar amid increased trade risks. Today, US tariffs on steel and aluminum come into force, and Trump's ultimatum to trading partners expires. Investors are also awaiting news of a possible meeting between Trump and Xi Jinping amid new accusations against China. The focus is on key employment data (ADP) and the ISM services index, which could influence the dollar and expectations for the Fed's actions.
Technically, the market may test the 3323 liquidity zone before continuing its growth.
Resistance levels: 3365, 3391
Support levels: 3345, 3323, 3303
Overall, both the global and local trends are bullish, with the price forming a local correction after a false breakout of resistance. If the bulls hold their ground above 3323-3345 after retesting support, growth may continue in the short to medium term.
Best regards, R. Linda!
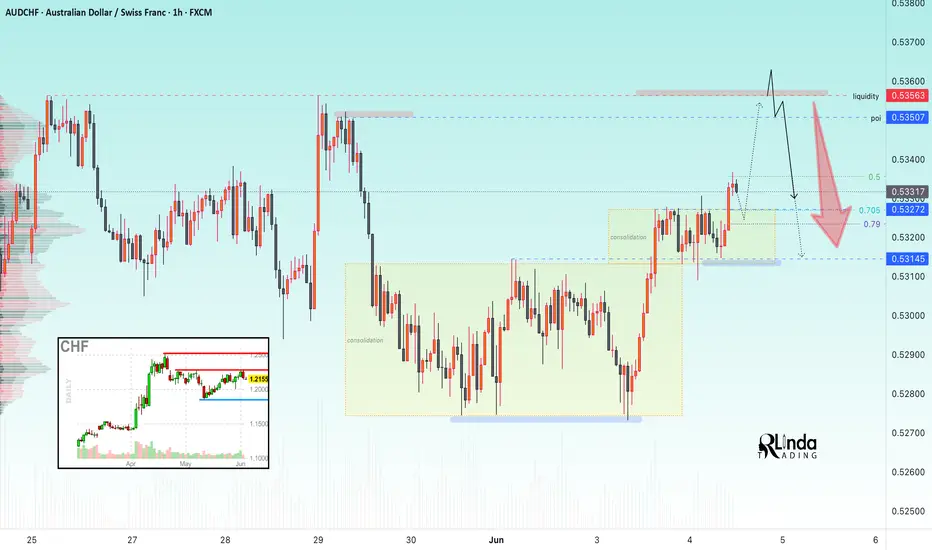
AUDCHF → Hunting for liquidity. Fall from resistanceFX:AUDCHF is emerging from local consolidation and entering a distribution phase. Potentially, against the backdrop of a downtrend, the market may be interested in the liquidity zone at 0.5356
Globally, we have a strong downtrend and a countertrend correction that is facing pressure in the 0.545 zone. The decline is resuming, but at some point the market formed an EQH liquidity pool at 0.5356, which is most likely acting as a magnet pulling the price towards it...
Based on the technical situation, we can conclude that if the price continues to form a distribution towards the target, the market is quite capable of stopping the price and returning to the downtrend phase.
Resistance levels: 0.535, 0.5356
Support levels: 0.5327, 0.5314
Thus, a breakout of the resistance level of 0.5356 without the possibility of continuing growth and a return of the price below the resistance level with subsequent price consolidation in the sales zone (below 0.5356) may trigger a resumption of the downward trend.
Best regards, R. Lind
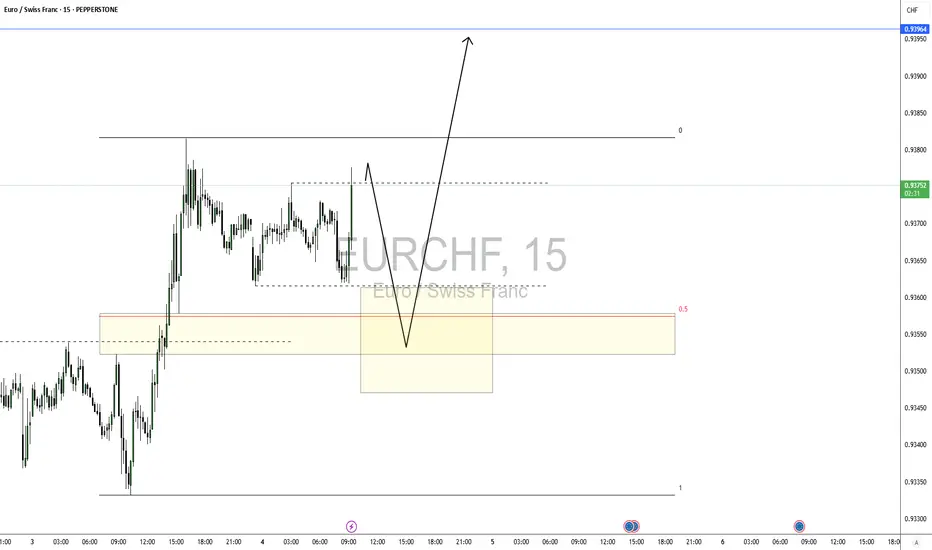
EUR/CHFLooking for the market to retrace, only entering once the market enters my area.
This will be confirmed with my RSI.
But if it takes the high before the retracing, I will not look for a trade anymore, as one of the targets have already been taken
XAU/USD Update - Riding Wave 5 to the TopGold continues its bullish recovery, having completed Wave (4) at the channel low. We're now riding Wave (5) with strong momentum.
🔹 Entry Executed: Entered long at the 0.382 Fibonacci retracement – $3,272.57, a key confluence zone with the EMA and previous structure support.
📈 Bullish Targets:
$3,396.89 (0.27 extension)
$3,463.25 (0.618 extension)
$3,499.84 (1.0 extension / Wave (5) completion)
The move is playing out cleanly, with RSI confirming upside momentum. As long as price holds above the 0.5–0.618 zone, bulls remain in control.
Letting this one breathe — eyes on higher highs. 💰📈
@WrightWayInvestments
@WrightWayInvestments
@WrightWayInvestments
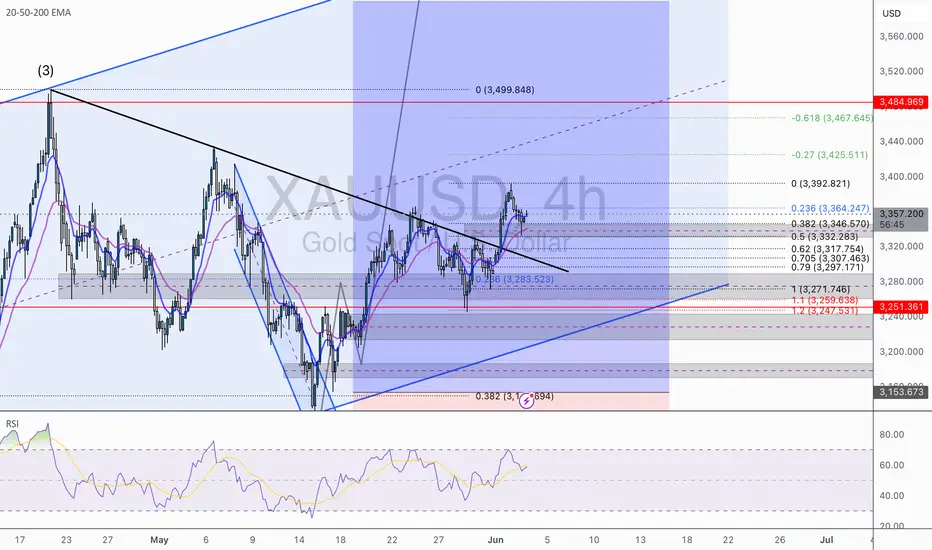
GOLD → Correction to liquidity before growthFX:XAUUSD is in the realization phase after exiting the “symmetrical triangle” consolidation. The price is supported by the trend and a complex fundamental background.
Gold is retreating from its peak, remaining below risk support. The price of gold is falling moderately from $3,392, awaiting data on JOLTS job openings in the US.
Gold is supported by trade and geopolitical risks: Trump doubled tariffs on metals, increasing pressure on the dollar. The conflict with China has escalated due to allegations of violations of agreements.
Focus on US employment: Strong data could support the dollar and limit gold's gains, but the technical picture remains bullish.
Resistance levels: 3365, 3391, 3409
Support levels: 3345, 3323
Against the backdrop of a rising dollar, gold may test deeper liquidity zones, such as 3345 and 3330. However, if trading forms between 3365 and 3345, followed by a retest of resistance and consolidation above 3365, this could trigger an early rise to 3391-3409.
Best regards, R. Linda!
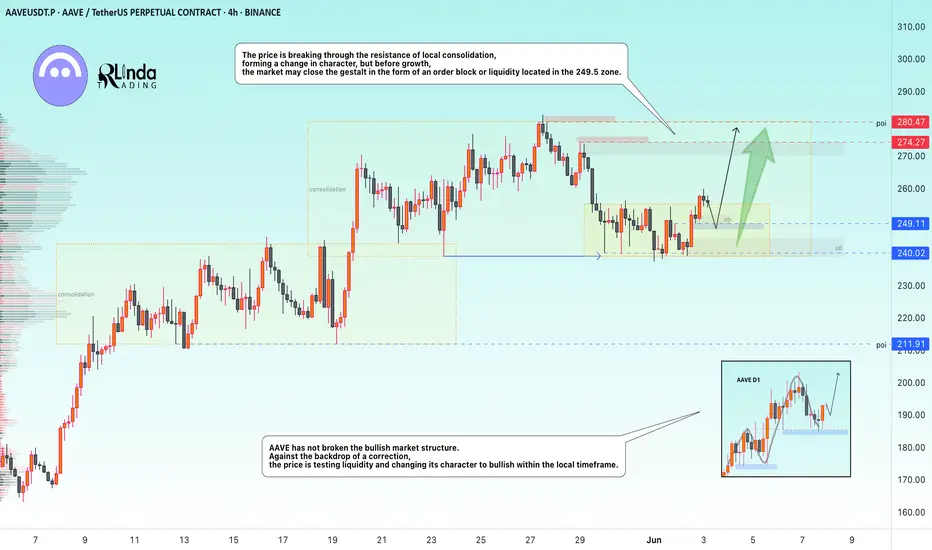
AAVEUSDT → A false breakdown provokes a change of characterBINANCE:AAVEUSDT.P maintains a bullish market structure. The coin is consolidating, with bulls trying to hold their ground above the key support line.
Against the backdrop of a correction, the price is testing liquidity, with a false breakdown of support provoking a change in character to bullish within the local timeframe. Bulls are trying to maintain the bullish structure.
The price is breaking through the resistance of local consolidation, forming a change in character, but before growth, the market may close the gestalt in the form of an order block or liquidity located in the 249.5 zone.
Support levels: 249.11, 240.0
Resistance levels: 274.27, 280.47
Technically, the coin looks quite good and promising overall. If the bulls hold their ground in the 249-250 zone, then in the short to medium term, we could see good movement with the possibility of new highs...
Best regards, R. Linda!
Critical Support Test for Bitcoin: 100K Holding or Breaking? Dear Traders,
Bitcoin's previous support level of 106,000.00 has now been broken, turning it into a resistance point.
At this moment, Bitcoin is at a critical stage, and the most important support level is 100,000.00.
In this zone, rather than opening a position, it is wiser to observe carefully.
If the 100,000.00 support level breaks, I will provide you with a downward target.
If Bitcoin holds at this level and finds support, I will share an upward target.
Right now, Bitcoin is choosing its direction. Will the whales push the price up with their purchases, or drive it down with their sales? We have to watch patiently, like a hunter, to see how this unfolds.👀
Each and every one of you is incredibly valuable to me! I am always working hard to bring you the most accurate and insightful analysis.
A huge thank you to everyone who supports my work by leaving likes.🙏
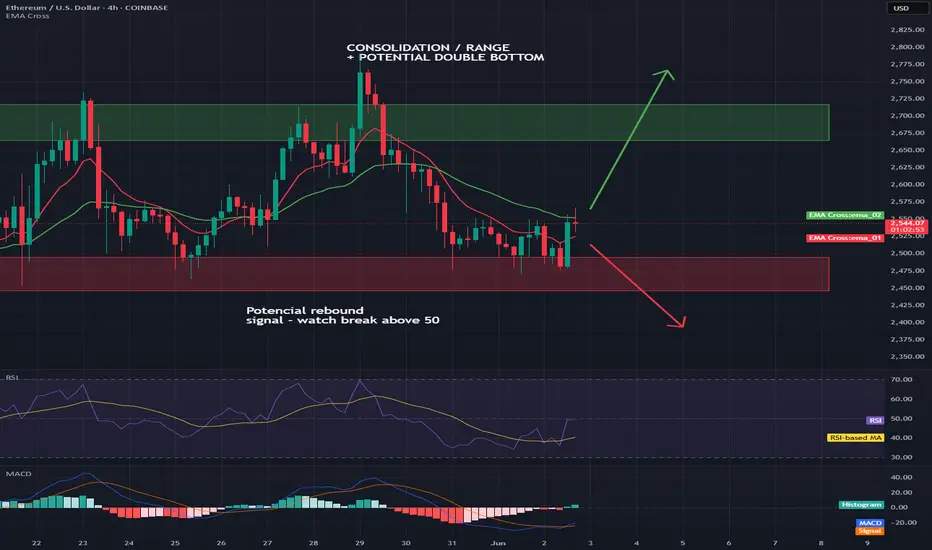
ETHUSD short-term🔍1. Technical situation
ETH/USD is in a consolidation phase — the price is moving in a rather narrow range, without a clear upward or downward trend.
📊
The upper limit of this consolidation is the resistance zone of USD 2,664–2,717 (green rectangle on the chart).
The lower limit is the support zone of USD 2,495–2,446 (red rectangle).
2. Potential formation
A potential double bottom formation can be seen on the chart, which is a classic trend reversal formation to an upward one.
The lows occurred around May 25–31 and at the end of May.
Confirmation of the formation would be a breakout of the resistance zone of USD 2,664–2,717.
3. Technical indicators
RSI:
Currently, the RSI has rebounded from zone 40 and is heading up. Exceeding the 50 level may be a signal of buyers' strength and support for the bullish scenario.
On the chart: "Potential rebound signal - watch break above 50"
MACD:
MACD is close to generating a momentum change signal (potential intersection of the MACD and signal lines).
On the chart: "MACD near signal - watch for momentum shift"
4. Scenarios for the coming hours/days
Bullish scenario (up):
✅
If the price breaks above USD 2,717 (exit from consolidation upwards), a dynamic move towards USD 2,800 can be expected.
Support for this scenario will be signals from RSI and MACD.
Bearish scenario (down):
🔻
If the price rejects the resistance zone and returns below USD 2,446, the risk of going down to the next support in the area of USD 2,300 increases.
🧠
Summary
Key Levels:
📌
Support: $2,495-$2,446
Resistance: $2,664-$2,717
Currently, the market is in consolidation with an attempt to break out to the top.
Watch for: Resistance breakout (potential bullish signal) and support reactions (potential bearish).
Pattern: Potential double bottom - needs confirmation.
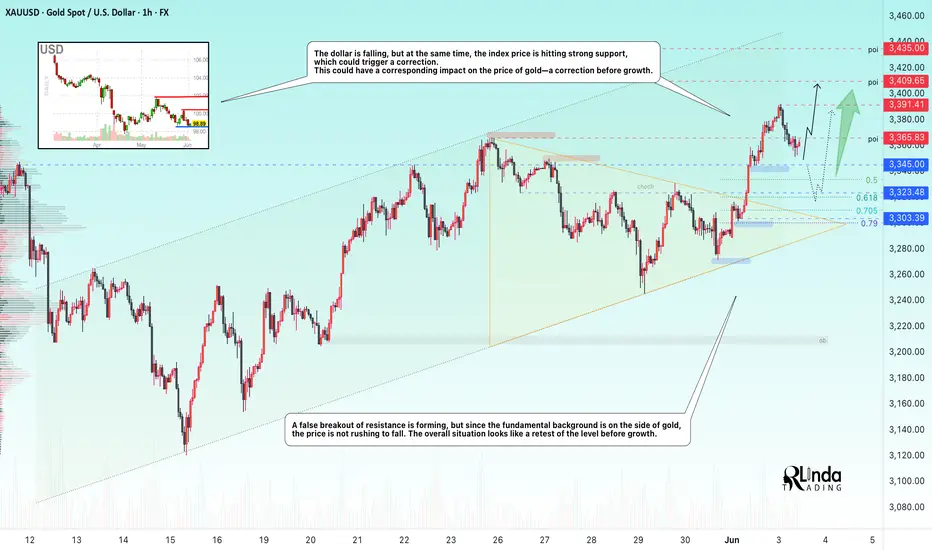
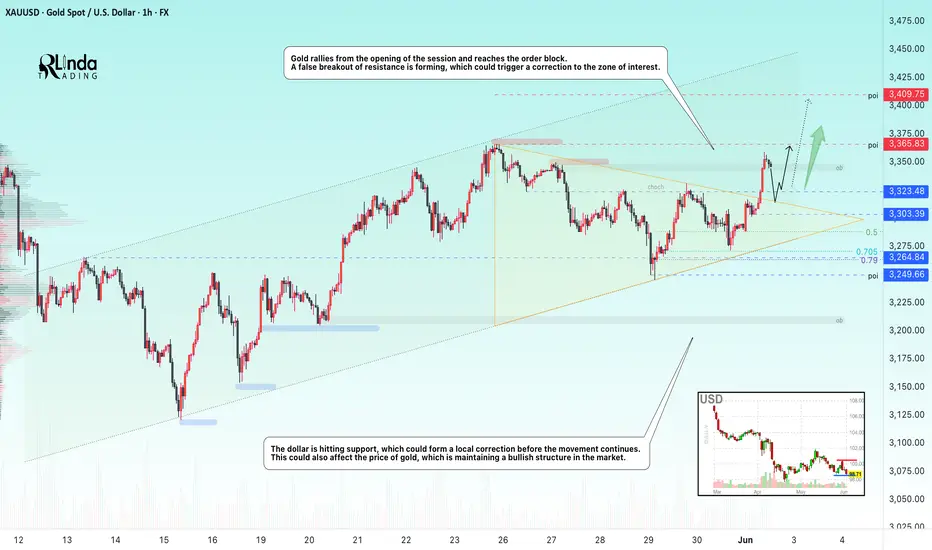
GOLD → Correction after distribution. Bullish trendFX:XAUUSD is testing the liquidity zone at 3350 and forming a false breakout of resistance within the uptrend. A correction is possible before growth continues.
The fundamental background is quite controversial in the market. In the current situation, the focus is on relations between Russia and Ukraine, especially after the escalation that took place over the weekend. Everyone is watching the ongoing negotiations in Turkey. In addition, we should not forget about the situation with tariffs, which is still quite tense.
Gold has been rallying since the opening of the session and has reached the order block. A false breakout of resistance is forming, which could trigger a correction to the zone of interest. The dollar is hitting support, which could form a local correction before continuing its movement. This could also affect the price of gold, which remains bullish in the market.
Resistance levels: 3350, 3365, 3409
Support levels: 3303, 3264
The price has broken out of consolidation, with resistance tested and liquidity above 3350 realized. Relative to the current level, a correction is possible with the aim of retesting support before continuing to rise.
Best regards, R. Linda!
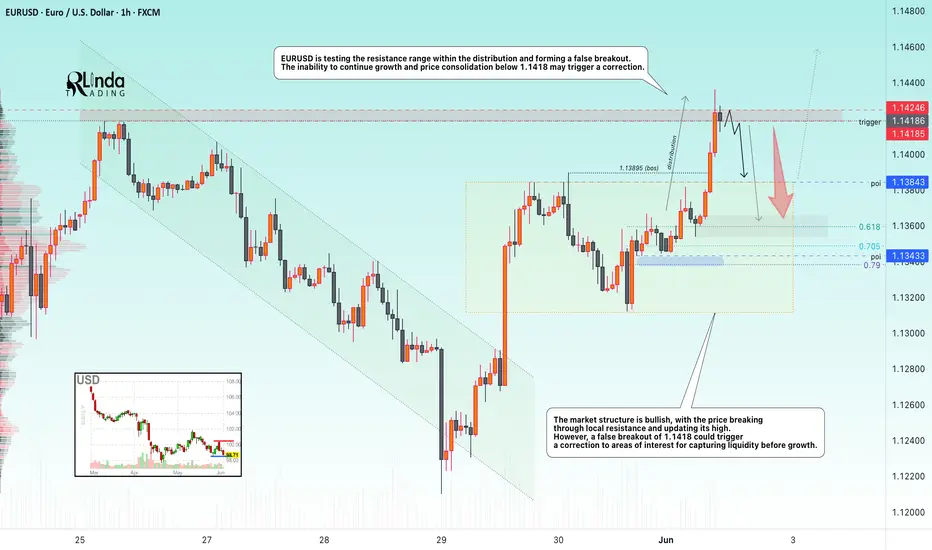
EURUSD → False breakout of resistance. Correction?FX:EURUSD is strengthening amid a decline in the dollar, but the currency pair is encountering strong resistance and forming a false breakout, which could trigger a correction.
EURUSD is testing the resistance range as part of a distribution and forming a false breakout. The market structure is bullish, with the price breaking through local resistance and updating its high. The inability to continue growth and price consolidation below 1.1418 may trigger a correction. The dollar is also hitting support and may form a small correction, which will put pressure on EURUSD
Resistance levels: 1.14246, 1.1418
Support levels: 1.1384, 1.1343
If the currency pair fails to consolidate above 1.14246 during the resistance retest in order to continue its growth, then we can expect price consolidation below this level to open a short position. The correction may reach the specified support zones before continuing its growth.
Best regards, R. Linda!
BTCUSD BUY IDEA-EASY CONFLUENCE PLAY??After reaching an all-time high (ATH) last week, Bitcoin is currently positioned at a pivotal $105,484 at the .23 level according to the Fibonacci trend. It has retraced to previous highs around $105,000 to $106,000. Recently, it bounced off the support level of approximately $102,740 on the 4-hour and daily charts and seems to be forming higher lows. I believe we could see a confluence play that aligns with the previous price action that led to the ATH.

MKR 1W🔍1. Overall Trend:
In the long term, we can see that MKR was in a downtrend, as evidenced by the falling trendline (orange dashed line).
The last candles show that the price has broken this downtrend line - this could indicate a potential trend reversal or at least an attempted upside correction.
📊Support and resistance levels (horizontal chart):
Strong support (red) and resistance (green) levels are marked:
✅ Resistances:
~3,770 USDT – local top, very strong resistance.
~3,079 USDT – previous support, now acting as resistance.
~2,002 USDT – current growth barrier, price is currently struggling with this level.
🔻 Supports:
~1,574 USDT – current local support.
~1,248 USDT – next support, previously tested.
~800 USDT and ~400 USDT – historical accumulation zones, deep support levels.
Oscillators (bottom of the chart):
Stochastic RSI – currently in the upper zone, which may suggest that the market is approaching overbought. Possible correction.
RSI (classic) – oscillates around 50, i.e. neutral, but with a slight upward slope. There is no overbought signal yet.
🧠 Conclusions:
➕ Bullish signals (pro-growth):
Break of the downtrend line (may be the first signal of a trend change).
Formation of a higher low.
Oscillators are not yet in the extreme zone.
➖ Bearish signals (pro-fall):
The price has not yet managed to break the resistance at 2,002 USDT.
Stochastic RSI indicator close to the overbought zone - possible short correction.
📌 Scenarios:
1. Upside scenario:
If the price breaks through the 2,002 USDT level and stays above it, the next target will be the 3,079 USDT level.
Confirmation will be the rising RSI and staying above the trend line.
2. Downside scenario:
If the price fails to break through the 2,002 USDT level and falls below the 1,574 USDT level, a possible test of the 1,248 USDT level or even lower (800 USDT).

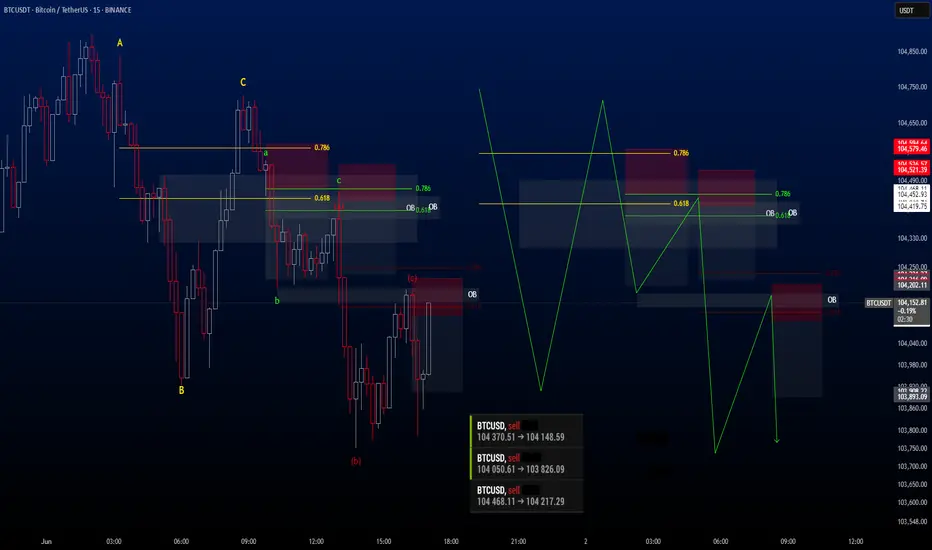
Strategy & Education: Trading with Fibonacci and Order Blocks🔍 Trading Strategy Based on Fibonacci Levels and Order Blocks
This chart showcases three consecutive sell trades I executed on the BTCUSDT pair, each resulting in a profitable outcome. The purpose of this explanation is to demonstrate how Fibonacci retracement levels can be combined with Order Block zones to identify high-probability trade setups.
🧩 The Foundation: Understanding Price Retracement Behavior
The ABC, abc, and (a)(b)(c) structures marked on the chart are not Elliott Waves. Instead, these labels are used to represent simple retracement movements in the market. The focus here is not wave theory, but recognizing how price reacts and pulls back after a move, and how we can benefit from these reactions.
📌 Trade 1: Primary Fibo-OB Confluence
I drew a Fibonacci retracement from the A wave to the B wave.
The price then retraced to the C area, landing between the 0.618 and 0.786 Fibonacci levels, where an Order Block (OB) was also present.
This overlap created a strong technical and structural resistance zone.
I entered the first sell trade from this confluence.
📌 Trade 2: Internal Retracement and OB Alignment
Inside the first corrective move, a smaller abc pattern formed.
I applied Fibonacci again from small a to small b.
The c leg reached the same key Fibonacci zone (0.618–0.786) and overlapped with a second OB.
This confluence offered a second sell entry.
📌 Trade 3: Micro Structure – Same Logic Reapplied
I repeated the exact same logic one more time on a micro (a)(b)(c) structure.
Fibonacci from (a) to (b), price touched 0.618–0.786, coinciding again with an OB.
This became the third and final sell position.
🧠 The Logic Behind the Strategy:
Price doesn’t move in straight lines—it flows in waves. During pullbacks, if Fibonacci levels align with Order Block zones, the market tends to react strongly. My focus here was to identify these areas of confluence in advance and enter trades at high-probability turning points.