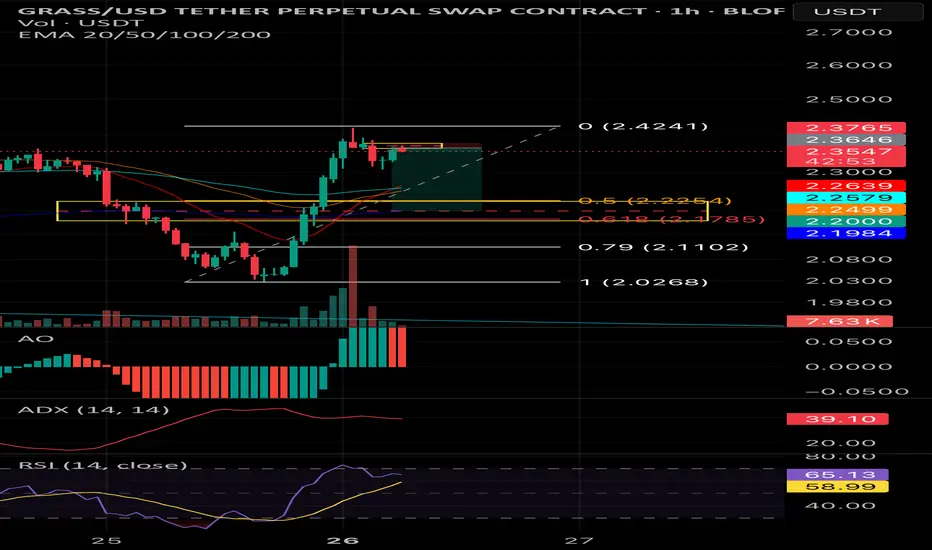
Grass short (scalp)Grass short retesting golden zone of fib 0.5 / 0.618
If we have a rejection in that zone then it can be a new support en we can look for an entry for long position.
Fibonacci Retracement
Equity Research Flash – Hexaware Technologies Ltd.CMP: ₹722.35 | Bullish Momentum Post Trend Reversal
HEXT shows a bullish breakout from a falling trendline, with RSI near 60 and strong volume uptick. The price reclaimed the 0.5 Fibonacci level, eyeing next targets at ₹749.85 (0.618) and ₹793.35 (0.786). Fundamentally strong with robust revenue growth, improving ROCE (26.4%), and low debt. A move above ₹750 could trigger further upside. Accumulate on dips with SL at ₹688.
Recommendation: Positive | Buy on Dips Near ₹700
For Education Purpose only

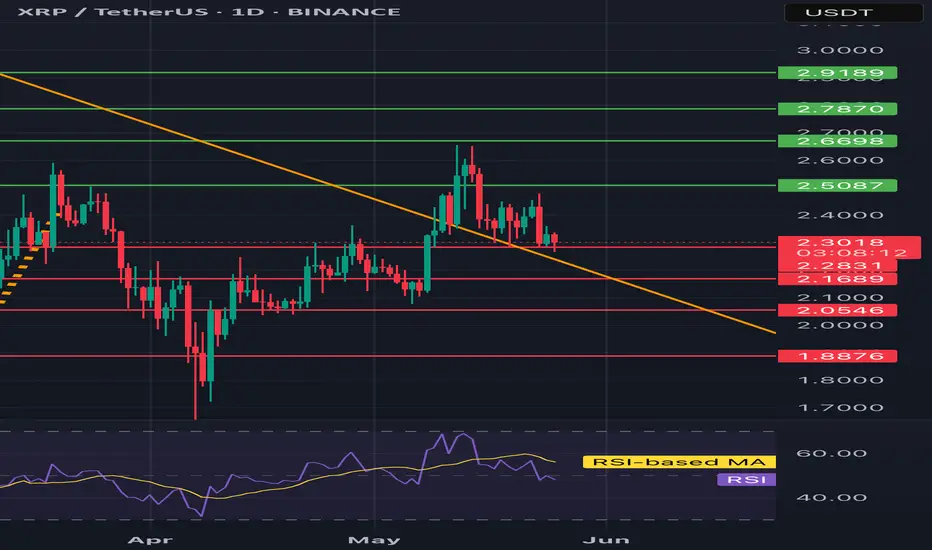
XRP/USDT 1D chart reviewHello everyone, let's look at the 1D XRP chart to USD, in this situation we can see how the price lasts above the downward trend line.
Going further, let's check the places of potential target for the price:
T1 = $ 2.51
T2 = $ 2.67
Т3 = 2.79 $ t4 = $ 2.92
Let's go to Stop-Loss now in case of further declines on the market:
SL1 = $ 2.31
SL2 = $ 2.17
SL3 = $ 2.06
SL4 = $ 1.89
Looking at the RSI indicator, you can see how he reacted and returned to the middle of the range, which creates a place for a panty growth.
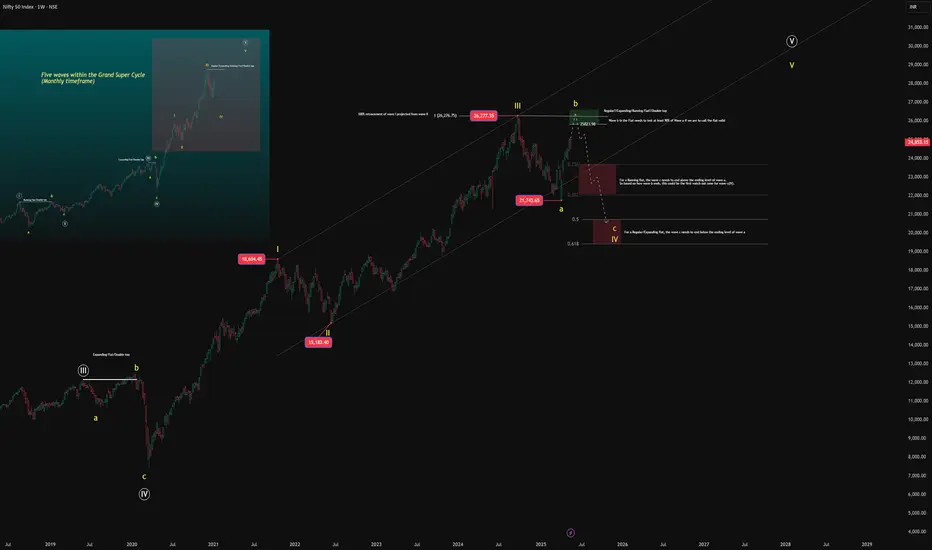
Nifty50 – Wave IV Unfolding Within the Grand SupercycleFrom the Grand Supercycle perspective on the monthly chart, we can observe a consistent pattern — every major a-b-c corrective phase has unfolded as a form of flat correction before the next rally. Based on this historical rhythm, and the current market structure, I believe we are still in the process of completing Wave V of the Grand Supercycle.
This long-term view is overlayed on the chart to help contextualize what’s happening now.
Zooming In – The Weekly Breakdown Within Wave IV and V:
Within this broader Grand Supercycle, the weekly chart captures a five-wave subdivision between Supercycle’s Wave IV and the yet-to-be-completed Wave V.
Wave III has completed after achieving a 100% projection of Wave I from Wave II , respecting classic Fibonacci symmetry.
After the Wave III high, we’ve entered a correction phase , where sub-wave b is currently unfolding.
Flat Correction in Play?
For the current move to qualify as a Flat correction:
Wave b must retrace at least 90% of Wave a .
This requirement is crucial to maintain the “Flat” identity of the structure.
Depending on the nature of the flat:
If it’s a Regular Flat or Expanding Flat, Wave c must break below the bottom of the rising parallel channe l, and end below the low of Wave a .
If it’s a Running Flat , Wave c can stay above Wave a’s low, and price may remain within or near the channel’s lower boundary.
Also, as per EW guidelines, Wave c must unfold in 5 waves — which will be the next key structure to monitor.
Where Are We Now?
As long as Wave b is progressing toward 90% retracement , the near-term bias remains bullish.
But once Wave b completes, the market may enter Wave c, which could result in a deeper correction — either towards the lower end of the channel or even below, depending on which flat structure plays out.
What Next?
This unfolding Wave c will likely complete Wave IV within the Grand Supercycle, setting the stage for the final upward move — Wave V of both the internal 5-wave structure and the Grand Supercycle itself.
Disclaimer: This is not a buy or sell recommendation. The analysis shared is purely my personal view for educational purposes only.
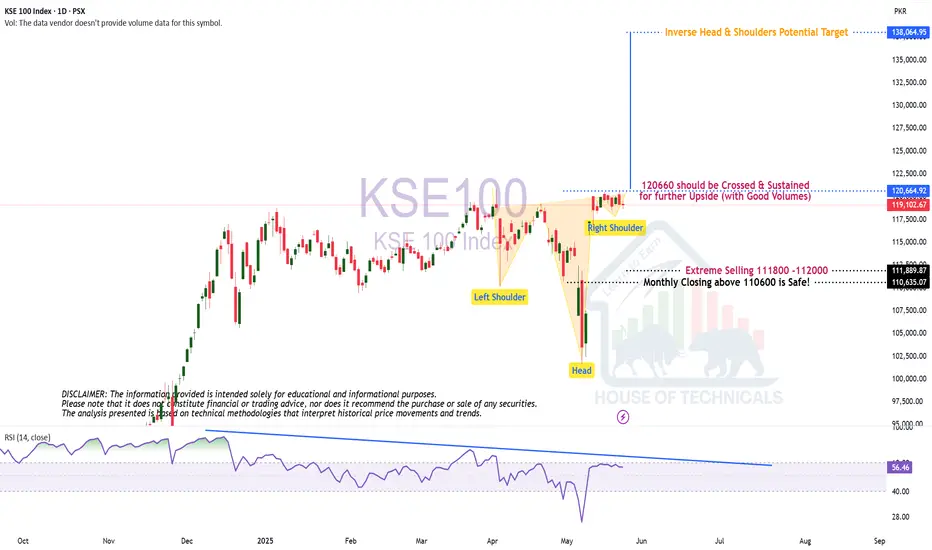
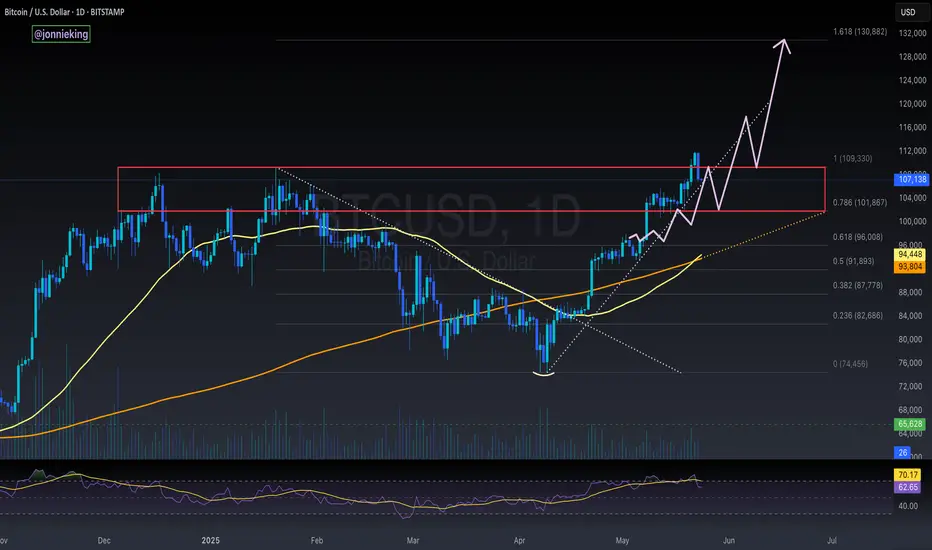
Potential Inverse H&S120660 should be Crossed & Sustained
for further Upside (with Good Volumes)
Inverse H&S Potential Target is around 138000-140000
$BTC to Retest .786 Fib Next ~$102k - BTFD!timberrrrr
the crypto gods shall giveth one last chance.
buy the fckn dip!!!
Smells Like a Trend ReversalWeekly Recap – Gold Market
Monday, May 12, 2025
The week began with a sharp GAP during the Asian session (starting around 1:00 AM London / 8:00 PM New York on Sunday) :
Gold dropped abruptly by $60, from $3,325 to $3,266.
The catalyst was a temporary easing of trade tensions between the U.S. and China, following weekend negotiations that led to a 90-day tariff pause.
During the European session (starting at 8:00 AM London / 3:00 AM New York) , the downtrend continued, pushing the price further down to $3,207.
Tuesday–Wednesday, May 13–14
Between these two sessions, the price consolidated within a narrow range of $3,265 to $3,202 (63 $ range).
Despite better-than-expected U.S. inflation data, there was no significant breakout—the market remained indecisive.
Wednesday, May 14 – European Session
The price continued its descent, falling from $3,243 to $3,168—a $75 drop—indicating persistent downward pressure despite macroeconomic stability.
Thursday, May 15
The Asian session (1:00 AM London / 8:00 PM New York) began quietly, with a range between $3,168 and $3,192.
Then a sharp drop to $3,123 followed (down $71), triggered by new statements from President Trump, who announced potential trade deals with India, Japan, and South Korea.
In the European session (8:00 AM London / 3:00 AM New York) , a strong reversal occurred.
After failed peace negotiations between Russia and Ukraine in Istanbul, and due to growing geopolitical uncertainty plus a weakening dollar, gold surged by $132, from $3,120 to $3,252.
Friday, May 16
The Asian session opened slightly bearish, with gold dipping from $3,252 to $3,218.
However, bullish momentum returned during the European and U.S. sessions, continuing Thursday’s upward trend and adding $51 by day’s end.
📰 Geopolitical News Landscape
India / Pakistan
Since the Kashmir terror attack on May 9, 2025, tensions have escalated again.
Cross-border airstrikes and border closures have resumed. A fragile ceasefire, brokered by the U.S., is under pressure.
Disputes over water rights further strain relations.
➡️ Short-term outlook: high tension remains.
Gaza Conflict
On May 9, Israel launched Operation Gideon’s Chariot against Hamas, aiming to dismantle the group and rescue hostages.
Over 300 deaths have been reported. A leaked plan suggests Gaza will be divided into three heavily controlled zones.
The humanitarian situation is catastrophic (over 53,000 deaths since 2023).
Peace talks are underway in Doha, but the situation remains dire.
➡️ No relief in sight.
Russia / Ukraine
Direct talks were held in Istanbul for the first time in three years.
While a prisoner exchange (1,000 each side) took place, no substantial progress was achieved.
Russia demands Ukrainian troop withdrawals from contested areas—Kyiv refuses.
Simultaneously, Russian attacks intensified, including drone strikes on Sumy.
➡️ A ceasefire remains unlikely in the near term.
U.S.–China Trade War
A 90-day tariff pause was announced the weekend before May 12:
U.S. tariffs cut from 145% to 30%
Chinese tariffs reduced from 125% to 10%
Markets reacted positively at first—especially in retail and shipping sectors.
➡️ However, unresolved structural issues (e.g., tech transfers, export controls) keep tensions fragile.
No comprehensive deal is in sight.
⚖️ Trump vs. Powell
Tensions escalate between President Trump and Fed Chair Jerome Powell:
- Trump demands aggressive rate cuts
- Powell warns of inflation risks
- The Fed holds the interest rate steady at 4.25–4.5%
- A 10% staff reduction is planned at the Fed for “efficiency”
➡️ The growing political interference is increasing market instability.
📉 U.S. Inflation – April 2025
The official inflation rate dropped to 2.3%, the lowest since February 2021.
However, consumer inflation expectations soared to 7.3%, the highest since 1981.
The University of Michigan Consumer Sentiment Index fell to 50.8—a historic low.
➡️ A clear gap between perception and data is emerging.
📊 Technical Analysis – Short-Term
Since May 12, an open GAP exists between $3,289 and $3,325 (36 $ range)
A V-shaped reversal formed from the low on May 15 ($3,120) to the Friday close ($3,204)
Symmetrical triangle formation suggests a convergence around $3,284 (possible by Tuesday)
➡️ Current trading range: $3,172 to $3,285 (113 $ range)
💡 Outlook for Monday, May 19
Time-Zone-Based Expectations:
Asia session (starting 1:00 AM London / 8:00 PM New York Sunday):
👉 Potential retest of $3,154
Europe session (8:00 AM London / 3:00 AM New York):
👉 Bullish outlook toward $3,234
U.S. session (2:30 PM London / 9:30 AM New York):
👉 Possible continuation of bullish move — open-ended potential
📌 Trade Setup – Monday 8:00 AM (London) / 3:00 AM (New York)
If price is below $3,154 → I stay flat and wait for clear signals
If price is above $3,172 → I consider a long position, unless conflicting news emerges
🎯 Weekly Target
My goal for the week is $3,348, provided the U.S. Dollar Index (DXY) holds near the 100-point level.
🧠 Conclusion
I am increasingly convinced that news-driven trading delivers the best results—if one can properly interpret the signals.
🔢 Fibonacci Levels
1h chart: low $3,131 → high $3,500 (April 22)
Levels: 0.315, 0.382, 0.5
1h chart: low $3,131 → high $3,435 (May 6)
Levels: 0.315, 0.382, 0.5
1h chart: low $3,131 → high $3,252 (May 16)
Levels: 0.315, 0.382, 0.5
-------------------------------------------------------------------------
This is just my personal market idea and not financial advice! 📢 Trading gold and other financial instruments carries risks – only invest what you can afford to lose. Always do your own analysis, use solid risk management, and trade responsibly.
Good luck and safe trading! 🚀📊

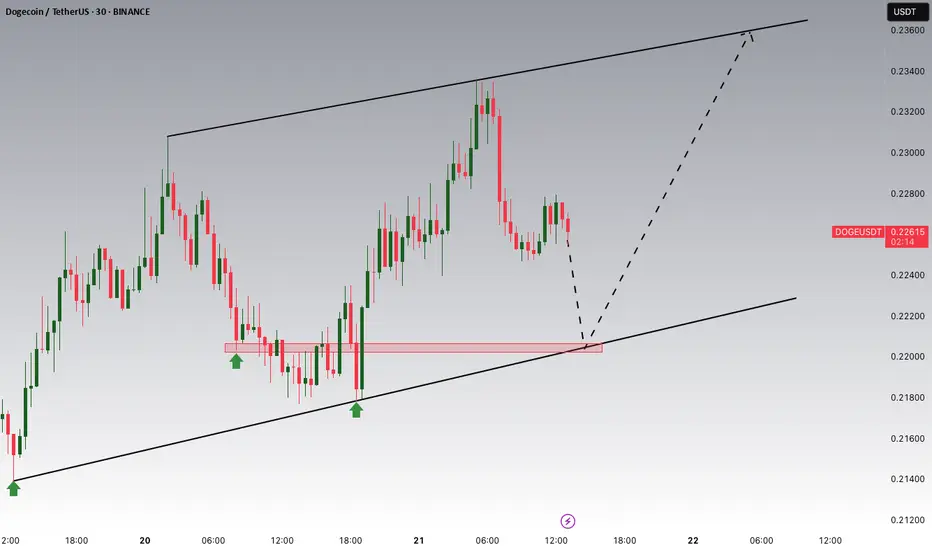
DOGE/USDT Potential UpsidesHey Traders, in today's trading session we are monitoring DOGE/USDT for a buying opportunity around 0.22000 zone, DOGE/USDT is trading in an ascending channel and currently is in a correction phase in which it is approaching the ascending channel support.
Trade safe, Joe.
GBPJPY Bulls wake Up! Clean swing buy opportunity ahead! Price after the recent swing high as indicated on the chart (yellow circles)
It has since retraced to to 61.8 retracement level and has rejected with one bullish candle and currently rejecting again. There is a high probability to see some buy pressure ahead of next weeks trading sessions to the up side to target of 195.78 and beyond.

GOLD → Consolidation amid a bullish trendFX:XAUUSD is trading in consolidation. As expected, the retest of the 3290 support level will end with a strengthening. The price is heading towards the resistance of the range.
The dollar is falling, which is supporting gold. The local trend is set by the fundamental background. The price of gold is strengthening and heading towards the resistance of the trading range, with the zone of interest being the liquidity located above 3346. The fundamental background is on the buyers' side, but since today is Friday, there is no strong news and the market is unlikely to seek a breakout from consolidation due to the lack of a driver. Thus, we can expect a correction from resistance before growth resumes, which may form next week.
Resistance levels: 3346, 3360
Support levels: 3308, 3290, 3282
Consolidation after the break of the local downtrend amid a falling dollar means that bulls are building up potential before a possible continuation of growth. But at the moment, an intraday trading strategy can be considered.
Best regards, R. Linda!

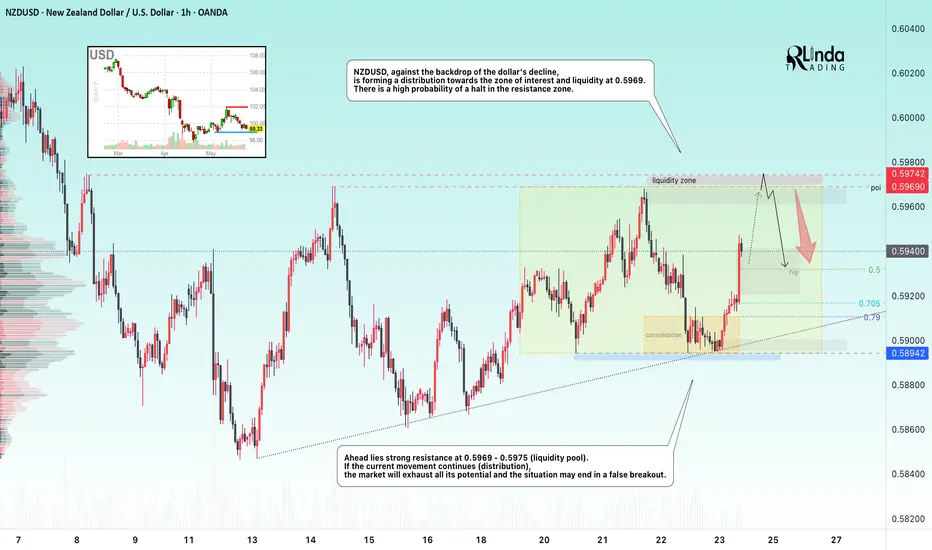
NZDUSD → A retest of resistance may end in a false breakout.FX:NZDUSD bounces off the upward support line and forms a distribution towards the liquidity zone located above 0.597...
Strong resistance lies ahead at 0.5969 - 0.5975 (liquidity pool). If the current movement continues (distribution), the market will exhaust all its potential and the situation may end in a false breakout. There is no trend as such in the market, the price is inside the flat, and thus bearish pressure may resist the upward price movement.
Resistance levels: 0.5969, 0.5974
Support levels: 0.5932, 0.5917
Against the backdrop of a falling dollar, the currency pair is likely to continue its growth and may test 0.5969 in the short term, but based on the nature of the movement, we can assume that a downward correction will follow.
Best regards, R. Linda!
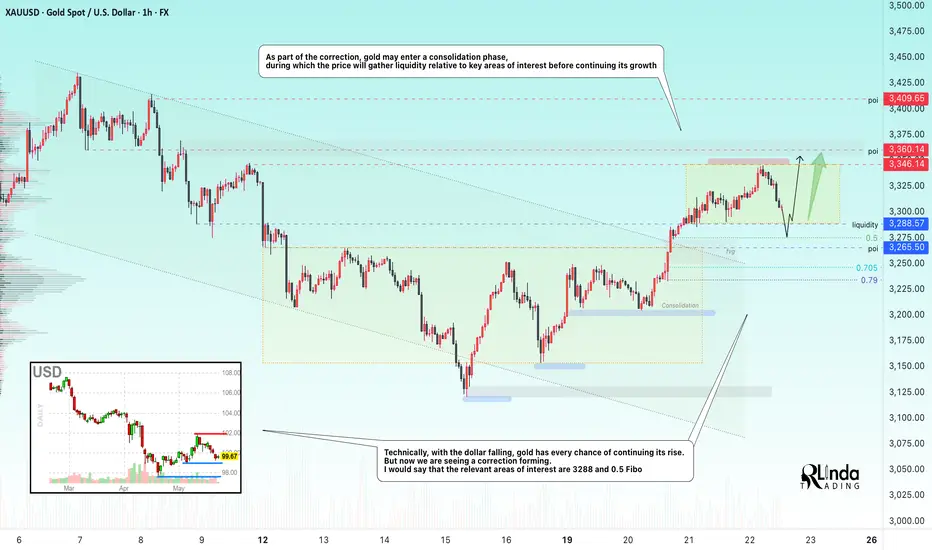
GOLD → Consolidation (correction) ahead of newsFX:XAUUSD is testing resistance at 3346 and forming a correction, leaving liquidity above the level as the current target. The correction was influenced by the dollar. What can we expect next?
Gold is rising for the fourth day in a row and is approaching $3350, awaiting US PMI data. The dollar remains weak amid geopolitical risks, US-China disputes, and concerns about the US budget. The passage of Trump's tax bill could increase the deficit and pressure on the dollar. Weak PMI data could support gold by heightening expectations of a Fed rate cut
Technically, with the dollar falling, gold has every chance of continuing its rise. But now we are seeing a correction forming. I would say that the relevant areas of interest are 3288 and 0.5 Fibo
Resistance levels: 3346, 3360, 3409
Support levels: 3288, 3275, 3265
As part of the correction, gold may enter a consolidation phase, during which the price will gather liquidity relative to key areas of interest before continuing its growth. A retest and false breakout of 3288 - 3275 is possible before the growth continues.
Best regards, R. Linda!
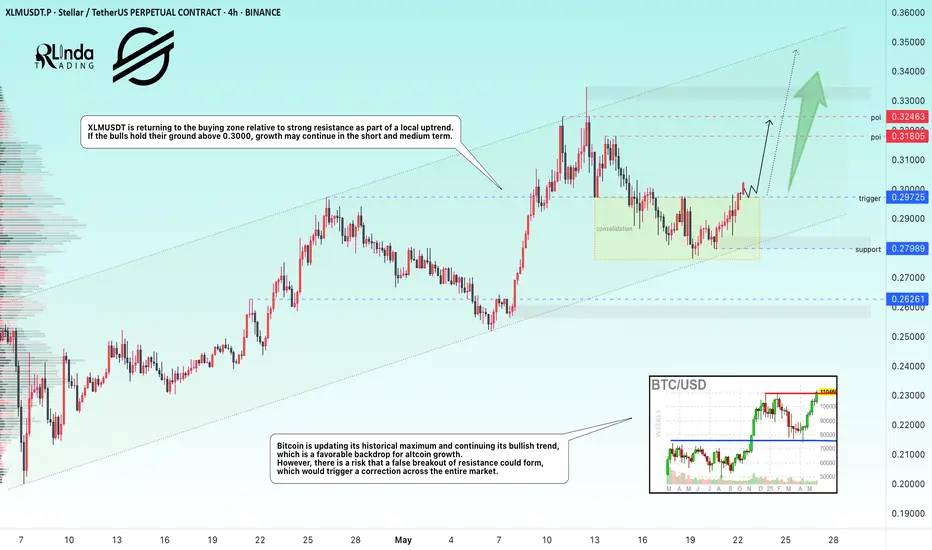
XLMUSDT → Consolidation above 0.300 will provide an opportunityBINANCE:XLMUSDT.P is returning to the buying zone relative to strong resistance as part of a local uptrend. The market backdrop is favorable, but Bitcoin poses risks...
Bitcoin is updating its historical high and continuing its bullish trend, which is a favorable backdrop for altcoin growth. However, risks are posed by the fact that BTC may form a false breakout of resistance, which would trigger a correction across the entire market.
XLMUSDT is returning to the buying zone relative to strong resistance as part of a local uptrend.
If the bulls hold their ground above 0.3000, growth may continue in the short and medium term.
Resistance levels: 0.318, 0.324
Support levels: 0.300, 0.2975, 0.2799
The focus is on 0.3000, which is a fairly important and key (psychological) level. If the bulls manage to hold their ground above this point, the price will continue to rise, but it is necessary to monitor the behavior of the bitcoin.
Best regards, R. Linda!
NZDJPY → Pre-breakdown consolidation. Readiness for a declineFX:NZDJPY is under pressure from a global downtrend. Locally, a flat (range) and pre-breakdown consolidation relative to support are forming on the chart...
After a false breakdown of support on May 16, the price failed to reverse and grow. Instead, the currency pair entered a consolidation phase, during which it continues to test support. Each subsequent retest of 85.25-85.30 only increases the chances of a breakout with the aim of continuing the decline. Another important nuance is the elimination (short squeeze) of local resistance at 85.95.
Pressure on the price is also being exerted by the falling dollar index, which is strengthening the Japanese yen, which is generally reflected in the price of NZDJPY...
Support levels: 85.300, 85.25, 84.195
Resistance levels: 85.7, 85.95
The continuation of the current consolidation and the compression of the price towards support only increases the chances of a breakdown of the 85.30 support level. A break and consolidation of the price below 85.25 could trigger a further decline.
Best regards, R. Linda!

BTC traffic update and channel exit.As we can see, the BTC price is moving according to the previously mentioned rules. Here we can see how the price left channel number 1 at the top, and the increase after leaving the channel gave an upward movement at the level of the height of the channel itself.
In this situation, it is worth paying attention to channel number 2, from which we also previously got an exit at the top with a strong upward movement, currently we can see how the price is fighting with strong resistance at the level of $ 111,500, however, taking into account the height of channel number 2, we can mark the level of around $ 121,500 as another very strong resistance.

SUI — Breakout or Breakdown? Long & Short SetupsSUI has been trapped in a trading range for the past 6 days, consolidating between key levels and building up liquidity for the next big move. When price goes quiet like this after an impulsive structure, it’s not time to trade—it’s time to observe, analyse, and prepare.
So, where’s the next high-probability setup?
Let’s break it down:
🔹 Elliott Wave Context
From my previous SUI analysis, I identified a completed 5-wave impulse structure. After such a move, a corrective ABC pattern is typically next.
SUI has been respecting technical levels with surprising accuracy throughout this cycle—especially Fibonacci levels and key horizontal zones.
📉 ABC Correction in Progress?
Wave A appears to be completed, and Wave B was rejected at the yearly level in perfect confluence with the golden pocket (0.618–0.666) retracement of Wave A. This strongly suggests that Wave C is now unfolding.
Using the 1:1 trend-based Fib extension, the projected Wave C target lands at:
➡️ $3.6413
Let’s dig deeper—does this level hold up under further scrutiny?
🔍 Multi-Layered Confluence at $3.56–$3.64
Here’s what aligns at this potential support zone:
1:1 Fib extension (Wave A = Wave C) → $3.6413
0.55 Fib retracement (from $3.1132 to $4.2967) → ~$3.64
Volume Profile POC from prior range → ~$3.59
0.618 Fib retracement → $3.5653
Weekly level → $3.5594
21-Day EMA → $3.5537
21-Day SMA → $3.6319
0.75 Fib Speed Fan (if hit on May 16) → aligns with zone
This stack of levels gives us a tightly packed, high-conviction support area between:
📍 $3.56 – $3.646
___________________________________
🟢 Long Setup Idea:
Entry Zone: Ladder entries between $3.56 and $3.75
Stop-Loss: $3.4546 (beneath confluence zone)
Take-Profit Target: $4.588 (0.786 Fib retracement + -0.236 Fib extension)
R:R: ~5:1
🚫 Invalidation: If SUI reclaims the yearly level at $4.1152 before revisiting this support, the setup is invalidated.
🔴 Short Setup Idea:
If SUI pushes into the 0.786 Fib retracement at $4.588 and shows clear rejection (e.g., SFP, bearish engulfing, high-volume reversal), a short can be considered.
Entry: On rejection at $4.588
Stop-Loss: ~$4.714
Targets:
TP1: $4.325 (recent highs)
TP2: $4.1152 (yearly level)
🧠 Final Thoughts:
This is where trading becomes a game of patience. I’ve mapped both long and short setups based on structure, confluence, and price behaviour. Now it’s about waiting for price to come to your levels.
⏰ Alarms set.
📈 Let the chart do the work.
More updates to come as the range resolves. Stay sharp!
___________________________________
If you found this helpful, leave a like and comment below! Got requests for the next technical analysis? Let me know.

S&P ES Long setup target 5963.50 / Calls SPY target 596Fibonacci technical analysis : S&P 500 E-mini Futures CME_MINI:ES1! has already found support at the Fib level 78.6% (5623.50) of my Down Fib. Last Daily candle (May 2) has closed above retracement Fib level 78.6%. My Down Fib guides me to look for CME_MINI:ES1! to eventually go up to hit first target at Fib level 127.2% (5963.50).
CME_MINI:ES1! – Target 1 at 127.2% (5963.50), Target 2 at 161.8% (6205.50) and Target 3 at 178.6 (6322.75)
Stop loss slightly below the 61.8% retracement Fib level (5506.25).
Option Traders : My AMEX:SPY chart Down Fib shows price to go up to Target 1 at 127.2% (595.82), Target 2 at 161.8% (620.50) and Target 3 at 178.6 (632.50)
Stop loss slightly below the 61.8% retracement Fib level (549).
Enjoy the trading process and take time to smell the roses🌹

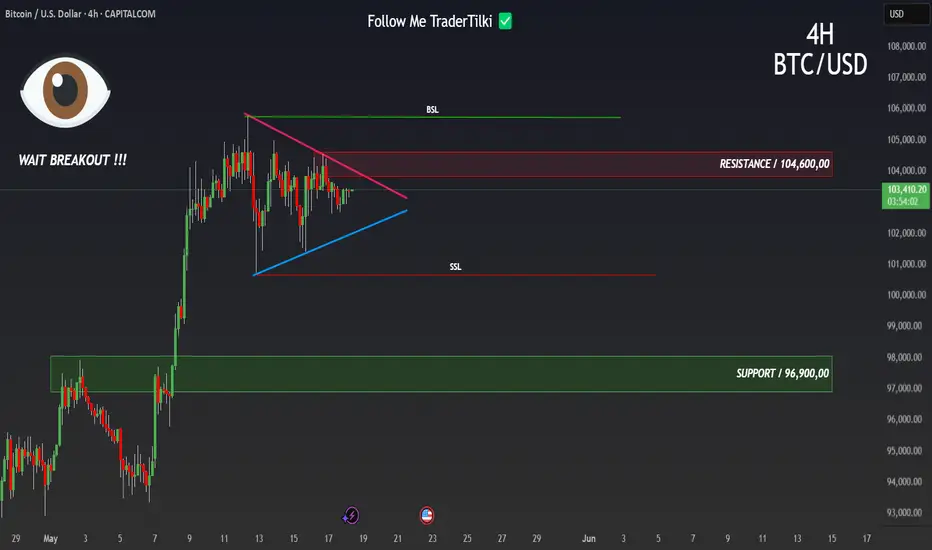
BTCUSD / BITCOIN | 4H | WAIT BREAKOUT Good morning, my friends
Bitcoin support level is $96,900.00, while the resistance level stands at $104,600.00.
Right now, I'm just waiting for an upward breakout. Once that happens, I'll provide a clear target.
Don't forget to hit the like button so you don't miss any updates on this analysis.
My dear friends, your likes are the biggest motivation for me to keep sharing my analyses. I truly appreciate everyone who supports my work with their likes—thank you so much!
With respect and love.
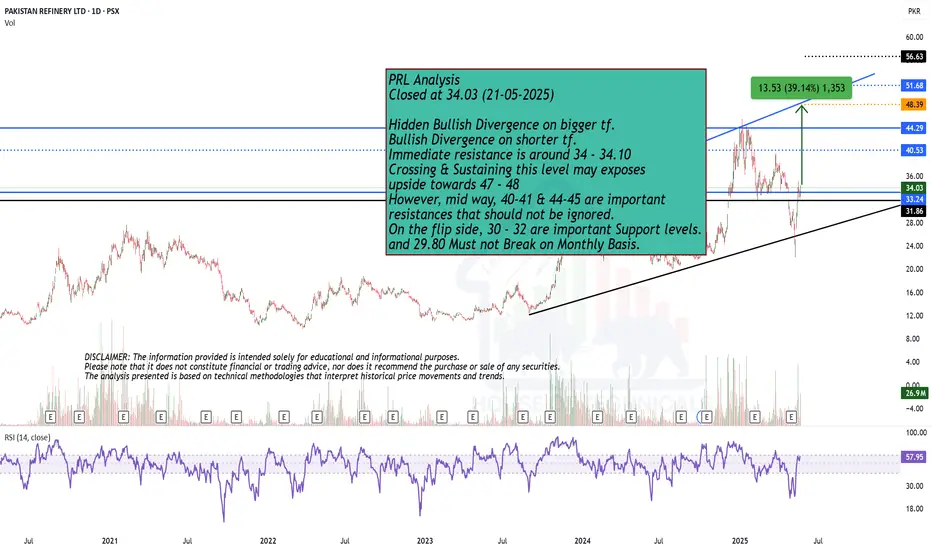
Bullish
Closed at 34.03 (21-05-2025)
Hidden Bullish Divergence on bigger tf.
Bullish Divergence on shorter tf.
Immediate resistance is around 34 - 34.10
Crossing & Sustaining this level may exposes
upside towards 47 - 48
However, mid way, 40-41 & 44-45 are important
resistances that should not be ignored.
On the flip side, 30 - 32 are important Support levels.
and 29.80 Must not Break on Monthly Basis.
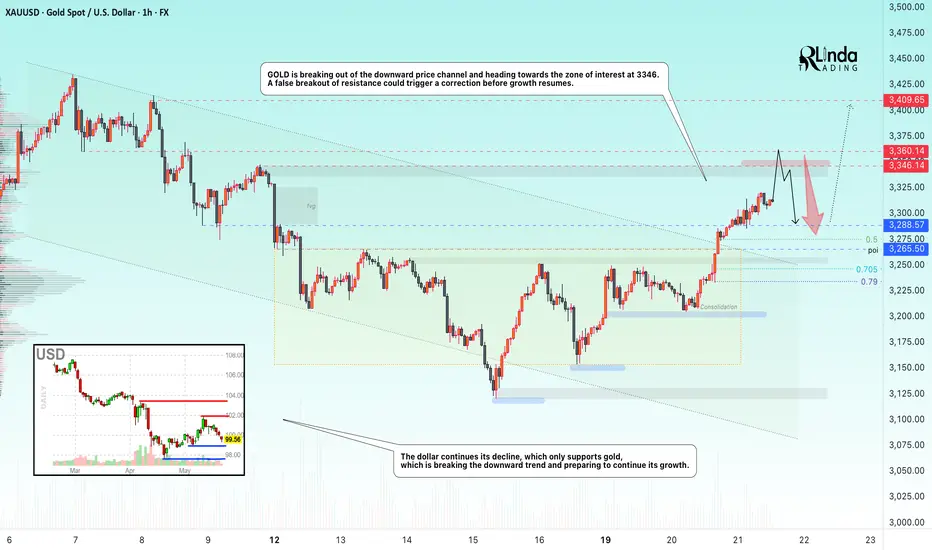
GOLD → Breaking of the downward trend structure...FX:XAUUSD is breaking out of the downward price channel and heading towards the zone of interest at 3346. A false breakout of resistance could trigger a correction before growth continues.
Gold is rising for the third day in a row and trading above $3,300 amid a weakening dollar and heightened geopolitical tensions. Investors are seeking refuge due to concerns about US fiscal policy, trade disputes with China, and a possible Israeli strike on Iran. Gold is also supported by expectations of a Fed rate cut and weak prospects for the dollar.
Technically, the price is heading towards the order block and resistance at 3345-3360. Since the opening of the session, the price has exhausted all its potential, and a retest of the key level may end in a false breakout and correction. However, based on the fundamental background, gold's growth may continue after the correction...
Resistance levels: 3346, 3360, 3409
Support levels: 3288, 3265, 3245
Gold has returned to the buy zone, but the fundamental background is unstable, and any weakening of economic risks could send gold back south. At the moment, the focus is on 3346-3360, with a false breakout likely to trigger a correction.
Best regards, R. Linda!
DOTUSDT Potential UpsidesHey Traders, in today's trading session we are monitoring DOTUSDT for a buying opportunity around 4.20 zone, DOTUSDT is trading in an uptrend and currently is in a correction phase in which it is approaching the trend at 4.20 support and resistance area.
Trade safe, Joe.

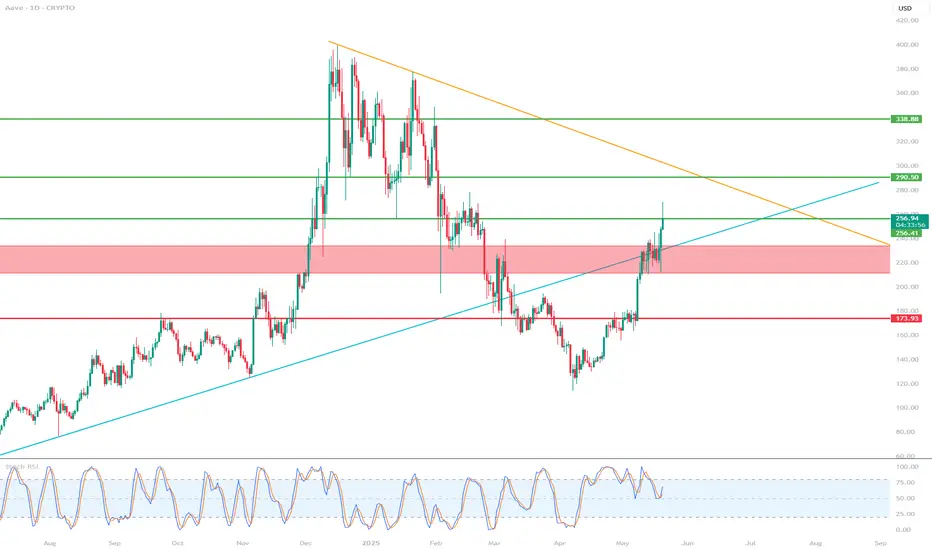
AAVEUSD 1D ChartHello everyone, I invite you to review the current situation of AAVE in the USD pair. When we enter the one-day interval, we can see how the AAVE price will see a return above the main upward trend line, but here we can see that we are still below the formed downward trend line, which in the event of further increases may prove to be a strong resistance.
Here we can see how the current rebound is fighting the resistance at $ 256, only when the level is positively tested, resistance will be still visible at the price of $ 290, this will be a strong resistance right next to the downward trend line, only a positive exit from the top and staying above this trend line can lead to movement towards resistance at $ 339.
Looking the other way, we can see that when the trend reverses, we first have a support zone from $ 233 to $ 211, however, if this zone is broken, we can see a quick return of the price to the support area at $ 174.
The Stoch RSI indicator shows that despite the current upward movement, there is still room for the upward movement to continue.
Breakout Done
Closed at 174 (20-05-2025)
Breakout done.
Weekly closing above 169 would
be a positive sign.
It may retrace up till 168 & then
may be around 158 / 150
Upside resistance is around 189 - 190
& then around 220.
