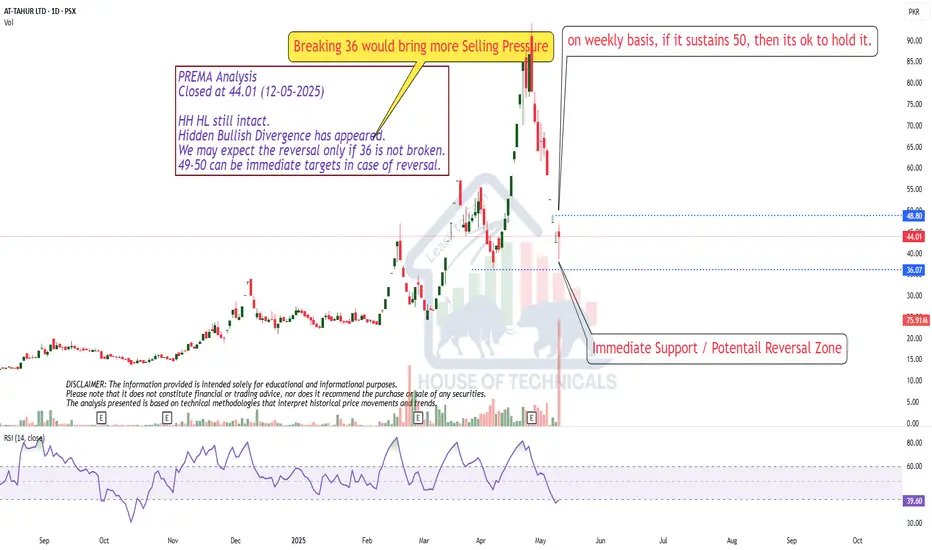
HH HL still intact.
HH HL still intact.
Hidden Bullish Divergence has appeared.
We may expect the reversal only if 36 is not broken.
49-50 can be immediate targets in case of reversal.
Fibonacci Retracement
GOLD → Correction ahead of news. Will the decline resume?FX:XAUUSD has been buying back all the losses from the Asian and Pacific sessions since the opening of the European session, but this looks more like a catapult being loaded...
GOLD broke through the global consolidation base of 3200, which only confirmed the bearish market structure. Investors are waiting for PPI and retail sales data in the US, as well as Fed Chair Powell's speech.
Expectations of fewer Fed rate cuts and optimism surrounding trade talks with China and South Korea continue to weigh on gold. However, weak macro data and a growing US budget deficit could revive interest in this safe-haven asset.
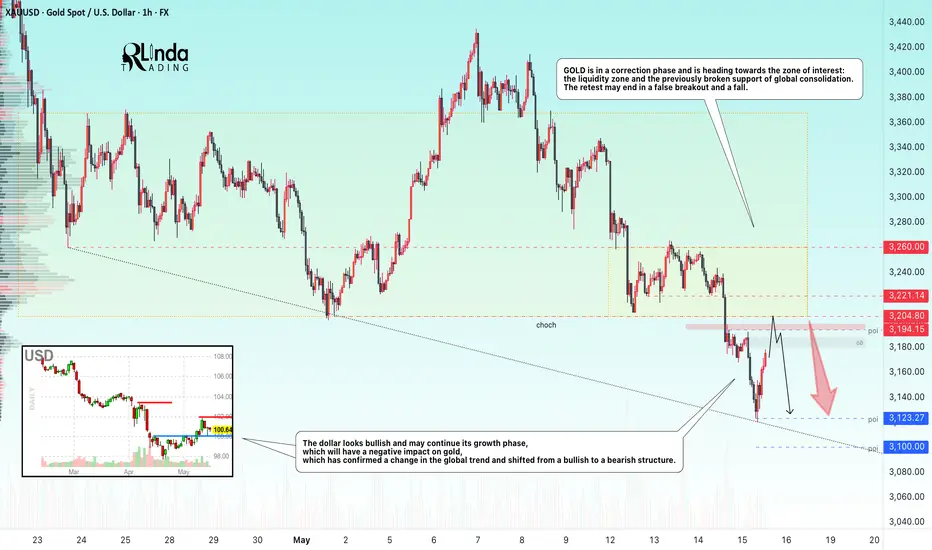
GOLD is in a correction phase and is heading towards the zone of interest: the liquidity zone and previously broken support of global consolidation.
Resistance levels: 3187-3190, 3200
Support levels: 3123, 3100
Gold may test the indicated resistance, but based on the nature of the market, this situation may end in a false breakout and a fall. Target 3123 - 3100.
However, unpredictable data may temporarily change the market, which could lead to momentum towards 3220-3230.
Best regards, R. Linda!
ETHEREUM → Consolidation. Which way will the distribution go?BINANCE:ETHUSDT.P has moved into a consolidation phase after the distribution phase. Focus on the 2414-2725 range. A retest of support is possible during the current phase. Despite the bullish trend, there are risks of a reversal...
ETH has been a fairly unprofitable project over the past few years, with the price hitting one bottom after another. While Bitcoin and altcoins were flying high, ETH has only shown itself to be a bull in the last few days.
In the current phase, the focus is on the consolidation boundaries, as well as the 2550 level. If the bulls keep the market above 2550, then the coin could strengthen to 2725, which would be a positive sign for us that buyers are interested in continued growth.
If ETH continues its correction towards support at 2414, then we will need to monitor the market's reaction to this level. I remain skeptical about ETH due to its weak long-term performance despite a strong fundamental backdrop.
Resistance levels: 2550, 2725
Support levels: 2414, 2260
Further movement will determine the price's exit from consolidation: a breakdown of support means a fall, a breakout of resistance means growth. But the current scenario is trading within the range. If ETH trades near 2725 and forms a pre-breakout consolidation, then we will have a chance for growth.
The opposite scenario is if the price falls below 2550 and begins to test 2414. In this case, sticking to the support level and numerous retests will indicate that the bull market has exhausted its strength and we can expect a correction to 2260-2065.
Best regards, R. Linda!

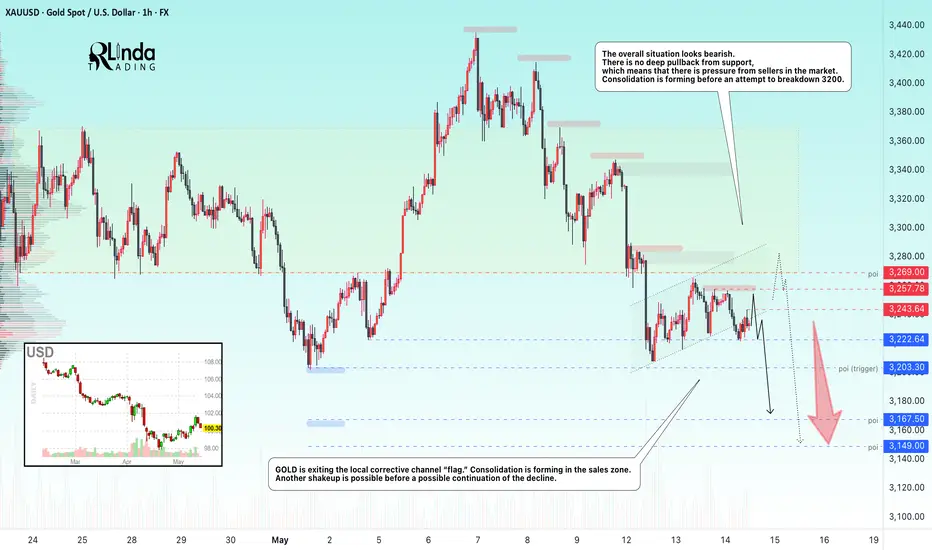
GOLD → One step away from a bullish trend reversalFX:XAUUSD is emerging from the local corrective channel “flag.” Pre-breakdown consolidation relative to the base of the reversal pattern continues. All eyes are on 3200...
Gold is losing ground amid trade optimism and a strong dollar. The price is falling at the start of Wednesday as traders take profits after a rise from weekly lows. Weaker-than-expected US inflation has not justified expectations, but the Fed's refusal to cut rates soon is weighing on the metal. Optimism surrounding new trade agreements between the US and China, the UK, and other countries, as well as hopes for peace talks between Russia and Ukraine, are reducing demand for gold as a safe-haven asset.
Technically, the overall situation looks bearish. There is no deep pullback from support, which means pressure from sellers in the market. Consolidation is forming before an attempt to break through the 3200 level.
Resistance levels: 3243, 3257, 3269
Support levels: 3222, 3200
If the price continues to consolidate in the current local range and continues to attack support at 3222-3200, then in the short and medium term, we can expect the decline to continue. However, knowing the tricks of MM, the price may form a short squeeze relative to local resistance zones before falling further.
Best regards, R. Linda!
NZDJPY → Countertrend correction and false breakoutFX:NZDJPY is testing resistance within a global downtrend. The currency pair is not yet ready to continue its growth and is forming a local reversal pattern.
Within the global downtrend, the currency pair is forming a countertrend correction and testing resistance at 87.400. The liquidity pool formed above this level is not yet ready to let the price move further. Without the possibility of continuing growth, the price returns to the range and forms a false breakout of resistance. However, since we are in the range and the price has returned inside it, if the bears hold the line (the upper limit of the trading range) at 87.400, this could trigger a further decline, thereby continuing the global downtrend.
Resistance levels: 87.400
Support levels: 86.5, 85.26
Consolidation of the price below 87.400 will confirm that the price is not yet ready to continue the trend. The falling dollar index is provoking a rise in the Japanese yen, which may also put pressure on the currency pair.
Best regards, R. Linda!

Inverse H&SBeautiful Inverse H&S pattern in place.
Sustaining 42 may lead it towards 48 & then 50 - 54.
39 - 40 can be an immediate Support.
However, breaking 36 may bring more Selling pressure.

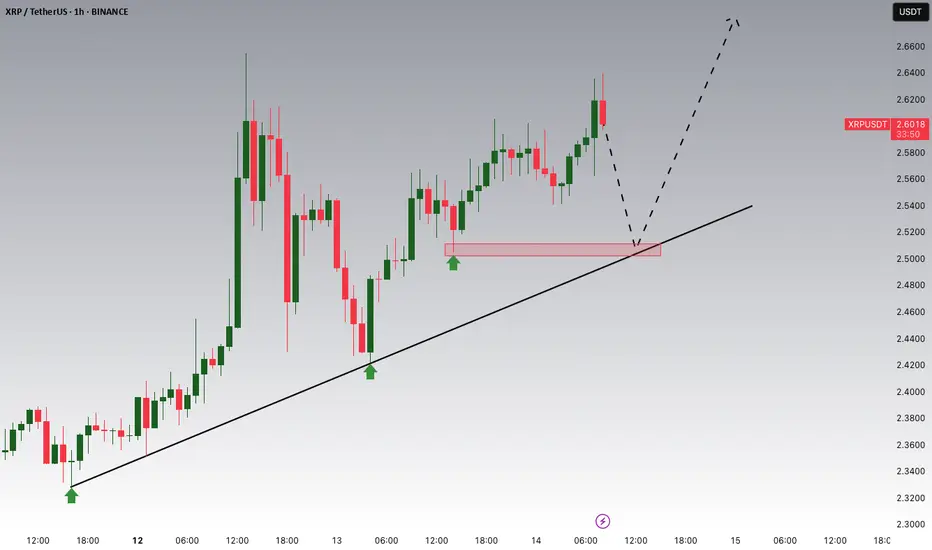
Ripple Potential UpsidesHey Traders, in today's trading session we are monitoring XRP/USDT for a buying opportunity around 2.50 zone, XRP/USDT is trading in an uptrend and currently is in a correction phase in which it is approaching the trend at 2.50 support and resistance area.
Trade safe, Joe.
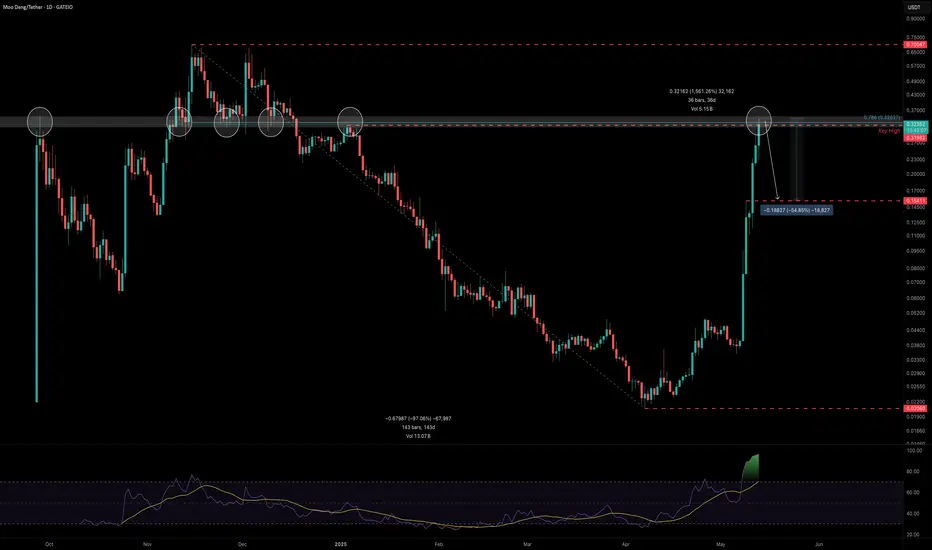
MOODENG Up 1561% — Is a 50% Crash Next?MOODENG has gone full parabolic — launching from $0.0206 to $0.34 in just 36 days. That’s a staggering +1561% gain. But after a move this vertical, it’s time to ask the real question: can it sustain this pace… or is a correction looming?
Let’s break it down.
Technical Snapshot
MOODENG just tapped a major resistance zone — the 0.786 Fibonacci retracement (log scale) of the entire bear trend from $0.70 down to $0.0206. That drawdown was a brutal -97% over 143 days, defining the last macro bear cycle. The current rally has now retraced almost 80% of that decline.
And now? It’s knocking on exhaustion’s door.
RSI Screaming Hot
The RSI on the daily chart is currently at 96 — a level rarely sustained for long. Historically, these readings lead to sharp corrections as early bulls take profit and late buyers get trapped.
Key Structure:
The key swing high at $0.31982 was just taken out, possibly as a liquidity grab.
Price is now hovering at this level — hovering… or topping?
Potential Retracement Zone
If MOODENG enters a standard corrective phase, the $0.15411 level stands out. — it lines up as a logical 50–61.8% retracement zone from the recent parabolic leg. A return to that level would mean a -50%+ crash from current highs.
Short Trade Idea (On Confirmation Only)
Entry: Break below $0.32 and retest it as resistance
Stop-Loss: Above $0.34 (structure invalidation)
Target: $0.15411 (0.618 Fib retracement)
R:R: 7:1+
This setup requires patience. Don’t front-run it — let price lose $0.32 with conviction and treat a clean retest as your trigger.
📘 Bonus Insight:
Whenever you see extreme RSI paired with major Fib levels (like 0.786), you’re likely looking at the exhaustion phase of a move — especially when paired with psychological price levels and historical resistance. That’s where smart money exits… and emotional money enters.
🧠 Educational Note: Why You Should Be Cautious with Parabolic Moves
These kinds of explosive rallies are exciting, but they’re often unsustainable. When price goes vertical and indicators like RSI hit extreme levels, smart money starts exiting — and emotional money starts chasing.
Parabolic moves often end with sharp, sudden crashes. Chasing these tops may feel tempting, but more often than not, it leads to losses. The real edge comes from waiting — for structure, confirmation, and setups with defined risk. Don’t trade hype. Trade the chart.
Summary
MOODENG up +1561% in just over a month
Tapped the 0.786 Fib of its entire macro downtrend
Daily RSI at 96 → overheated
Break & retest of $0.32 = ideal short setup
Targeting a possible -50% correction to $0.15411
Keep your emotions out of it — parabolic runs like this are exciting, but it’s discipline that gets you paid. Let price confirm. Then strike. 📉🔥
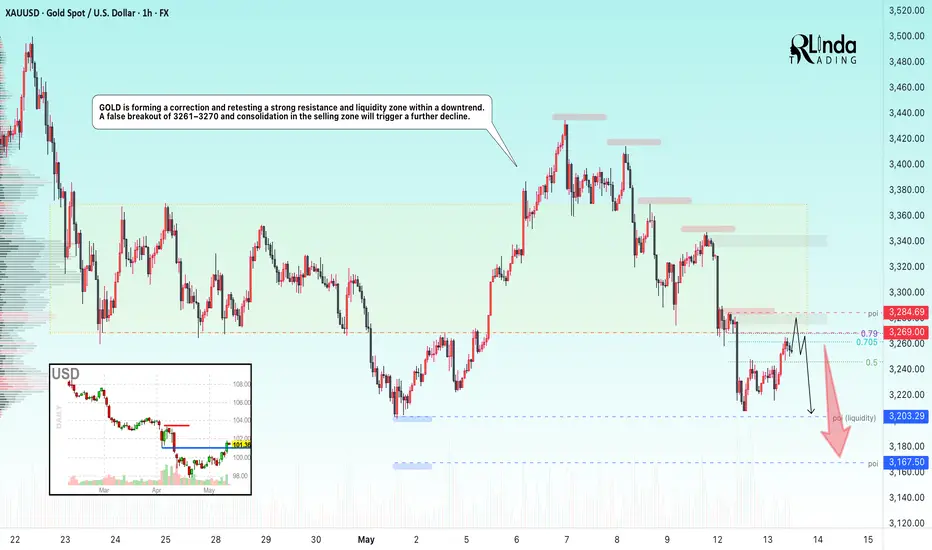
GOLD → Retest resistance before fallingFX:XAUUSD is forming a correction and retesting a strong resistance and liquidity zone within a downtrend. The global trend is one step away from a reversal...
Gold stabilized ahead of the release of US inflation data. After falling 3%, gold is holding steady at around $3,200, consolidating against a weaker dollar. Investors are awaiting US CPI data, which could set a new direction.
Optimism about the US-China trade agreement, geopolitical détente, and profit-taking on the dollar are holding back the price decline. The market is assessing how inflation data will affect Fed policy and demand for safe-haven assets.
Globally, the market doubts that the upward trend will continue, and there are reasons to look for points from which the price could start to fall sharply...
Resistance levels: 3269, 3284
Support levels: 3246, 3200, 3167
The news may cause a shake-up, but if there are no surprises, a false breakout of 3260-3270 and consolidation of prices in the selling zone could trigger a decline to 3200-3150.
Best regards, R. Linda!
SUIUSDT → False breakdown of support before growthBINANCE:SUIUSDT has entered a consolidation phase within a bullish trend. The chart shows a zone of interest and a trigger area that are worth paying attention to...
The coin looks quite positive. An upward trend is forming, which is also supported by the growth of Bitcoin and a relatively positive fundamental background.
Technically, SUI is consolidating between 4.110 and 3.811. Below the support level, a huge liquidity pool has formed, which has not yet been tested. There is a high probability of a false breakdown before the growth continues, but if the market turns out to be more aggressive, buyers may not let the price fall to 3.811, in which case we can consider a breakout of the resistance at 4.11-4.275 and consolidation of the price above these levels with the aim of continuing growth.
Support levels: 3.811, 3.667
Resistance levels: 4.11, 4.275
The movement of Bitcoin shows that the market is gathering liquidity as part of a local correction against the backdrop of a bullish trend. Yesterday, we all witnessed a local liquidation, but there are no reasons for a decline yet. SUI, in an ideal scenario, may test support at 3.811 and form a false breakdown before continuing to grow.
Best regards, R. Linda!

Trading the Impulse Rally Retracement — Price and Time Symmetry Trend is observed from an impulse run’s lowest/highest point and projected outwards in symmetrical fibonacci retracement via price/time from the first reversal candle to the end of the rally, creating crosshairs. These ‘crosshairs’ visually represent the trending ‘price distribution projection’ in price/time symmetry.
Using this concept, I draw a ‘projection trend line’ from the bottom or top of the impulse run thru the projected 78.6% price/time retracement value, to identify the price distribution structure in a linear form.
Now to introduce my STOP LOSS TRIANGLE.
This is a concept of decaying price and time as an underlying move towards our theoretical projection, where if the underlying enters our built faded cross-section, the SL is triggered to avoid sideways consolidation and decaying contract premiums.
This ‘right’ triangle that is ‘sclene’ by nature is created by taking the furthest projection in price/time symmetry (78.6%) and drawing a vertically placed straight line to the highest/lowest point in the rally previously identified. Here, I create a ‘right triangle’ by turning 90 degrees towards my final point, which is made by the nearest projection in price/time symmetry (38.2%). In its entirety, this forms the stop loss triangle.
Come follow me on X @askHVtobidIV for more!
CHEERS!

DOGE/USDT 1D chart reviewHello everyone, let's look at the 1D dog chart to USDT, in this situation we can see, the price reflection here can be seen how the price continues under the downward trend line.
Going further, let's check the places of potential target for the price:
T1 = 0.246 $
T2 = 0.282 $
Т3 = 0.319 $ t4 = 0.369
Let's go to Stop-Loss now in case of further declines on the market:
SL1 = 0.229 $
SL2 = 0.195 $
SL3 = 0.157 $
Looking at the RSI indicator, you can see that when the indicator came out the top, it gave the relief for the price and now when the price lasts in a slight side trend, the indicator collects energy for a new move.

No Payout but..
Though NO PAYOUT, but Very Good Result.
If 31.50 is Sustained, we may witness 34-35
tomorrow.

GBPNZD | 1H | SELL ZONEHey There,
After reaching my GBPNZD sell level, my target is now 2.23855.
Your likes keep me motivated to share my analyses, and I truly appreciate the support.
Big thanks to everyone showing love

BNB/USDT 1D chartHello everyone, let's look at the 1D BNB chart to USDT, in this situation we can see how the price came out of the downward trend line and currently persists over it.
Going further, let's check the places of potential target for the price:
T1 = $ 686
T2 = $ 732
Т3 = $ 795
Let's go to Stop-Loss now in case of further declines on the market:
SL1 = $ 648
SL2 = $ 599
SL3 = 541 $
Looking at the RSI indicator, we see a clear increase on the indicator that crossed the upper limit, which can also affect the potential relaxation.

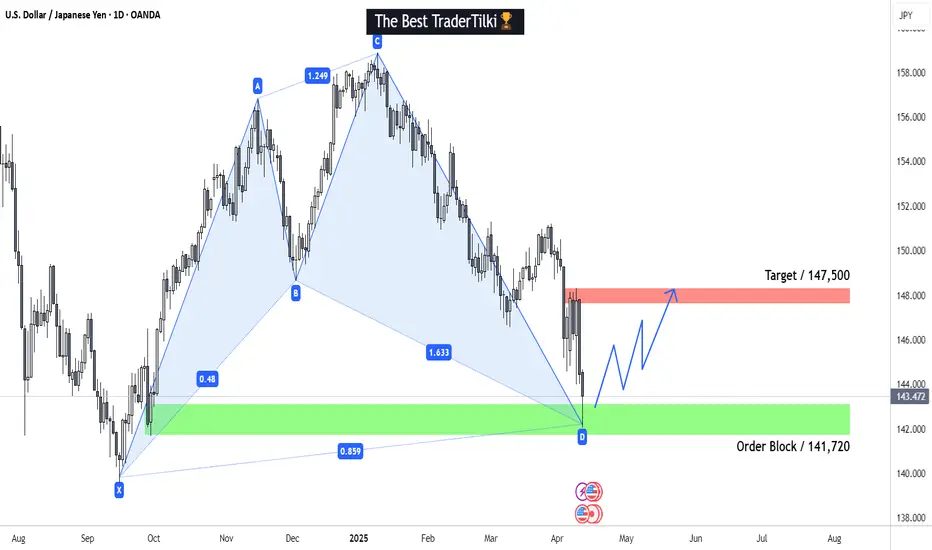
USDJPY / 1 DAY / BULLHello Guys;
My USDJPY target level is 147,500.
My target may come a bit late because this trade is a swing trade.
I would appreciate it very much if you do not miss your likes within the framework of Respect for Labor Thank you very much in advance
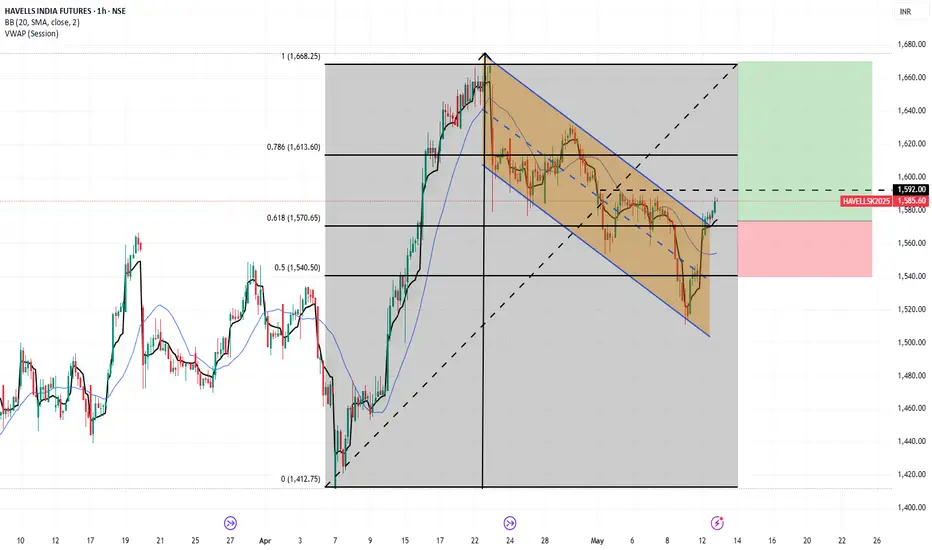
FLAGHavells made flag n pole pattern on hourly charts after taking support @ 0.5 Fibb Retracement Level, with decrease in OI suggesting furthermore shourt covering.
Risk:Reward = 1:2.
Could b bought with mentioned stoploss & target.
Jai Hind.
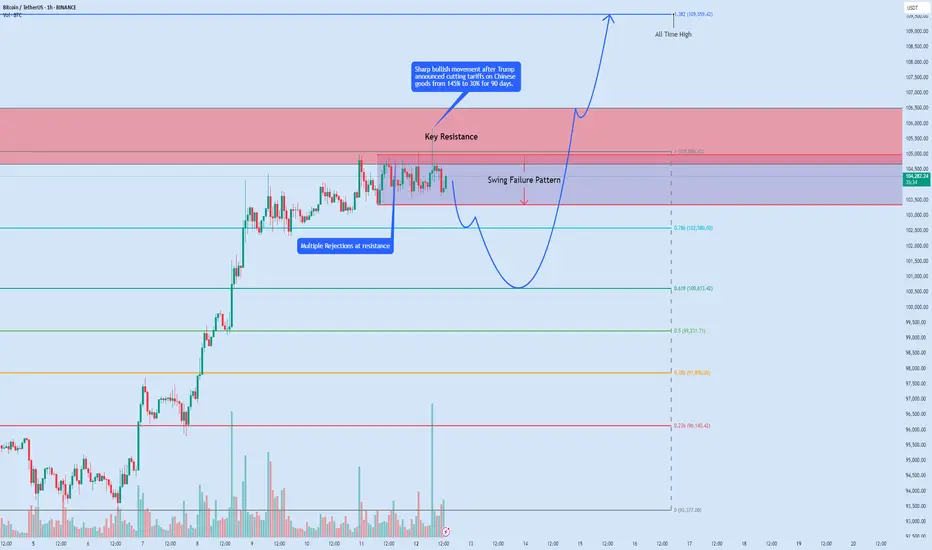
BTCUSD – Multi-TF Bearish SFP & Fib Retrace Before ATH Rebound
Bearish SFP printed on 4H / 8H / 12H / 1D at $103 345 – $104 985 after a parabolic ~$94 k → $104 k run and multiple rejections at $104 k–$106 k resistance.
Trump tariff-cut announcement sparked a sharp spike into resistance that was quickly sold off, confirming heavy supply at $104 k – $106 k.
Baseline plan: drop to 0.786 Fib ~$102 586, then 0.618 Fib ~$100 613, before a push toward the ATH ~$109 588.
Trade Setups
Short – SFP Breakdown
Trigger: 4H close below $103 345
Entry: ≈ $103 300 on retest
SL: $105 500 (above swing high)
TP1: 0.786 Fib ≈ $102 586 RR ≈ 0.7
TP2: 0.618 Fib ≈ $100 613 RR ≈ 2.6
Long – Fib Rebound
Trigger: Bullish reversal at 0.618 Fib / FVG cluster ≈ $100 613
SL: $99 300 (below FVG)
TP1: SFP top / range high ≈ $104 145 RR ≈ 2.7
TP2: ATH ≈ $109 588 RR ≈ 6.8
SUI Pullback in Motion — Here’s Where the Smart Money Loads UpSUI is showing signs of exhaustion after failing to convincingly reclaim recent highs. Today’s price action delivered a strong clue: a sweep of the key high at $4.274 followed by a sharp rejection — Swing Failure Pattern (SFP).
Momentum is fading as volume dries up, and bulls have lost control of major levels:
❌ Yearly Open at $4.1225
❌ Weekly Level at $4.0921
This suggests a deeper correction may be underway before SUI can attempt another leg higher.
📌 Liquidity & Fib Levels in Focus
There’s still significant liquidity resting below the $3.80 zone — and the market often seeks to sweep such areas before reversing. Taking the Fib retracement from the $3.12 low to the $4.2989 high, we can identify two critical zones for a potential long entry:
0.5 Fib Retracement → $3.7095
This level not only sits just below the $3.80 liquidity shelf but also provides a strong technical anchor. If SUI finds support here, it could offer a solid long opportunity.
🎯 Trade Setup from the 0.5 Fib ($3.7095)
Entry: Around $3.71
Stop-Loss: $3.612
Target 1: $3.90 → R:R ≈ 2:1
Target 2: $4.587 (0.786 Fib Retracement) → R:R ≈ 9:1
Key Note: Watch the volume on the bounce — strong reaction = continuation potential; weak reaction = deeper retrace risk
🔸 Golden Pocket (0.618–0.666) Zone → $3.57-$3.52
If the 0.5 Fib bounce fails or lacks volume confirmation, price may dig deeper into the golden pocket — a historically strong reversal area. This zone becomes your next high-probability long setup to monitor.
🧠 Summary & Strategy
SUI showed rejection via SFP at key high ($4.274)
Lacking volume for immediate continuation
Next key long opportunity: $3.71 (0.5 Fib), SL at $3.612
If weak, watch $3.57 (golden pocket) as secondary entry
R:R potential ranges from 2:1 up to 9:1 depending on bounce strength
Let price come to you. Monitor reactions at each zone and don’t trade blindly into weakness. This is where patience and precision pay off. 💡
___________________________________
If you found this helpful, leave a like and comment below! Got requests for the next technical analysis? Let me know.
Master HBAR with Fibonacci: The Golden Pocket BlueprintSince topping out at $0.20151, HBAR has spent the last nine days in a corrective pullback. Digging into a rich confluence of supports that offers a long trade setup. Here’s how to spot the high‑probability entries, manage your risk, and scale out for maximum reward.
Current Context
Two days ago, price was firmly rejected at the weekly open ($0.19029) right alongside the anchored VWAP drawn from the $0.28781 swing high.
HBAR now trades below the monthly open ($0.18210), the weekly open ($0.19029), and the daily open ($0.18024), sitting at about $0.177.
Just beneath today’s level lies the swing low at $0.17543. Breaching this could flush out stops before any meaningful bounce.
The Golden Support Zone
All signals converge between $0.170 and $0.1725:
The anchored VWAP from the $0.12488 low sits at around $0.17.
The 0.618 fib retracement of the $0.15396→$0.20239 move falls at $0.17246. Just under the swing low where the liquidity lies.
The secondary 0.666 fib retracement lands at $0.17014, reinforcing that floor.
Volume‑profile analysis of the past 27 days pins its Point of Control right at $0.17, great confluence with the anchored VWAP.
This “golden pocket” is your pivot for a low‑risk, high‑probability long.
Long Trade Setup
Ladder buy orders between the swing low ($0.17543) and the 0.666 fib at $0.17014.
Aim to average in around $0.1725.
Place a single stop‑loss just below $0.17
Scaling Your Exits
First Partial Exit at the monthly open ($0.18210). This offers roughly a 2:1 R:R.
Second Exit Zone around the weekly open and VWAP resistance (~$0.19) for about a 3:1 R:R.
Final Target at the 0.618 fib retracement of the entire down‑wave (from $0.28781 to $0.12488) near $0.2256. An astounding 10:1 payoff for the patient trader.
Keep in mind a potential false‑break (SFP) at $0.17543: if price briefly dips below then snaps back up, with increased volume.
Short Trade Setup
For traders looking to play the downside from the “golden pocket” flip, here’s a clear short strategy:
Entry Zone: Ladder short entries between the 0.618 fib at $0.22557 and the 0.666 fib at $0.23339.
Confluence: The 0.666 level aligns perfectly with the negative 0.618 fib from the prior swing, creating a resistance zone.
Stop‑Loss: Place your stop just above $0.23339, invalidating the confluence.
Take‑Profit: Target a return to around $0.206, where you can lock in gains as HBAR retests its previous high.
By scaling into shorts across that fib band, you balance your risk and capture the high‑odds reversal offered by stacked Fibonacci confluence. Let the golden pocket guide both your longs and shorts!
Key Takeaways
Confluence is king: VWAPs, Fibonacci retracements, Liquidity and volume‑profile all align in the $0.170–$0.175 zone.
Risk control: One stop‑loss under $0.17 protects the entire laddered entry.
Tiered targets: Small wins at $0.182, larger as you clear $0.19, and a big payoff if HBAR rallies toward $0.225. Trail your SL accordingly.
Patience pays: Wait for price to enter the golden pocket, avoid chasing!
With these confluences lining up and clear levels to work from, HBAR’s next high‑probability long setup is staring you in the face. Trade smart, size appropriately, and let the market reward your discipline.
Happy Trading!
___________________________________
If you found this helpful, leave a like and comment below! Got requests for the next technical analysis? Let me know.

SOL Hits Major Resistance — Patience Over FOMOOne of the most common mistakes traders make—especially in fast-moving markets—is jumping into trades impulsively at major resistance. It feels exciting when price is surging, but ironically, this is often where risk is highest and reward is most limited.
Why? Because historical resistance zones—like the $175–$183 region on SOL—tend to attract heavy sell pressure. These are levels where many past buyers look to exit, where smart money hunts liquidity, and where false breakouts are most common. Without volume confirmation and a proper retest, breakouts through such zones often fail.
That’s why experienced traders wait. The smarter approach is to let the market come to you, and only act when one of two things happens:
A pullback into a well-defined, confluence-rich support zone
A clean breakout above resistance, followed by a retest and confirmation
SOL has respected structure beautifully, but now is not the time to chase. Either wait for a healthy correction into support, or let price prove its strength through a confirmed breakout. No trade is also a trade — and capital preservation is the foundation of long-term success.
Patience isn’t passive — it’s a strategy. Let the market come to your desired levels. You don't need to catch every move, only the high-probability trades and there aren’t born from impulse — they’re built on patience, structure, and right timing. 💎
Technical Breakdown
SOL has entered a major resistance zone between $175 and $183 — a historically significant level respected for over a year.
Within this zone lie two key highs:
$179.85: Recently swept with a clean Swing Failure Pattern (SFP)
$180.52: Still untested — if broken, it would confirm a strong bullish continuation
Breaking through such a well-established resistance on the first attempt is uncommon — it typically requires momentum and structure. A rejection here would suggest that SOL needs a healthy correction before mustering the strength for a true breakout.
📉 Elliott Wave Count
Looking at the structure, we’ve completed a 5-wave sequence — signaling the potential end of this impulse leg. According to Elliott Wave Theory, a corrective phase is now expected before continuation.
📐 Additional Confluence: Fib Speed Fan
The 0.618 Fib Speed Fan — drawn from the all-time high at $295.83 to the swing low at $95.26 — aligns perfectly with this resistance zone, adding more weight to the idea of a potential rejection or pause.
🟢 Long Setup: The Next High-Probability Entry Zone
We now shift our focus to where the next long opportunity could arise. Here’s the technical confluence:
Anchored VWAP from the recent low at $141.41 sits at $164.70
4H bullish order block around $164.46
0.382 Fib retracement of the full 5-wave impulse: $165.42
0.412 Fib retracement: $164.25
All these levels converge in a tight band, providing a solid long entry zone between:
Long Entry Zone: $165.50 to $164.25
Stop-Loss: Below $160 (to protect against any deep wick)
Targets:
TP1: $171.75 (Point of Control from the range)
TP2: $180.00 (resistance retest)
TP3: $200.00 (psychological level)
Estimated R:R: ~6:1 — High-conviction setup
Bonus: If price returns to this $165 zone within 24 hours, it will also be supported by the 0.618 Speed Fan — adding one more layer of support.
🔴 Short Setup: Reversal Play at $200
For those watching from the sidelines or looking to fade the rally, the psychological level at $200 presents a strong short opportunity — but only on confirmation (e.g., SFP or bearish engulfing).
Short Entry: On rejection at $200
Stop-Loss: $206.10
Target: $187.00
Estimated R:R: ~2:1
🧠 Summary:
Completed 5-wave structure → potential correction phase underway
Strong resistance at $175–$183 with SFP and speed fan alignment
High-probability long setup at $165.5–$164.25 with multi-layered confluence
Potential short at $200 on confirmation
⚠️ Key Takeaway: Don’t Chase the Highs
This is where many traders slip — FOMOing into trades at major resistance. Please, don’t do it. Instead, wait for:
A pullback into well-defined support (like the $165 zone), or
A clean breakout above $180, followed by a confirmed retest
____________________________________
If you found this helpful, leave a like and comment below! Got requests for the next technical analysis? Let me know.

EURJPY → Storming the resistance. Ready for the rallyFX:EURJPY is rising amid a stronger dollar and positive news about the de-escalation of the trade war. The currency pair is storming the resistance of the range.
The currency pair is forming a retest of resistance. A breakout and consolidation above 164.19 - 164.50 could support the market amid the dollar's growth.
The dollar is strengthening after positive news related to the de-escalation of the trade war. Against this backdrop, the Japanese yen is losing ground, which is generally affecting EURJPY.
A move above the key level will confirm a breakout of the resistance of consolidation, which could trigger a distribution phase...
Resistance levels: 164.19, 166.7
Support levels: 163.15, 162.38
The price has already entered the buying zone, meaning that resistance has been broken. All that remains is to wait for confirmation that the bulls are ready... Consolidation above 164.19 - 164.5 will confirm this, and in that case, we can expect distribution towards 166.7.
Best regards, R. Linda!

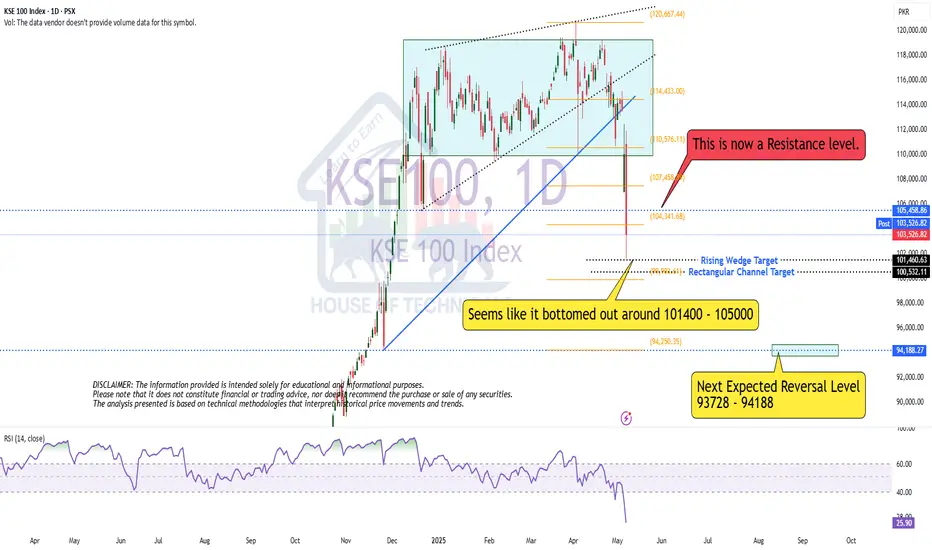
Has it Bottomed Out or Bottom yet to come?Seems like it bottomed out around 101400 - 105000
Next Expected Reversal Level
93728 - 94188