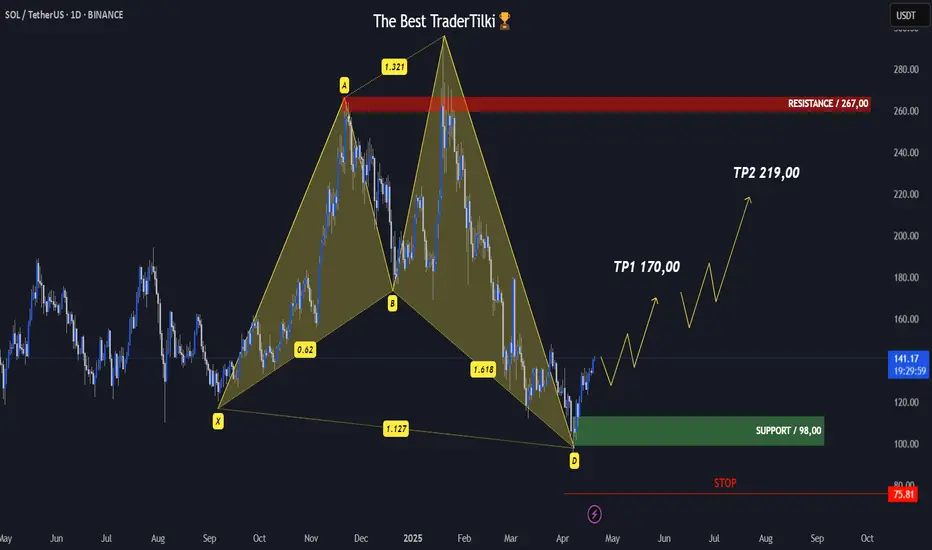
SOLUSDT | 1 DAY | SWING TRADING Hey friends!
I’ve put together a detailed analysis on Solana just for you. The harmonic pattern has completed, and we’ve already seen some strong buying from that exact zone. 📈
Now, I’ve got two targets for you:
🎯 Target 1: 170.00
🎯 Target 2: 219.00
🔴 STOP: 75,81
"Just a heads-up — since this is a swing trade, the target might take some time to hit. Good to keep that in mind."
Remember, the more love and likes I get from you, the more motivated I am to keep sharing these analyses. All I ask is for a simple like to show your support. 💙
Huge thanks to everyone supporting with their likes — I truly appreciate it!
Fibonacci Retracement
SUI - Leveraging Fibonacci & Elliott for Precision TradesSUI’s movement is rapid, sharp swings—both up and down. In volatile conditions like this, we aim 0.702–0.786 fib retracements (and occasionally 0.886 in harmonic contexts) for high‑probability entries. Below is a clear, Elliott-focused breakdown of the current setup and both long and short trade plans.
Before diving into the charts, let’s cover the basics of Elliott Wave Theory. Elliott Wave Theory provides a roadmap for market psychology by dividing price action into two distinct phases:
1. Impulse Phase (Waves 1–5)
Wave 1: The spark that ignites a new trend as early adopters push prices beyond the prior range.
Wave 2: A corrective pullback that tests the strength of the emerging trend, often retracing 38–61.8%.
Wave 3: The powerhouse wave—typically the longest and most dynamic—driven by broad market participation and often extending to key Fibonacci levels (1.618, 2.618).
Wave 4: A consolidating correction that digests gains and builds the base for the final thrust; it must not overlap Wave 1 territory in a classic impulse.
Wave 5: The final leg of the advance, often fueled by last bursts of optimism and weaker hands.
2. Corrective Phase (Waves A–B–C)
Wave A: Initial counter-trend reaction as profit-taking begins.
Wave B: A deceptive retracement back toward the trend, frequently trapping traders.
Wave C: The concluding leg of the correction, which typically tests or breaks the low of Wave A before the next cycle begins.
Key Points:
Impulse waves showcase momentum and structural clarity, often aligning with Fibonacci extensions.
Corrective waves follow Fibonacci retracements (38.2%, 50%, 61.8%), offering optimal entry points.
Wave 3 is seldom the shortest; Wave 4’s complexity sets the stage for Wave 5’s final push.
In the current SUI structure:
Wave 1 ignited the initial rally.
Wave 2 delivered a healthy retracement, a pullback close to the 0.618 fib, setting the stage for stronger momentum.
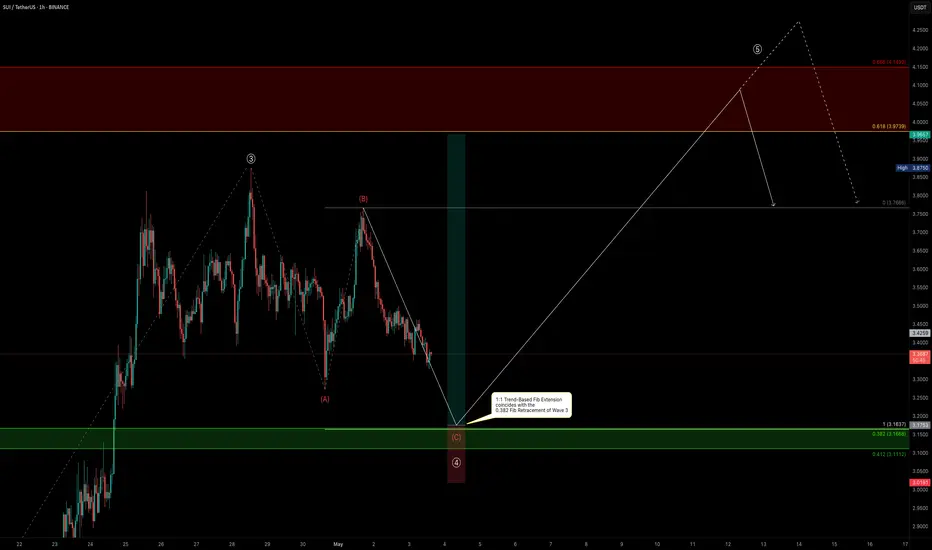
Wave 3 roared to a powerful peak topped at the 2.618 extension ($3.875)
Now, we’re deep into Wave 4, likely an ABC corrective pattern. This pause is critical—it gathers energy before the final push of Wave 5. Below is a clear breakdown of each wave, big-picture confluences, and trade setups.
🚀 Elliott Wave Overview
1. Wave 1 & Wave 2
Wave 1: Quick surge from $2.4175 → $2.75, setting initial momentum.
Wave 2: Pulled back close to the 0.618 fib, creating a solid launchpad.
2. Wave 3: The Power Move
Peak: Hit the 2.618 extension of Wave 1→2 and aligned with the –2 extension of Wave 1.
Significance: In strong bull markets, a run to the 2.618 extension often precedes a meaningful pullback. Here, Wave 3’s exhaustion suggests a retrace toward the 38.2% Fib of that advance—our ideal Wave 4 entry zone.
3. Wave 4: The Correction
All eyes on the $3.17 level—the projected 1:1 extension of A→B and 0.382 fib retracement of Wave 3. This confluence zone is yet to be tested and could offer an ideal Wave 4 entry.
ABC Pattern: Currently working on Wave C.
4. Wave 5: The Finale
Target Zone: $4.00–$4.35, with strong focus at $4.31
Extension Levels:
1.133 → $3.9695 aligns with the 0.618 fib retracement.
1.272 → $4.0683 is close to the weekly resistance level.
1.412 → $4.1678 alings with the 0.666 fib retracement.
1.618 → $4.3142 alings with the key swing high.
🔑 Key Confluence Levels
Golden Pocket: $3.9739–$4.1492 (90-day retrace).
Speed Fan 0.618: Support around $3.15.
Fair Value Gap:
Psychological: $3.00 major support.
📈 Long Trade Setup
Entry Ladder: $3.25–$3.111 (stack orders to DCA)
Stop‑Loss: $3.07 (just below the 0.786 Fib low)
Profit Targets:
Fib 1.133 at $3.9795 ($4 psychological & partial take‑profit)
Fib 1.272 at $4.0683
Fib 1.412 at $4.1678
Fib 1.618 at $4.3142
Risk:Reward: ~6:1+ (average entry around $3.20 → SL at $3.07 → TP1 at $3.9795)
📉 Short Trade Setup
Entry Zone: $4.00–$4.35 (sweet spot at weekly level/yearly open)
Confirmation: Bearish reversal candle or volume spike down
Stop‑Loss: Above $4.35
Target: $3.77 (near Wave 3 high turned support)
Risk:Reward: ~2:1 (varies with DCA entry)
⚙️ Summary & Game Plan
Primary Bias: Long in the $3.25–$3.111 zone—stack into the 0.382-0.412 fib retracement entries with tight SL, aiming for the $4.00–$4.30 upside zone.
Alternate Bias: Short on a clear rejection within $4.00–$4.35, targeting $3.77 or lower.
Risk Management: Keep stops tight to maximize R:R.
Patience & Confirmation: Wait for price to reach these zones and show reversal signals (price action, volume, patterns) before committing.
All set—now let SUI’s swings unveil the opportunities. Sit tight, follow your plan, and let patience pay its dividend.
Happy Trading!
____________________________________
If you found this helpful, leave a like and comment below! Got requests for the next technical analysis? Let me know.
SUI Elliott Wave Meets Fibonacci: Wave 5 Setup ExplainedSUI has once again delivered a textbook display of wave structure, Fibonacci precision, and anchored VWAP interaction. After finishing Wave 4, price surged upward, tagging key fib levels and now consolidating at a critical decision point. The next high-probability trade opportunity is forming — and it’s one worth watching closely.
📈 Recap of the Current Move
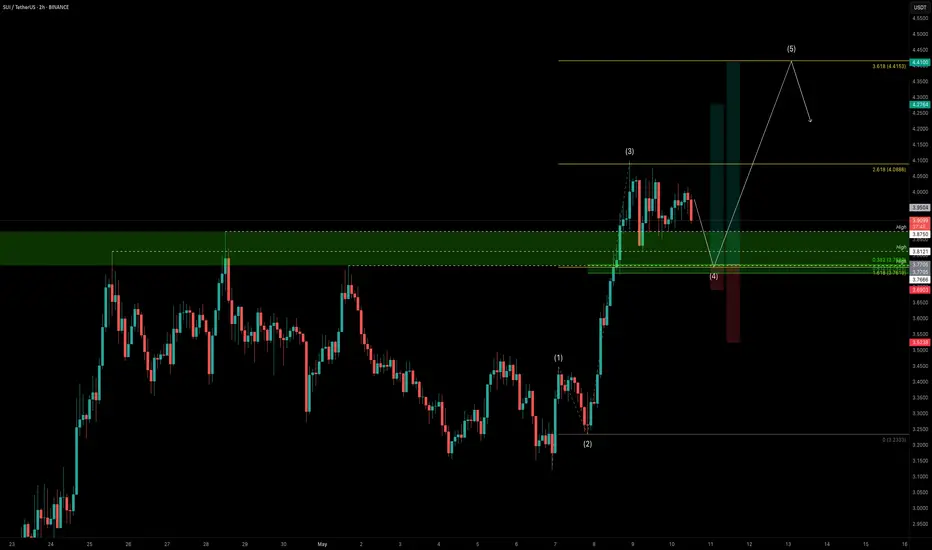
After completing Wave 4, SUI surged right into the golden pocket — the 0.618 Fibonacci retracement of the entire 90-day downtrend (measured from the $5.3687 high to the $1.7174 low). That golden 0.618 sits at $3.9739, with price currently hovering just below at around $3.965.
In our previous analysis, we noted SUI’s tendency to respect trend-based Fib extensions. That pattern is holding beautifully.
Projecting from Wave 1 to Wave 2 of the current impulse wave, price once again nailed the 2.618 Fib extension — at exactly $4.10. That extension aligned perfectly with the 0.65 retracement of the 90-day wave at $4.0907, forming a significant resistance confluence.
2.618-1.618 fib:
The result? A healthy ~7% rejection, pulling SUI back into a support zone formed by three previously broken swing highs — $3.875, $3.8121, and $3.7666 — now acting as support.
🔺 Wave 4 Structure: Triangle Formation & Key Retest Levels
SUI has now been consolidating for ~1.5 days, and price structure shows a developing triangle — a classic Elliott Wave Wave 4 pattern.
But while triangles often resolve higher, we can’t ignore the Fibonacci roadmap:
The 1.618 trend-based Fib extension (drawn from Wave 1 → Wave 2) sits at $3.7619.
This level aligns almost perfectly with the key swing high at $3.7666.
In the previous Wave 3–4 sequence, price also retested the 1.618 extension — a pattern that could repeat now again.
So, despite the bullish triangle breakout potential, there’s still a high likelihood that price dips slightly to retest the 1.618 Fib zone at $3.76–$3.77.
📊 Anchored VWAP Confluence: Even More Support
To further strengthen this thesis, we’ve anchored VWAP from the recent swing low at $3.12. That VWAP (yellow line) now sits at $3.745 — just beneath the 1.618 Fib and in perfect confluence with the swing high cluster.
This creates a tight demand pocket between $3.74 and $3.77, where four technical tools align:
→ 1.618 trend-based Fib extension
→ Anchored VWAP from $3.12
→ Broken swing highs now acting as support
→ 0.382 Fib Retracement of Wave 3
This is where smart money looks to accumulate — not at the top of the triangle, but where liquidity gets transferred.
🧠 Outsmarting the Crowd: Trap & Trigger
Many breakout traders are positioning within the triangle, with stop-losses just beneath. If price dips into the $3.74–$3.77 range, it would sweep those stops and fill orders from traders waiting patiently at this confluence.
This creates a classic “switching hands” moment: breakout longs are stopped out, and Fibonacci-aligned buyers step in just as price hits the sweet spot.
To be part of the 1% in trading, you need to be thinking one step ahead — not where price is now, but where it needs to go to trap the many and reward the few.
🎯 Long Trade Setup
Entry Zone:
$3.77 preferred
Laddered from $3.76–$3.74
Stop-Loss Options:
Tight: Below $3.70 (2% buffer)
Loose: Below $3.52 (golden pocket of previous Wave 3)
Targets:
Conservative: $4.28
Primary: $4.41
Aggressive Extension: $4.5873 (0.786 retracement of full 90-day move)
R:R Potential:
Tight SL: ~2.5:1
Loose SL: 6:1+
📆 Weekend Trading Note
We’re currently in weekend session flow — often thinner liquidity and more prone to wicks. While the structure is strong, wait for confirmation and avoid FOMO entries at the top of the triangle.
✅ Wrapping It Up
SUI remains in a clean, bullish market structure and continues to respect Fibonacci and trend-based extensions to the letter. With price above key swing highs, holding structure, and anchored VWAP adding confluence, the $3.74–$3.77 zone is setting up as a high-probability entry for the next wave.
Smart money doesn’t chase — it anticipates. Be the 1% who sees beyond the triangle and understands where the real opportunity lies.
Happy Trading!
___________________________________
If you found this helpful, leave a like and comment below! Got requests for the next technical analysis? Let me know.
LINK/USDT 1W chart reviewHello everyone, let's look at the 1W link to USDT, in this situation we can see how the price is fighting for the mountain from the downward trend line over which we are currently.
Going further, let's check the places of potential target for the price:
T1 = $ 18.38
T2 = $ 21
Т3 = $ 23.53
Let's go to Stop-Loss now in case of further declines on the market:
SL1 = 15.31 $
SL2 = $ 13.17
SL3 = 10.53 $
Looking at the RSI indicator, we see a clear increase on the indicator and a return to the upper part of the range, but there is still room for continuing the ongoing strong growth.

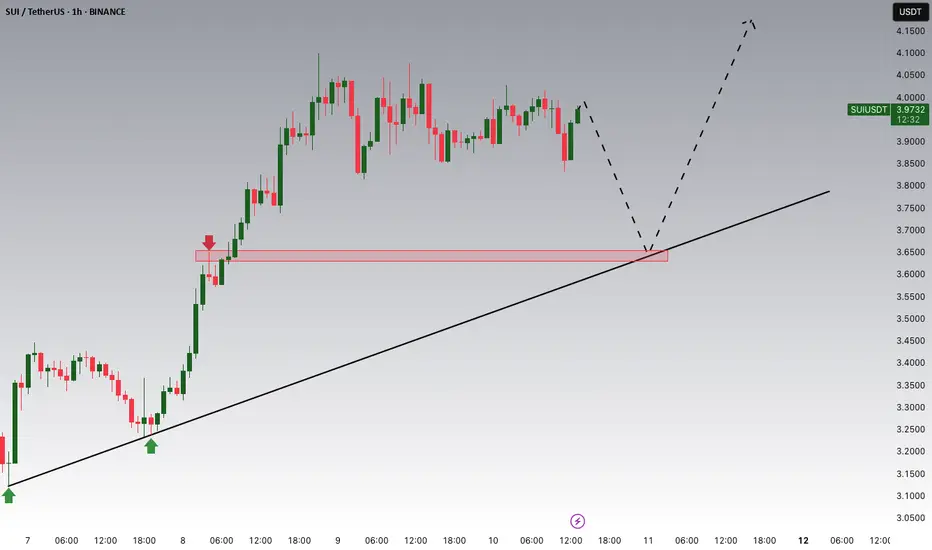
SUI/USDT Potential UpsidesHey Traders, in today's trading session we are monitoring SUI/USDT for a buying opportunity around 3.65 zone, SUI/USDT is trading in an uptrend and currently is in a correction phase in which it is approaching the trend at 3.65 support and resistance area.
Trade safe, Joe.
GOLD → Return to range. Fall from resistance...FX:XAUUSD is reacting to data related to the tariff war. The price is returning to the range and forming a false breakout of resistance. The level of 3370 and the zone of interest at 3387 play a key role.
On Thursday, gold rose to $3,400 amid a weaker dollar, increased demand for safe-haven assets, and continued uncertainty due to US trade policy and tensions in the Middle East and Ukraine. The Fed left rates unchanged and expressed caution in its assessment of the outlook, which also supports gold's rise.
However, in the European session, we are seeing gold react to the trade deal with Britain, most likely due to the easing of tariffs. Now the main focus is on the terms of the deal. We should not forget about China, where the situation remains tense, but everyone is waiting for a resolution.
Resistance levels: 3352, 3369, 3385
Support levels: 3319, 3269
The fundamental backdrop changes several times a day. At the moment, the situation is as follows: the rise of the dollar, the weakening of the tariff war, and the hawkish stance of the Fed may put pressure on gold. Therefore, I expect the decline to continue after a retest of 3370-3386. In this case, the target could be 3319.
Best regards, R. Linda!

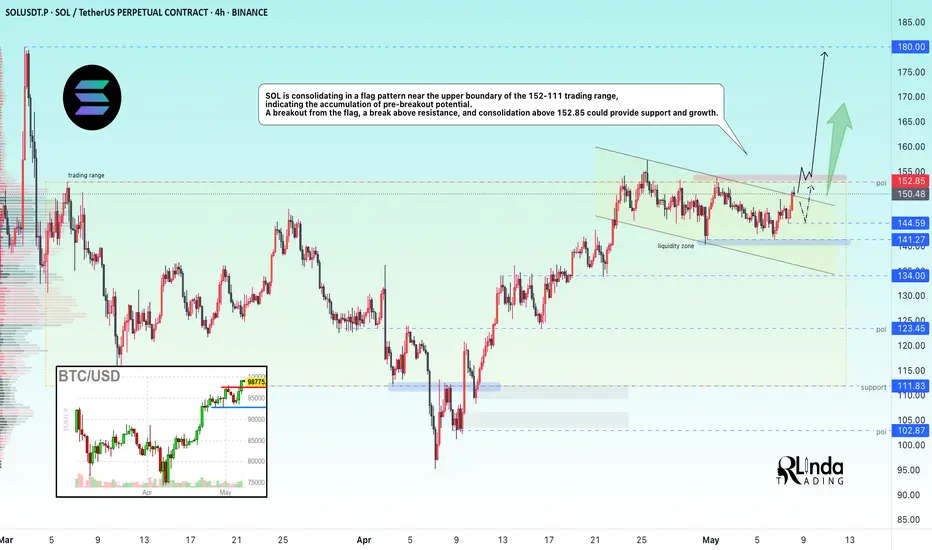
SOLANA → Resistance level and free zone for growth up to 180.0BINANCE:SOLUSDT.P is holding steady and consolidating near the resistance level of the global price range of 152.85–111.85. Thus, the market has signaled that it is in a positive mood. A trigger is ahead...
SOL is forming a flag consolidation near the upper border of the trading range of 152 - 111, which indicates the accumulation of pre-breakout potential. A breakout from the flag, a break of resistance, and consolidation above 152.85 could provide support and growth. The cryptocurrency market is reviving after yesterday's news and relatively positive data in the tariff war. Countries are gradually beginning to agree, which is generally supportive for the crypto market.
Resistance levels: 152.85
Support levels: 144.6, 141.2
A breakout of the resistance range of 152.85 and consolidation of the price above this level will confirm the readiness for further growth. Further on, there is a free zone and the price can easily reach 180.00.
Best regards, R. Linda!
Fibonacci Extensions: Mapping Market Psychology Beyond the TrendHello, traders! 💫
Fibonacci numbers have traveled far from ancient Italian math to modern trading charts. In technical analysis, Fibonacci Extensions aren’t just mystical ratios; they’re a structured way to project potential price targets based on crowd psychology and trend continuation.
But what are they really, and why do so many traders draw those lines with near-religious fervor?
🧠 A Quick Historical Detour
Leonardo Fibonacci introduced the sequence to the West in the 13th century based on patterns he observed in Indian mathematics. The key idea is that each number in the sequence is the sum of the two before it: 1, 1, 2, 3, 5, 8, 13, 21...
When you divide specific numbers in the sequence, you get ratios that repeat throughout nature — and, intriguingly, financial markets. These include:
0.618 (the “golden ratio”)
1.618
2.618, and so on.
While Fibonacci Retracements look backward to gauge potential pullbacks, Fibonacci Extensions look forward to mapping possible continuation levels after a price move.
📊 Fibonacci Extensions
To use Fibonacci Extensions, you need three points:
The Start of a Trend (Point A)
The End of the Trend or Impulse Move (Point B)
A Retracement Low/High Where Price Bounces or Consolidates (Point C)
This ABC move applies Fibonacci ratios to project levels beyond point B, helping traders visualize where the price might go if the trend continues.
Common Extension Levels Include:
1.272
1.618 (golden ratio)
2.0
2.618
Each level acts as a kind of psychological milestone — not a guarantee, but a place where market participants may take profits, reassess, or react.
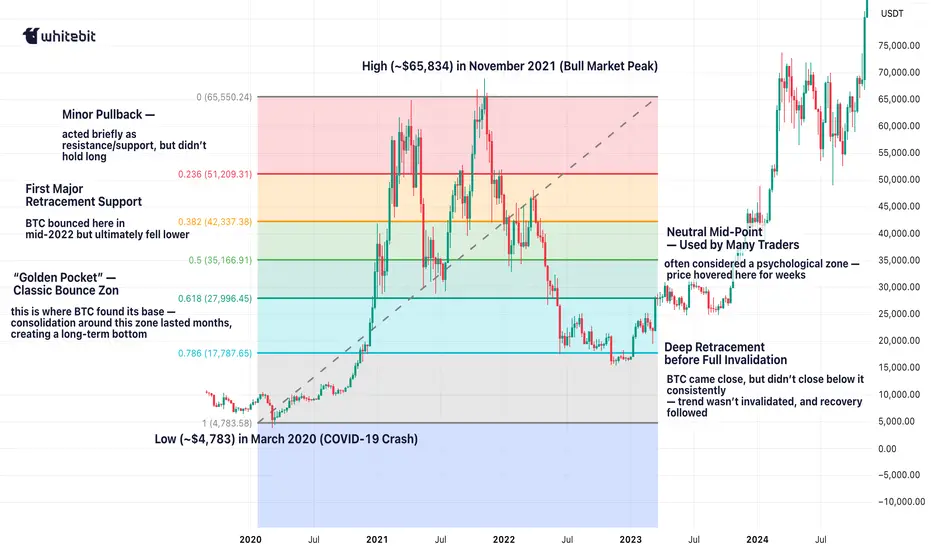
🔎 Let’s Take a Real Example: BTC/USDT Weekly
It's not that Fibonacci numbers have magical power. The theory is based on self-fulfilling behavior. When enough traders watch the same levels — and act on them — they can influence real outcomes.
The chart illustrates how Fibonacci retracement levels can be used to understand the depth and structure of a correction during a bullish cycle.
Low (~$4,783) in March 2020 (COVID-19 Сrash)
to the High (~$65,834) in November 2021 (Bull Market Peak)
From there, the price corrected throughout 2022–2023. Let’s look at what happened at each level — and what it tells us on the graph.
🔍 Why This Matters
Your retracement levels aren’t just lines — they mapped the psychology of the market:
Investors Testing Conviction at 0.5
Panic at 0.618
Capitulation Near 0.786 — but Without Full Breakdown
And Finally: A Rebound in 2023, Leading to New Highs in 2025
This kind of structure is textbook Fibonacci behavior — and is part of why retracement levels remain a core part of institutional technical analysis.
⚖️ Final Thought
Fibonacci Extensions are not about telling you where the price will go — they’re about framing where the price might go if the current trend keeps moving. It’s a lens through which to read market psychology, momentum, and expectation. Combined with volume, structure, and broader trend context, they potentially help analysts build a more nuanced market narrative.
And maybe Leonardo Fibonacci would have appreciated that his 800-year-old math is still trying to decode modern human emotion, just on candlestick charts.
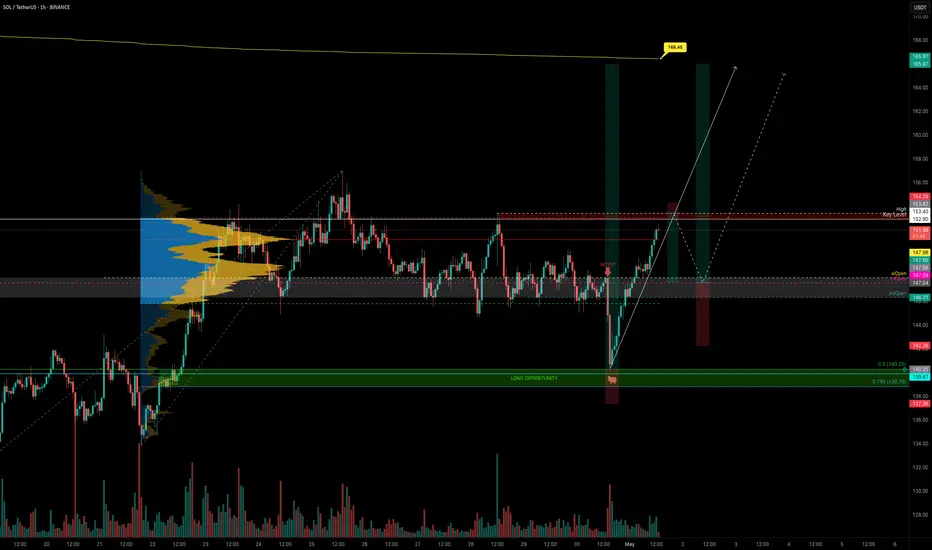
SOL Analysis Deep Dive: Identifying Optimal Entry and Exit ZonesYesterday, SOL gave a sharp downside shakeout, dropping from the weekly open at $147.98 (perfectly retested) down to the 0.5 Fib retracement of the swing at $140.25. Here’s a structured breakdown of the key levels, trade setups, and R:R profiles for both longs and shorts:
🔑 Key Levels & Confluences
1. Higher-Timeframe Opens
Weekly Open & Retest: $147.98 – pivoted price before the drop
Monthly & Prior-Day Open Cluster: $147.98–$146.31 – strong support confluence zone
2. Fibonacci Support Zones
0.5 Fib at $140.25 – primary mean-reversion entry
0.786 Fib (smaller wave) at $138.78 – secondary, deeper support
3. Order Block
Daily Bullish Order Block at $139.87 – just below 0.5 Fib, adds extra support
4. Volume-Weighted Average Price
Anchored VWAP (from ATH $295.83) at ~$166.45 – key upside resistance
5. Market Profile Value Areas (10-Day Range)
Value Area High (VAH) at ~$153.00 – overhead resistance confluence
Value Area Low (VAL) at ~$145.75 – underpins support
📈 Long Trade Setups
1. 0.5/0.786 Fib + Daily Bullish Order Block
Entry: $141-138.78
Stop-Loss: $137.5
Target: $165 (anchored VWAP / Fib zones)
R:R ≈ 9:1
2. Higher-Timeframe Open Cluster
Entry Zone: $147.98–$146.31(monthly/weekly open)
Stop-Loss: $142.5
Target: $165
R:R ≈ 3:1
• Why these levels? The 0.5 Fib is a classic mean-reversion zone, bolstered by the daily order block. The $147–146 zone ties together multiple opens (weekly, monthly, prior-day), offering a solid demand area if price retraces back up.
📉 Short Trade Setup
Trigger: Rejection / swing-failure around $153.4
Entry: $153.4
Stop-Loss: $154.3
Target: Weekly/Monthly open (~$147)
R:R ≈ 6:1
• Low-risk short: A clean rejection at the recent high lets you define risk tightly above the swing, aiming to capture the retrace back to the opens.
🎯 Summary & Game Plan
Primary bias: Look for long entries at the 0.5 Fib ($140.25) or the open-cluster zone ($147–146), with targets toward the anchored VWAP at ~$166.
Alternate bias: A short on clear rejection from $153.4, targeting the opens as support.
Risk management: Keep stops tight (SL below $137.5 or above $154.3) to maximize R:R on your favored setups.
Volume & Price Action: Confirm entries with an uptick in volume or bullish price structure (for longs) or swift failure patterns (for shorts).
Now it’s a waiting game! Let price revisit these zones, watch for confirmation signals, and then scale into your chosen side. Good luck! Don't chase, let the charts come to you!
____________________________________
If you found this helpful, leave a like and comment below! Got requests for the next technical analysis? Let me know.
$ETH 20% Move With 20/50DMA CrossoverHOLY MOLY!
Over 20% gain for CRYPTOCAP:ETH on the day
20DMA making a bullish crossover the 50.
Next target at the .382 Fib ~$2400
Did Pectra actually work?
And is Ethereum back from the dead !?

FILUSDT Potential UpsidesHey Traders, in today's trading session we are monitoring FILUSDT for a buying opportunity around 2.60 zone, FILUSDT is trading in an uptrend and currently is in a correction phase in which it is approaching the trend at 2.60 support and resistance area.
Trade safe, Joe.

ETH is fighting in a strong resistance zone!Hello everyone, I invite you to review the current situation on ETH. When we enter the one-day interval, we can see how the ETH price came out on top from a strong downward trend.
Here we can see how the current bounce brought the movement closer to a very strong resistance zone from $ 2,090 to $ 2,310, in which we can currently observe a fight for further upward movement. Only when the price comes out on top, it can go towards resistance at $ 2,740, and then move towards strong resistance at $ 3,070.
Looking the other way, we can see that when the trend reverses, we first have support at $ 1,837, then a very strong support zone from $ 1,610 to $ 1,404 is visible, however, if this zone is broken, we can see a quick decline to the support area at $ 1,071.
On the RSI indicator we can see how strong the ETH price movement is visible intensively on the indicator and here we can see how we are approaching the upper limit, which could potentially slow down the movement or give a temporary relief.

GBPUSD: Bullish Fakeout at Key 50% Fibonacci Level🚀After a brief consolidation near the 50% Fibonacci retracement, price performs a bullish fakeout, signaling its intention to move higher.
The 14:00 candle stands out as a clear sign of strength from buyers.
🔍 Trade Setup
📍 Entry limit:
⛔ Stop Loss:
🎯 Take Profit:
⚖️ Risk/Reward: ≈
💬 What’s your outlook on GBPUSD?
Is this the start of a new leg up?
Share your thoughts in the comments 👇

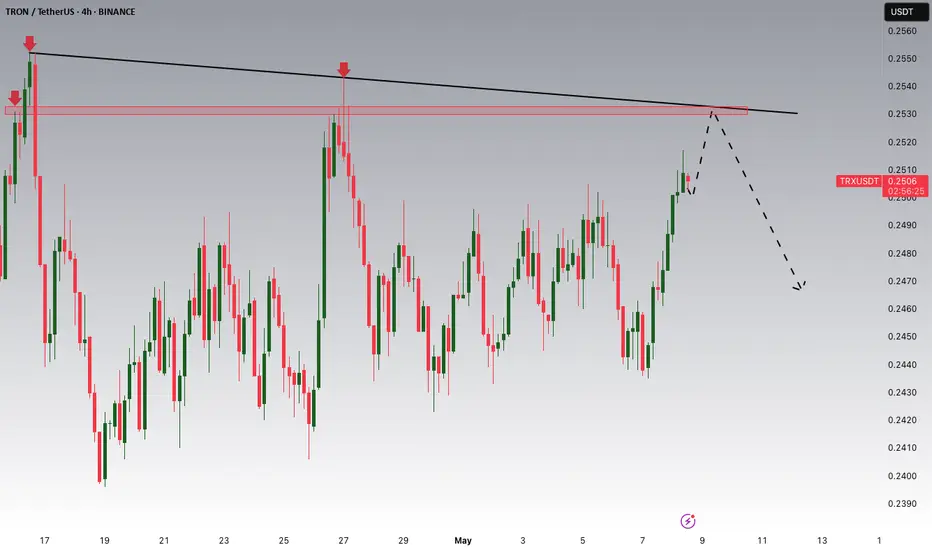
Tron Built a Fresh Down Trend!!!Hey Traders, in today's trading session we are monitoring TRX/USDT for a selling opportunity around 0.2530 zone, Tron is trading in a down trend and currently is in a correction phase in which iti s approaching the trend at 0.2530 support and resistance area.
Trade safe, Joe.
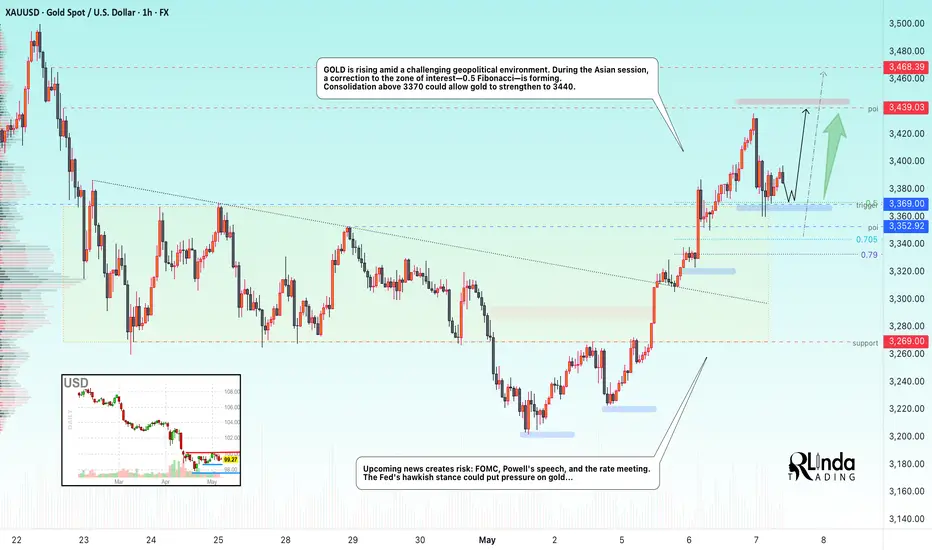
GOLD → The rally has given way to a correction. News aheadFX:XAUUSD is rising amid a challenging geopolitical environment. During the Asian session, a correction to the zone of interest (0.5 Fibonacci) is forming. The situation is quite complex and tense.
On Tuesday, the metal strengthened to 3433 due to tensions in the Middle East, but during the Asian session, gold fell sharply due to optimism surrounding the upcoming US-China trade talks, the strengthening of the dollar, and profit-taking ahead of the Fed's decision.
Investors are waiting for Powell's speech, which will determine the future of interest rate policy.
Despite the decline, gold is supported by ongoing geopolitical risks in the Middle East, Eastern Europe, and South Asia.
Theoretically, if the bulls keep the price above 0.5 Fibonacci, the growth may continue to 3439, as the price has not yet reached the liquidity zone.
Resistance levels: 3439
Support levels: 3369, 3352
However, unpredictable data could trigger a return of the price to the range and a correction to 3323-3300. Risk is posed by upcoming news: FOMC, Powell's speech, and the rate meeting. The Fed's hawkish stance could put pressure on gold...
Best regards, R. Linda!
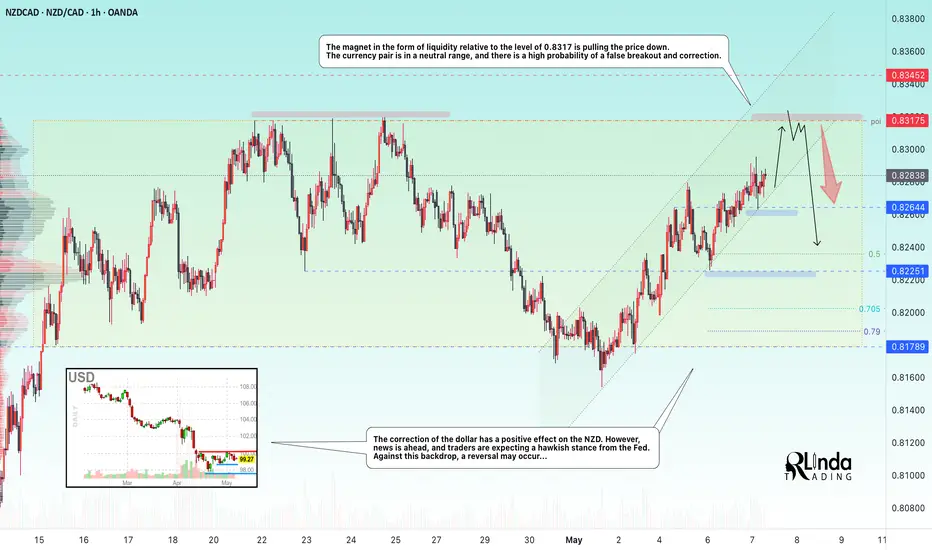
NZDCAD → Intra-range trading. Retest of resistanceFX:NZDCAD is strengthening within a neutral trading range. The currency pair is supported by the dollar's correction, but how long will this last? Ahead of us are the FOMC meeting and Powell's speech...
The focus is on the trading range within which the currency pair continues its local trend. Liquidity around the 0.8317 level is attracting the price. The correction of the dollar is having a positive effect on the NZD. However, news is ahead, and traders are expecting a hawkish stance from the Fed. Against this backdrop, a reversal may occur...
Since the currency pair is in a neutral range, there is a high probability of a false breakout and correction.
Resistance levels: 0.83175
Support levels: 0.82644, 0.8235, 0.8225
The liquidity zone is likely to stop the price (temporarily or reverse it). Further movement depends on fundamental sentiment, but based on rumors about the Fed's position, it is worth carefully analyzing what data the market will receive this evening. A tougher Fed policy or hints of one could strengthen the dollar and weaken currencies...
Best regards, R. Linda!
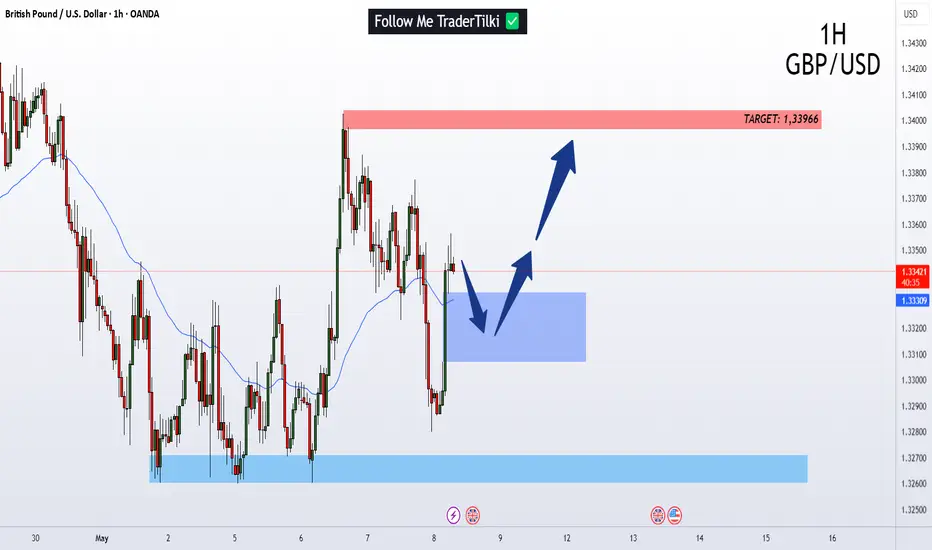
GBPUSD | 1H | BULLGood Morning Traders;
My target level for GBP/USD is 1.33966—just wait for this level and stay patient.
I put in a lot of effort to prepare these analyses for you, so don’t hold back on showing your support with a like! A huge thank you to everyone who supports me—every single like is a source of motivation for me to keep sharing my insights.
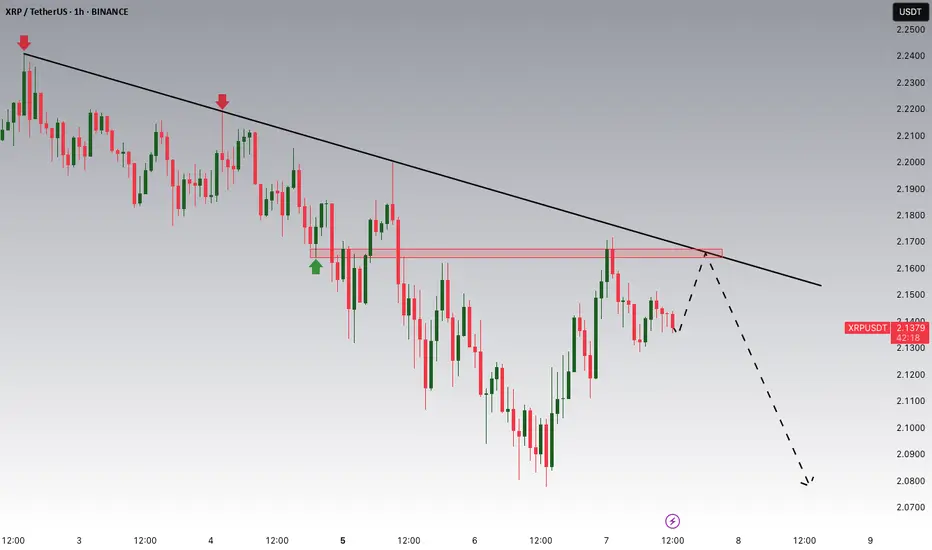
Ripple is Nearing The Main Trend!!Hey Traders, in today's trading session we are monitoring XRPUSDT for a selling opportunity around 2.16 zone, Ripple is trading in a downtrend and currently is in a correction phase in which it is approaching the trend 2.16 support and resistance area.
Trade safe, Joe.
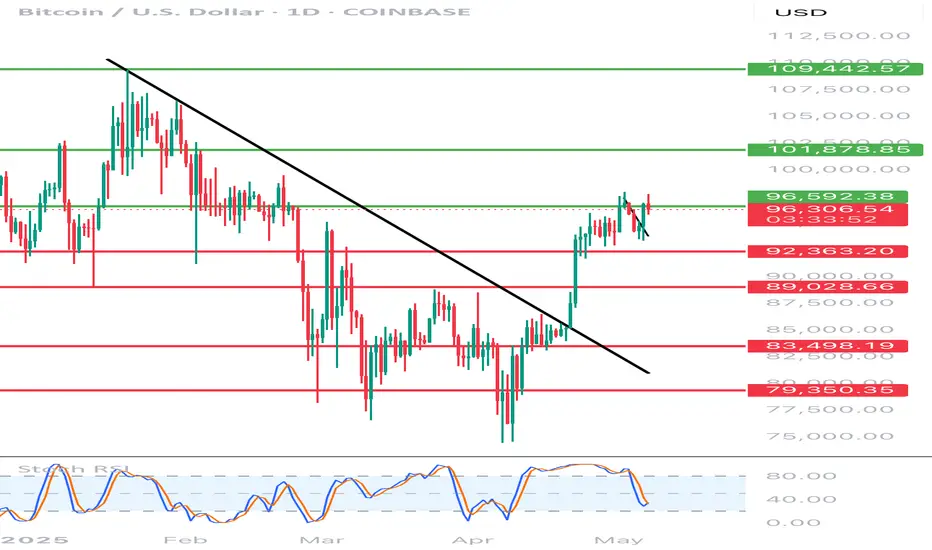
BTC/USD 1D chart ReviewHello everyone, let's look at the 1D BTC chart for USD, in this situation we can see how the price came out of a strong downward trend, which gave a strong upward movement for the price. Going further, let's check the places of potential target for the price:
T1 = 96592 $
T2 = 101878 $
Т3 = 109442 $
Let's go to Stop-Loss now in case of further declines on the market:
SL1 = 92363 $
SL2 = 89028 $
SL3 = 83498 $
SL4 = 79350 $
Looking at the RSI indicator, we can see that despite a small price change, the indicator strongly reacted what potentially can give energy to further price increases in the coming weeks.
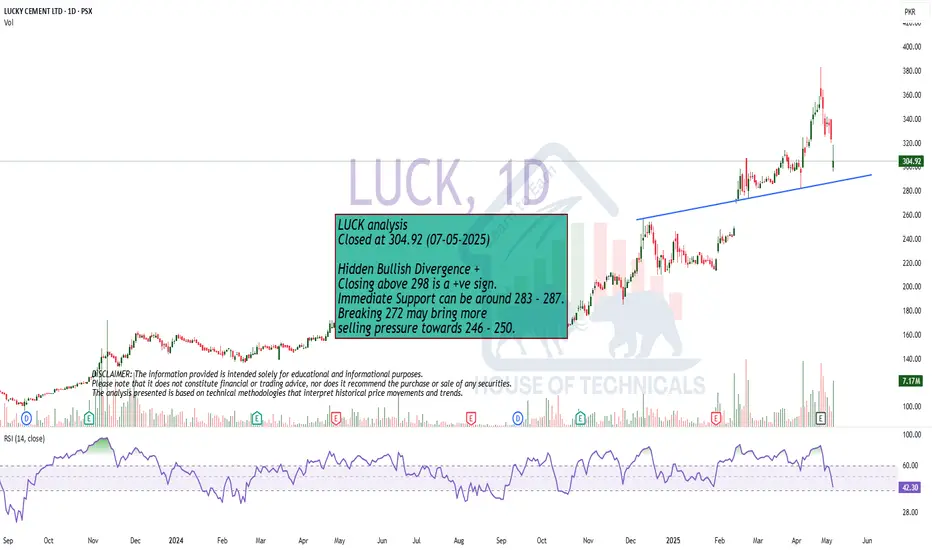
Hidden Bullish Divergence +Hidden Bullish Divergence +
Closing above 298 is a +ve sign.
Immediate Support can be around 283 - 287.
Breaking 272 may bring more
selling pressure towards 246 - 250.
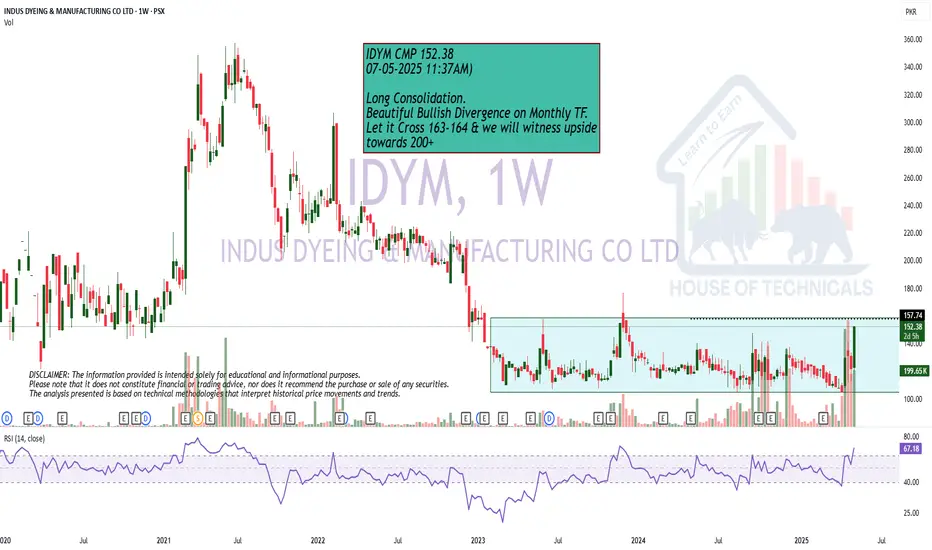
Near BreakoutLong Consolidation.
Beautiful Bullish Divergence on Monthly TF.
Let it Cross 163-164 & we will witness upside
towards 200+
at an Important Support
25.40 - 26 is an Important Support level.
25 should be the SL.
Upside targets can be around 27 - 28 initially.

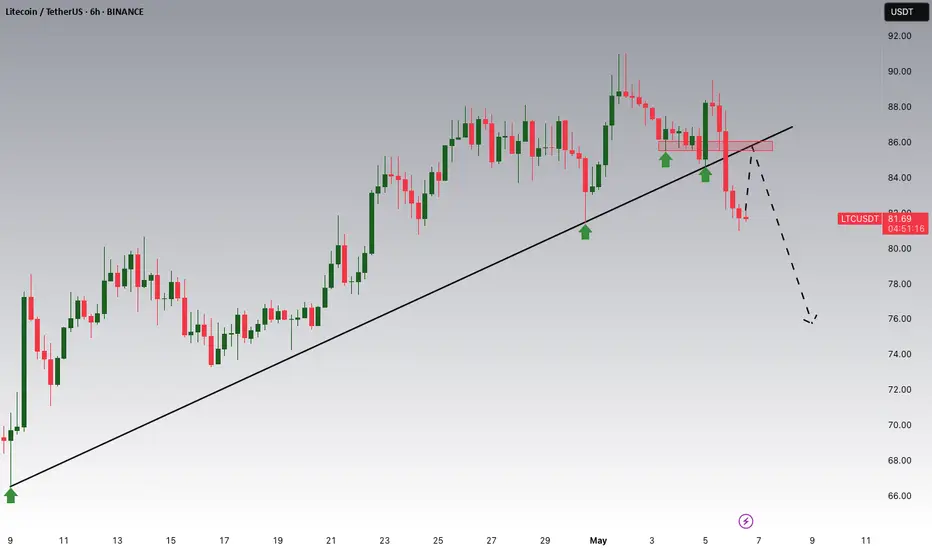
Litecoin Breakout And Potential RetraceHey Traders, in today's trading session we are monitoring LTCUSDT for a selling opportunity around 85 zone, Litecoin was trading in an uptrend and successfully managed to break it out. Currently is in a correction phase in which it is approaching the retrace area at 85 support and resistance area.
Trade safe, Joe.