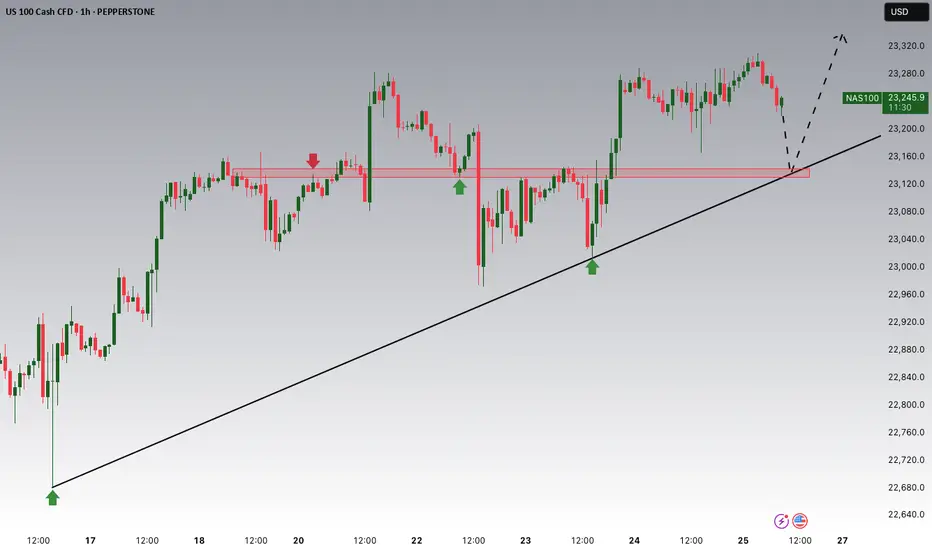
NASDAQ Potential UpsidesHey Traders, in today's trading session we are monitoring NAS100 for a buying opportunity around 23,140 zone, NASDAQ is trading in an uptrend and currently is in a correction phase in which it is approaching the trend 23,140 support and resistance area.
Trade safe, Joe.
Fibonacci Retracement
EURJPY ANALYSIS After seeing the weekly close bullish we could expect the pair to continue the bullish leg this new week with the daily and 4hr trading in the same direction. An upside target of 175.000 could be the profit taking areas for the next leg to the upside

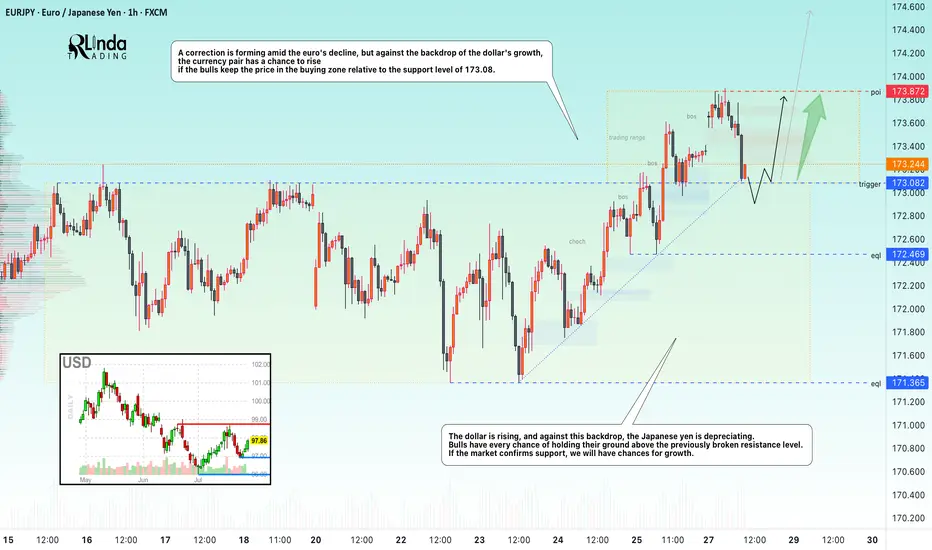
EURJPY → Retest support before growthFX:EURJPY has been correcting since the opening of the European session. The movement was triggered by yesterday's news related to the trade deal between the US and Europe...
EURJPY is reacting to news related to the deal between the US and Europe. A correction is forming amid the fall of the euro, but against the backdrop of the dollar's growth, the currency pair has a chance to rise if the bulls keep the price in the buying zone relative to the support level of 173.08.
The dollar is rising, and against this backdrop, the Japanese yen is falling. Bulls have every chance of holding their ground above the previously broken resistance. If the market confirms support, we will have chances for growth.
Resistance levels: 173.87
Support levels: 173.082, 172.47
The currency pair may form a liquidity trap relative to the previously broken consolidation resistance. A false breakdown of support and price consolidation in the buying zone (above 173.1) could trigger further growth.
Best regards, R. Linda!
ETH/USDT 4H Chart📊 General Context
Ethereum is rising in a strong short-term uptrend, supported by a rising trendline (orange).
Current price: 3831 USDT
We are approaching a significant resistance level around 3842–3850 USDT (green line).
Technical support is located around 3760 USDT (previous consolidation level and 50/200 SMA).
🔍 Technical Levels
Resistance:
3842–3850 USDT – local high, currently being tested.
4006 USDT – key psychological level and the last local high on the chart.
Support:
3762 USDT – previous resistance, currently turned into support (may be tested in a correction).
3650 USDT – strong technical support, confirmed several times in the past.
SMA50 and SMA200 – currently just below the price, also acting as dynamic support.
📈 Technical Indicators
MACD:
The histogram is rising and positive → bullish momentum.
The MACD line crosses the signal line from below → a buy signal.
RSI (14):
Currently: around 64 → not yet overbought, but close to the overbought zone.
Slightly rising trend, but may suggest impending market overheating with further gains.
🧭 Trend
Short-term: strong uptrend (trend line, green candles, breakout from consolidation).
Medium-term: higher lows and higher highs – the uptrend is maintained.
The price is holding above the 50 and 200 SMAs – confirming bullish sentiment.
⚠️ What to watch next?
A 4-hour candle close above 3842 USDT → confirmation of a breakout, a potential attack on 4000–4010 USDT.
A break of the trend line (orange) → a possible correction to 3760 or even 3650 USDT is possible.
An RSI rise above 70 → an overbought signal, a possible pullback or consolidation.

Gold Potential UpsidesHey Traders, in tomorrow's trading session we are monitoring XAUUSD for a buying opportunity around 3,320 zone, Gold is trading in an uptrend and currently is in a correction phase in which it is approaching the trend at 3,320 support and resistance area.
Trade safe, Joe.

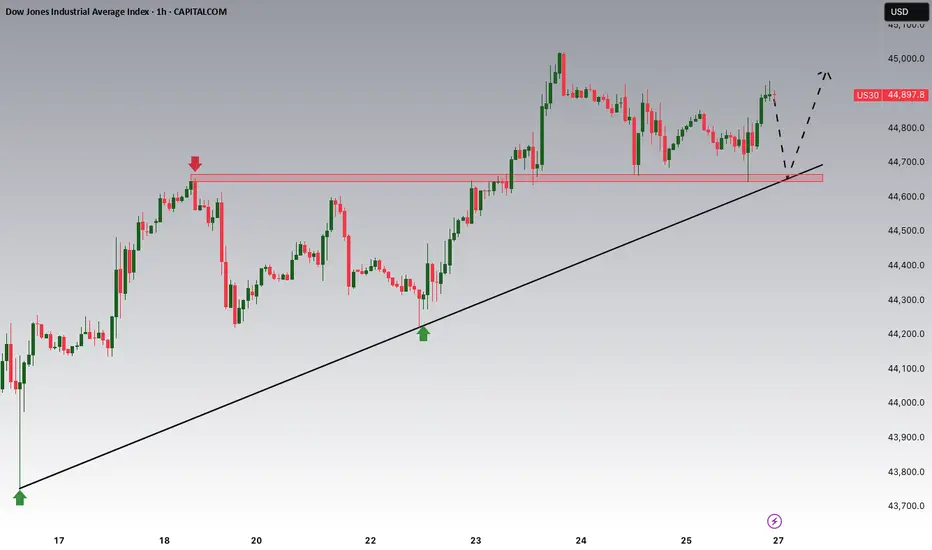
Dow Jones Potential UpsidesHey Traders, in the coming week we are monitoring US30 for a buying opportunity around 44,650 zone, Dow Jones is trading in an uptrend and currently is in a correction phase in which it is approaching the trend at 44,650 support and resistance area.
Trade safe, Joe.
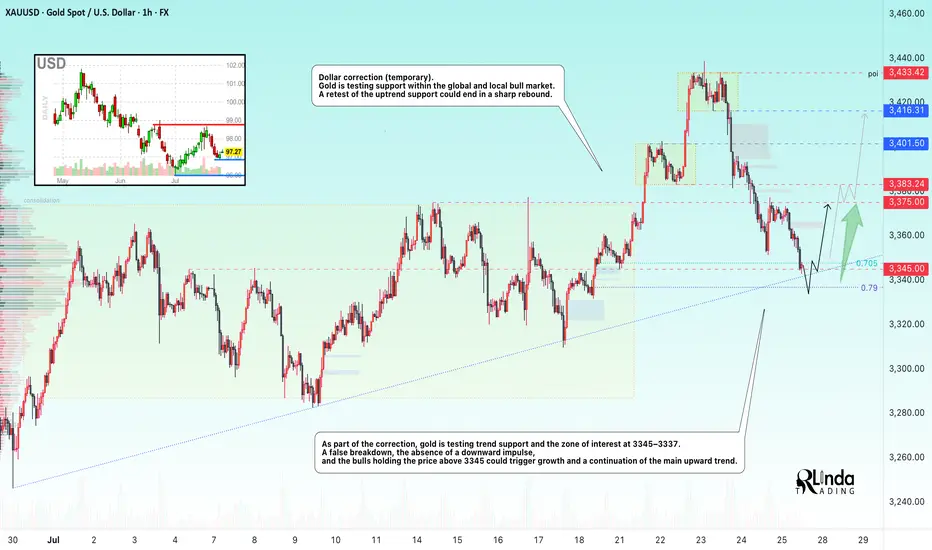
GOLD → Countertrend correction, retest of 3345 before growthFX:XAUUSD , undergoing a deep correction after a false breakout of local resistance at 3433, has reached the support of the upward trend. Will the bulls be able to maintain the trend?
Gold held below $3,400 on Friday, rebounding from $3,350, and is poised to end the week higher. Investors are watching the conflict between Thailand and Cambodia, which is boosting demand for safe-haven assets, and are also awaiting decisions from the Fed and the Bank of Japan next week. The markets received additional support from US trade deals with Asian countries and progress in negotiations with the EU, easing fears of a tariff war.
As part of the correction, gold is testing trend support and the 3345-3337 zone of interest. A false breakdown, lack of downward momentum, and bulls holding prices above 3345 could trigger growth and a continuation of the main upward trend.
Resistance levels: 3375, 3383
Support levels: 3345, 3337, 3330
Technically, the support level of 3345 plays a fairly important role in the market. If, during the correction, the bulls manage to hold their ground above this zone, the prospects for recovery will be high, especially against the backdrop of geopolitical problems.
Best regards, R. Linda!
GBPUSD → Retest of previously broken resistance...FX:GBPUSD has entered a correction phase after breaking through the local downtrend. If the price remains in the 1.3450–1.346 zone, this will confirm the formation of a new trading range...
The market is entering a correction phase due to the dollar. A countertrend retest of the support zone is forming. Earlier, the currency pair broke the local trend and is entering a flat phase. The retest of support may end with a recovery. If, within the local movement and after a false breakout of the 1.345 - 1.3467 zone, the bulls keep the price above the buying zone, then in the short and medium term, we can expect growth to continue.
Support levels: 1.3467, 1.345
Resistance levels: 1.35, 1.3584
A false breakdown of support at 1.3467 will confirm a change in the local trend (correction). The market may return to the recovery phase of the global trend.
Best regards, R. Linda!

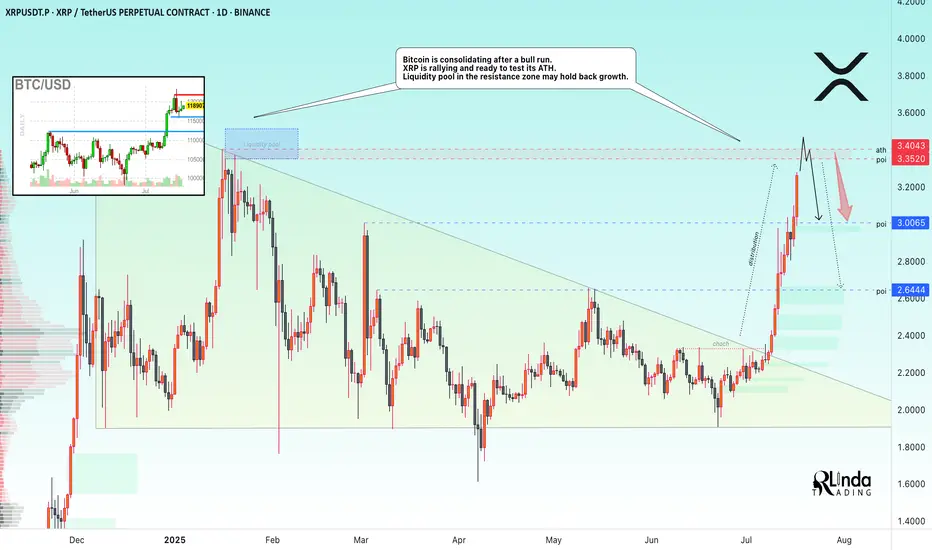
XRP → ATH retest. Reversal or continued growth?BINANCE:XRPUSDT.P is rallying and ready to test the resistance zone - ATH. Against this backdrop, Bitcoin is consolidating after a bull run. The liquidity pool may hold back growth.
Fundamentally, there is excitement across the entire cryptocurrency market. Altcoins are rallying after Bitcoin hit a new high and entered consolidation. The BTC.D index is declining, which generally provides a good opportunity for altcoins to grow. However, the index is approaching technical support, which may affect market sentiment overall...
As for XRP, there is a fairly strong liquidity pool ahead — the ATH resistance zone. The price is in a distribution phase after a change in character and a breakout of the downtrend resistance in the 2.33 zone. The momentum may exhaust its potential to break through the 3.35-3.34 zone, and growth may be halted for correction or reversal (in correlation with Bitcoin's dominance in the market).
Resistance levels: 3.35-3.40
Support levels: 3.0, 2.64
A breakout of resistance without the possibility of further growth, a return of the price below the level (i.e., inside the global flat) will confirm the fact of a false breakout of resistance, which may trigger a correction or even a reversal.
Best regards, R. Linda!
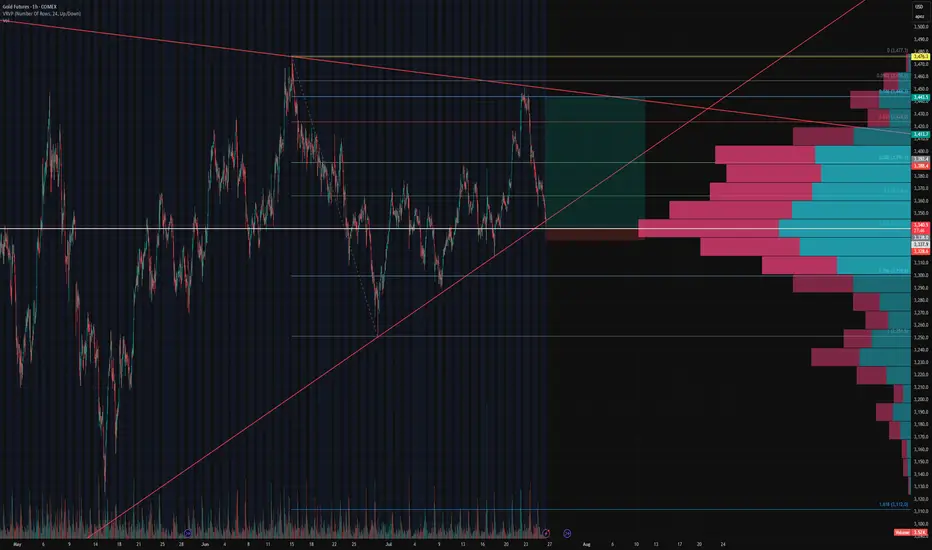
Gold Futures Update – 0.5 Fib Stop Hit, Eyes on 0.618 ConfluenceGold Futures Update – 0.5 Fib Stop Hit, Eyes on 0.618 Confluence
Our initial long setup at the 0.5 Fibonacci retracement level has been stopped out, but the structure remains constructive.
Price is now approaching a key confluence zone at $3,336 , where:
The 0.618 fib retracement from the recent swing low to high aligns perfectly,
The ascending trendline support (respected multiple times since May) intersects, and
The oint of Control (POC) from the visible volume profile shows dominant volume transacted.
This area represents a high-probability support level where bulls may attempt to defend again. We’re monitoring for reaction and potential entry signals around this level. A break below would invalidate the rising wedge structure and shift bias toward lower fib extensions.
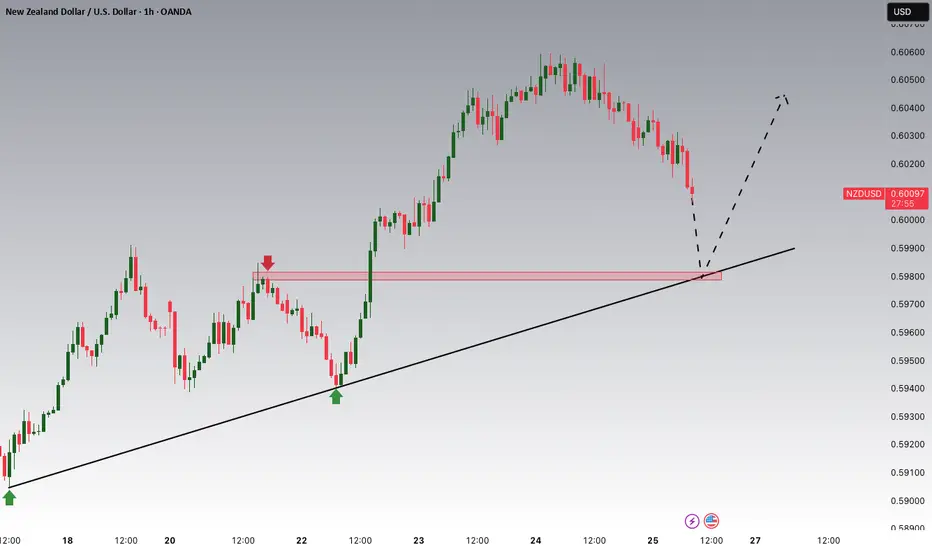
NZDUSD Potential UpsidesHey Traders, in today's trading session we are monitoring NZDUSD for a buying opportunity around 0.59800 zone, NZDUSD is trading in an uptrend and currently is in a correction phase in which it is approaching the trend at 0.59800 support and resistance area.
Trade safe, Joe.
GOLD → Countertrend correction. Where will growth begin?FX:XAUUSD faced pressure in the 3430 zone, traders moved into profit-taking mode, triggering a correction. The price entered the sell-off zone...
On Thursday, gold is trading below $3400 as traders assess progress in US-EU trade talks and await preliminary PMI data from the US and the EU. These indicators could influence expectations for Fed and ECB rates. Optimism is being bolstered by reports of trade agreements between the US and Japan and other countries. The ECB is expected to keep rates unchanged, while the probability of a Fed rate cut in September is estimated at 60%. Investors are also watching Trump's conflict with Powell amid his visit to the Fed. Technically, the daily market structure is not broken, and a correction is forming within acceptable limits.
Based on the current direction, the market may test the intermediate bottom: trend support, the 3345-3320 area.
Resistance levels: 3375, 3383, 3400.
Support levels: 3345, 3320
A retest of resistance at 3375-3383 is possible. If the bears keep the price below this zone, the metal may continue its correction phase towards the zone of interest indicated on the chart. Local sell-offs have not yet broken the bullish daily structure.
However, the absence of a downward impulse and consolidation in 3375 - 3383 with a subsequent breakout of local resistance could increase demand again, which would generally lead to premature growth to 3400 - 3435.
Best regards, R. Linda!

BTC/USD 4H Chart Review📊 Technical Structure (Symmetrical Triangle)
Formation: The symmetrical triangle (orange lines) remains intact—price continues to move within it.
Approaching the apex: The closer to the intersection of the triangle's arms, the greater the probability of a breakout. The current candle is testing the upper boundary of the formation (around $119,300), but has not yet broken it.
Direction: The formation is neutral, but tension is increasing. A breakout of either line (the upper boundary ≈$119,500 or the lower boundary ≈$117,700) could trigger a dynamic move with a range of around $3,000 (the height of the triangle at its widest point).
🧱 Support and Resistance Levels (Red and Green Lines)
Type Level (USD) Description
Resistance 123205 All-Time High – Possible Target After an Upward Breakout
Resistance 120556 Local Resistance – Triangle Breakout Range
Resistance 119200–119300 Currently Tested Level
Support 117752 Lower Triangle Boundary – Critical Defense Line
Support 115764 Next Local Support
📈 Technical Indicators
🔵 RSI (Relative Strength Index)
Currently: ~55 – indicates a neutral situation, having broken down from the overbought level (~74).
Indicates that the market has temporarily cooled down after a previous impulse. There is still room for further upward movement without exceeding 70.
🔵 MACD
The MACD and signal lines are approaching a crossover – if the MACD crosses the signal line upward, it could be a bullish signal.
The histogram is slightly positive – indicating weak but growing bullish momentum.
📊 Volume
Slightly increasing in the last candles – no confirmation of a strong breakout yet, but upward pressure is building.
🧠 Interpretation
Scenario Technical Conditions Movement Objective
🔼 Upward Breakout
Candlestick close above $119,500 USD 122,000–$123,200 USD
🔽 Downward Breakout
Close below 117,750 and confirmed by volume at 115,700, then 114,000 USD
🔄 Consolidation
Inconclusive, continued sideways movement
Between $117,700 and $119,500 USD
✅ Summary
Bitcoin is still in a neutral symmetrical triangle formation but is approaching a turning point.
The RSI has broken out of the overbought range, and the MACD is signaling a potential upside breakout.
Volume confirmation is still lacking, but technical conditions favor the bulls – if it manages to break above 119,500 and hold above, a move towards 122,000–123,000 USD can be expected.
In the event of a rejection, maintaining 117750 will be key; breaking it opens the way to 115700 and below.

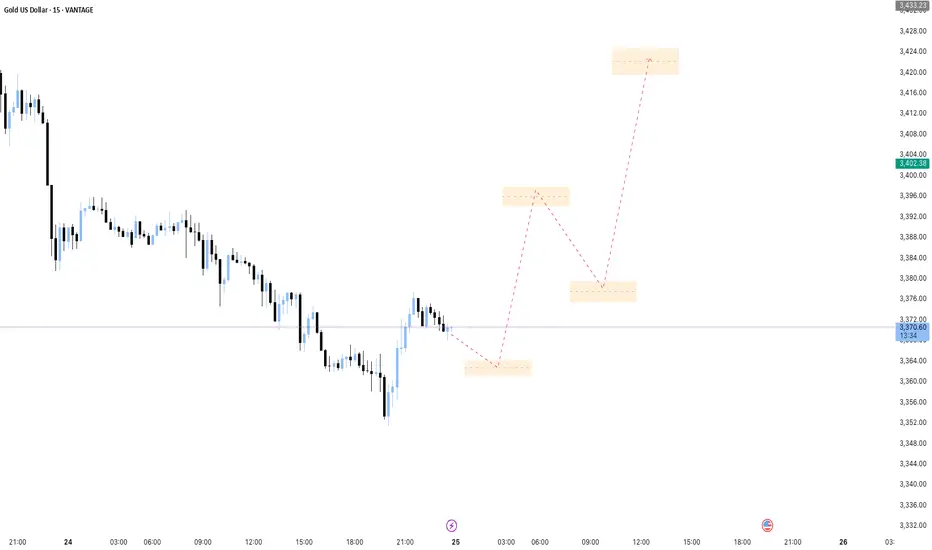
XAUUSD - Bullish Direction BiasThe Gold USD market on the 15-minute timeframe shows a notable downtrend followed by a retracement phase. The price is currently moving in a potential reversal structure with key areas marked as possible retracement or continuation points.
The chart highlights multiple potential support and resistance zones, indicated with small orange boxes, which mark anticipated areas for price reactions during the expected short-term moves.
The trading plan anticipates price to move upward towards these intermediate zones sequentially, with each zone acting as a minor resistance before price attempts to continue its bullish retracement. After reaching the higher target zone near 3424, a reversal or new wave is expected to unfold, potentially resuming the downtrend.
This plan emphasizes careful monitoring of price action at these key zones to confirm reversal or continuation signals. Traders should look for confirmation signals like pin bars, candle patterns, or volume clues at each zone before entering the trade.
Risk management involves setting appropriate stops beyond these resistance zones to protect against false breakouts or sudden trend changes.
This approach uses a combination of technical levels, price action confirmation, and careful zone analysis to guide trading decisions in a fast-moving market.
Here’s a fresh Nasdaq100 analysis I’ve put together for you.Hey Guys,
Here’s a fresh Nasdaq100 analysis I’ve put together for you.
I’ve marked the buy zone between 23,252 and 23,240. If price dips into that range, I’m anticipating a potential move upward toward 23,294.
Your likes and support are my biggest source of motivation to keep sharing these insights.
Huge thanks to everyone backing me with a thumbs-up!

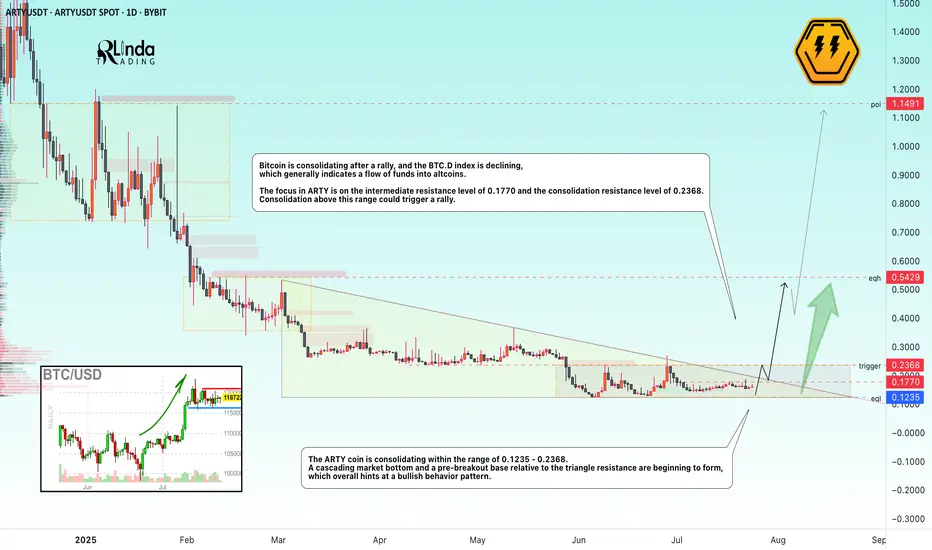
ARTYUSDT → A breakout of resistance could trigger another rallyBYBIT:ARTYUSDT is forming a cascading bottom as part of consolidation before a possible breakout of resistance. The decline in Bitcoin's market dominance gives altcoins a chance.
( (Idea from September 29, 2024!) We previously discussed this coin before its 300% rally. The root causes of its emergence from accumulation and readiness for strong growth were correctly identified).
The dump phase is coming to an end, a cascading market bottom is beginning to form, and a pre-breakout base relative to the triangle resistance is forming, which overall hints at a bullish behavior pattern.
Bitcoin is currently consolidating after the rally, and the Bitcoin dominance index is declining, which generally indicates a flow of funds into altcoins. The situation is such that the altcoin market has another chance for the season. The correction across the entire market may end in the near future, and under favorable conditions (the fundamental background is strengthening, Trump has announced another important event for cryptocurrencies), the market may return to strong movements...
The focus in ARTY is on the intermediate resistance at 0.1770 and the consolidation resistance at 0.2368. Consolidation above this range could trigger a rally.
Resistance levels: 0.2368
Support levels: 0.1235
Technically, a few days ago, the coin tested the consolidation resistance, but the decline did not continue, which generally indicates that buyers are showing interest and holding the market. Consolidation in the near term may end with a retest of 0.1770, 0.2368, a breakout, and further growth.
Best regards, R. Linda!
SOL CRUSHING-bearish risks developing🔻 4-Hour Bearish Thesis
🔸 Price Action Clues
SOL is currently stalling at the 0.5 Fibonacci retracement (~$198.18) of the full macro move — a classic profit-taking zone.
Multiple upper wicks and indecisive candles at resistance indicate supply absorption and buyer exhaustion.
After a steep rally, price is moving sideways in a rising wedge/flag, which is a bearish continuation pattern if broken downward.
🔸 Momentum + RSI
RSI at 76 is extended and flattening — often a zone where short-term pullbacks begin.
No confirmed bearish divergence yet, but momentum is weakening compared to earlier stages of the rally.
🔸 Volume Profile
Volume on recent pushes is lower than during breakout, suggesting diminishing bullish conviction.
Bearish if a breakdown below $194 occurs — that's the former breakout level and wedge support.
🧨 4H Breakdown Confirmation
Break below $194 (key short-term support) → opens downside targets:
🔻 $186–$182 (prior breakout base)
🔻 $171 (0.382 Fib retracement zone)
🔻 Daily Bearish Thesis
🔸 Price Action + Key Zone
Price is pressing against the neckline target ($198.18) of the inverse H&S pattern.
Stalling under the red resistance line and 0.5 Fib.
Recent candle closed with a small upper wick + reduced body size, hinting at hesitation after a parabolic run.
🔸 RSI Risk
RSI is at 80.41 — very overbought on daily.
While not immediately bearish on its own, this often precedes either:
Sharp correction, or
Prolonged consolidation
🔸 Fibonacci & Macro Resistance
$198–$200 is a confluence zone of:
0.5 Fib retracement
Previous structural resistance
Measured target of inverse H&S pattern ALREADY HIT.
This is not a great spot to initiate new longs — any weakness here invites a pullback.
⚠️ Invalidation of Bearish Thesis
A strong daily close above $200–$204, ideally with expanding volume, would invalidate the bearish outlook and shift momentum toward $219 (0.618 Fib).
🧠 Summary:
Yes, there is a short-to-mid-term bearish risk developing on both 4h and daily:
Overbought RSI
Stalling at major Fib resistance
Decreasing momentum
Vulnerable if $194–$195 breaks
Remember: this WILL MOST LIKELY BE A SHORT-SHORT pullback, not a confirmed trend reversal… yet. BUT I'VE INITIATED A STARTING POSITION!
THIS IS NOT FINANCIAL ADVICE. DrAnkin Smöökëē Whizkee. Edumacational Purpiz Only!

Revsiting $150k - $200k Bitcoin (AND Next Bear Market Bottom)In this video I revisit my 2-year old study showing the potential path for Bitcoin to $150k to $200k and not only how we might get there, but the 11 reasons WHY we can this cycle.
This is the same Fibonacci series that predicted the 2021 cycle high at the 3.618 (Log chart) and used the same way this cycle, with some interesting 2025 forecasts of:
1.618 - $100k
2.618 - $150k
3.618 - $200k
There are quite a few confluences that we get to $150k like the measured moves from both the recent mini bull flag, but also the larger one from earlier this year.
** Also I touch on revisiting my study from 2 years ago where I may have discovered the retracemebnt multiple that correctlty predicted and held the 2022 lowes around $16k. **
It's a VERY interesting number you all will recognize (buy may not agree with).
Let me know what you think.

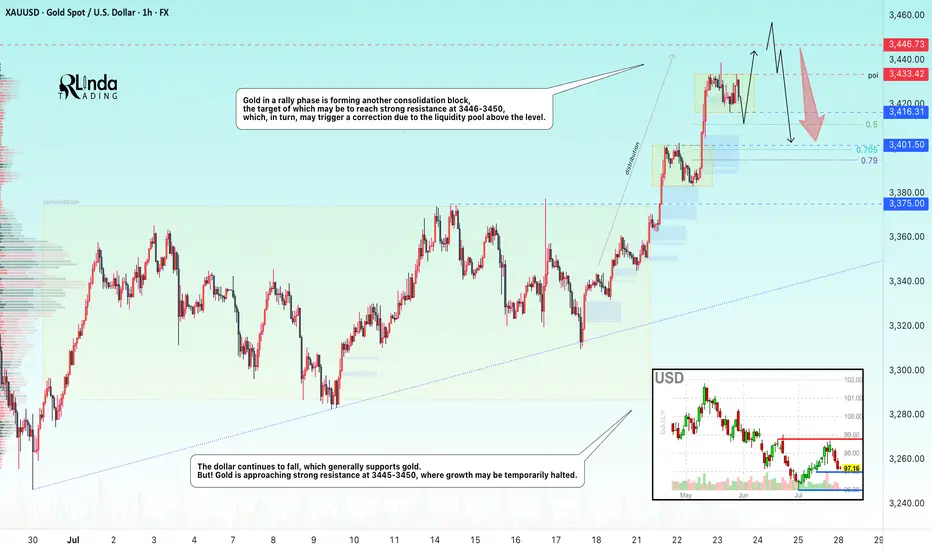
GOLD → Consolidation before the next jump to 3450?FX:XAUUSD continues to rally, with the price updating its local high to 3438 and moving into consolidation, possibly for another jump...
After hitting a five-week high of $3,438, traders are taking a break. Optimism is fuelled by Trump's statements about the largest deal with Japan and negotiations with Canada, but uncertainty about the details of the agreements and political instability in Japan are keeping caution in check. The market is waiting for further signals on trade and political issues, which remain key factors for gold.
Technically, the dollar continues to fall, which generally supports gold. But! Gold is approaching strong resistance at 3445-3450, where growth may be temporarily halted.
Resistance levels: 3433, 3446
Support levels: 3416, 3401, 3375
As part of a local correction, gold may test consolidation support or 0.5-0.7f before continuing to rise. There are quite a few orders in the 3433-3446 zone, and it will be difficult to break through this area to reach the target. Consolidation before this level may help the rise to continue.
Best regards, R. Linda!
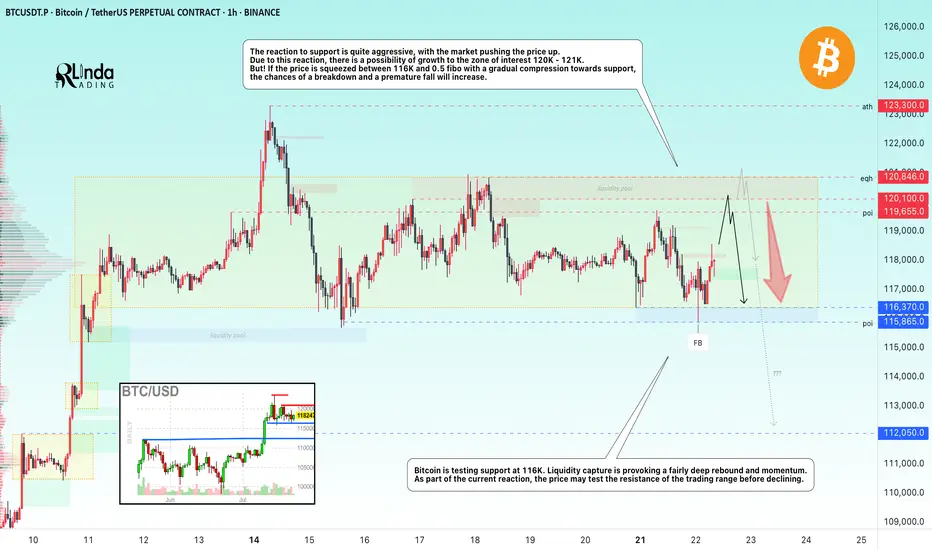
BITCOIN → Consolidation and compression to 116K. Correction?BINANCE:BTCUSDT.P continues to consolidate, with the price testing support at 116K, leaving behind the zone of interest at 120K-121K. Are there any chances for further growth?
(Alternative scenario (if growth to 120K does not occur))
Fundamentally, there is nothing particularly new, and the hype surrounding Bitcoin is stagnating. Technically, on D1, consolidation is underway with pressure from bears against the backdrop of an outflow of funds into altcoins. However, the dominance index is starting to rise, which could trigger some correction in the market. The price on the working timeframe, without updating local highs, is testing lows, and the latest retest of the liquidity zone is provoking a fairly aggressive reaction that could bring the price to retest the zone of interest at 120K-121K.
But! If the price is squeezed between 116K and 0.5 Fib with a gradual squeeze towards support, the chances of a breakdown and a premature fall will increase.
Support levels: 116370, 115860
Resistance levels: 119650, 120100
Technically, the market needs a breather or correction, which is generally a sign of health. The nuance with Bitcoin is that below 115860 there is no support until 112K, and if the market breaks the current consolidation boundary, the further correction could be quite deep. In the current situation, I do not yet see any drivers or reasons for another rally.
Best regards, R. Linda!
EUR/USD - Holding Bullish Structure Above Key Fibs and TrendlineTechnical Overview:
EUR/USD continues to respect its ascending channel structure, currently rebounding from the lower trendline support while trading above the 50 EMA and 200 EMA. After a healthy retracement to the monthly support (1.16128), the pair has shown strong buying interest, supported by bullish RSI divergence from oversold conditions on the 8H chart.
Key Levels:
Support Zone: 1.1613 – 1.1634 (Fib Cluster + Channel Support + Monthly Support)
Resistance Zone: 1.1755 (Weekly Resistance) followed by 1.1816 (0.27 Fib Extension) and 1.1887 (0.618 Extension)
Invalidation Level: Below 1.1533 (1.272 Fib + Structural Breakdown)
Confluences:
Price broke above a descending correctional trendline, indicating a potential bullish continuation.
Multiple Fibonacci levels (0.382, 0.5, 0.618) have stacked around the previous consolidation area, increasing probability of a sustained move.
RSI bounce from below 40 suggests short-term momentum reversal.
Trade Idea:
We may see a minor pullback into the 1.16344–1.1659 area before a potential continuation higher. Conservative bulls may wait for a retest of this zone with a bullish engulfing or pin bar confirmation before entering long.
Targets:
First target at 1.1755 (prior weekly resistance)
Second target at 1.1816 (Fib extension)
Final target near 1.1887 (major resistance / upper channel boundary)
Risk Management:
A break and close below 1.1533 would invalidate the bullish setup and signal potential bearish pressure returning to the pair.

GBP/JPY 4H - Rejection from Supply Zone and Key Fib AreaOverview:
GBP/JPY is trading near 197.91, and recent price action suggests a potential short opportunity. The pair has been rejected from a key Fibonacci resistance zone, and bearish momentum appears to be building beneath a fading ascending channel. Let’s break down why this chart leans more bearish.
Market Structure Breakdown:
* Price action failed to sustain new highs above 199.90 and is now forming lower highs, a potential early sign of trend exhaustion.
* The recent bounce from 197.40 was muted and rejected near the 0.5 and 0.618 retracement levels, indicating strong supply around the 198.68–198.98 zone.
Fibonacci Confluence:
* The rejection occurred right at the 0.618 retracement of the prior downswing — a key Fibonacci level often used by institutional traders to re-enter in the direction of the trend.
* Price is now hovering below the 0.382 (198.38) and 0.5 (198.68) levels, which may now act as resistance.
* If the current rejection holds, downside targets are:
* 0.0 (197.40) – recent low
* -0.27 extension (196.70) – potential bearish continuation target
* -0.618 extension (195.81) – extended downside objective
Trendline & Channel Considerations:
* The ascending channel is losing momentum.
Moving Averages:
* Price is now below the 50 EMA, and testing the 200 EMA, which is at risk of breaking.
* A clear close below both EMAs would confirm bearish momentum.
RSI & Momentum:
* The RSI shows bearish divergence on recent highs and is struggling to break above the midline (50).
* Momentum is tilting to the downside and failing to build higher on bounces.
Key Zones:
* Resistance Zone: 198.60–198.98
* Strong Fibonacci confluence + previous supply
* Support Zone: 197.40
* Prior swing low and 0.0 Fib level
* Bearish Continuation Zone: Below 197.30
* Breakout would confirm downside acceleration toward 196.70 and 195.80
Conclusion:
GBP/JPY is showing signs of bearish pressure beneath key resistance. With the rejection from the 0.618 Fib level and weakening channel structure, the path of least resistance may be to the downside — especially if price breaks and holds below 197.40.
A confirmed breakdown opens the door toward 196.70 and possibly 195.80, as bearish continuation unfolds. Overall we can even see price hitting past historical levels at 189.50

The US100-Nasdaq Playbook: Prime Sell Zone Approaching!Hey friends 👋
I’ve prepared a fresh US100-NASDAQ analysis for you all. Nothing makes me happier than seeing us grow and profit together.
📌 Once price reaches the 23,192 – 23,231 zone, I plan to enter a **Sell** trade from that area.
🔐 Feel free to set your stop-loss based on your personal margin and risk tolerance.
🎯 My target level is: **23,024**
Every single like from you means the world to me—it’s my biggest motivation to keep sharing high-quality analysis 🙏
Huge thanks to everyone who supports with their likes 💙
