ALCHUSDT → Rally to the liquidity zone. False breakout?BINANCE:ALCHUSDT.P is one of not many coins that looks strong amid the bearish cryptocurrency market. But how long will this energy last? There is strong resistance ahead....
A local pre-breakdown consolidation relative to the intraday level is forming. In general, this is the state of the market, ready to continue its growth within the distribution.
Thus, the breakout of 0.1590 resistance will provoke the continuation of growth up to the liquidity zone at 0.177. But already at 0.177, due to the fact that it is an important and strong intermediate resistance level, we should expect a false breakout and a pullback, for example, to 0.159 or 0.5 fibo.
Resistance levels: 0.159, 0.177, 0.23
Support levels: 0.1516, 0.5 fibo
The distribution is already 53% since the breakout of the consolidation resistance. By the time the resistance is approached, it will be 77% and the market may use up all the accumulated potential, so liquidity above 0.177 is likely to stop the upward rally and turn the coin down.
Regards R. Linda!
Fibonacci Retracement

GOLD → Correction to support. What's next?FX:XAUUSD updates a new high to 3357. A correction is forming after Powell's speech. On the background of the bullish trend it is worth looking for stronger support levels
Gold halted gains at $3,358 as traders take profits and assess the implications of Trump's tariff policy.Gold's gains on the week were driven by the escalating trade war between the US and China, fears of a US recession and a flight from risk assets. However, cautious rhetoric from Fed chief Powell and positive signals from trade talks with Japan temporarily curbed further gains in gold. But the level of risks and possible escalation of the conflict is still at a high level.
It is too early to talk about the trend change. At the moment the correction to liquidity zones is forming on the background of the bullish trend. The focus is on 3296, 0.5 fibo. The price may bounce from these levels.
Resistance levels: 3344, 3457
Support levels: 3320, 3296, 3275
The correction after Powell's speech may be quickly exhausted if the politicians from China and the US fuel the conflict. But any hints of negotiations and tariff cuts could be taken very positively by the market, which could lead to a reversal of the local trend.
Regards R. Linda!

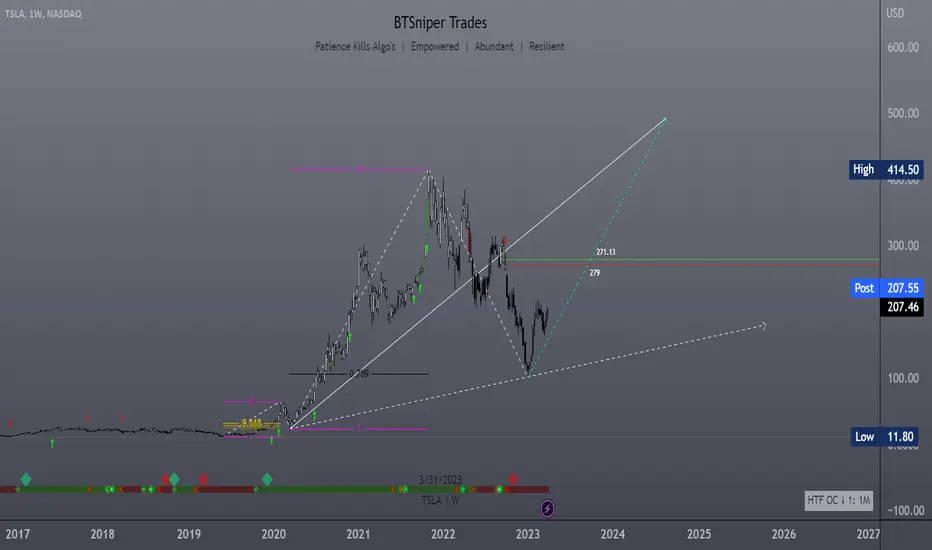
TESLA | Weekly HTF TargetAfter having a deep retracement ~70% tesla looks ready to reach Higher Highs...
New High target: $490+
BNB/USDT 1D chartHello everyone, let's look at the 1D BNB chart to USDT, in this situation we can see how the price came closer to the local lines of the downward trend. Going further, let's check the places of potential target for the price:
T1 = $ 607
T2 = $ 632
Т3 = 660 $
T4 = $ 744
Let's go to Stop-Loss now in case of further declines on the market:
SL1 = $ 553
SL2 = $ 521
SL3 = $ 500
SL4 = 474 $
Looking at the RSI indicator, we see
As we bounced from the inside of the range, remaining in the lower part, which gives room for potential increases.

GOLD → If you didn't catch the train, what should you do?FX:XAUUSD in a rally. Running into a train that is already in motion is prohibited due to the lack of ability to calculate risks. Ahead of the news, a correction is possible, which will allow us to find a place to trade
Gold continues to update an all-time high on the back of expectations of retail sales in the US and the speech of Fed chief Powell. Price growth was supported by strong data from China, increased demand for “protective assets” due to geopolitical tensions and trade risks between the U.S. and China. Additional support was provided by forecasts of gold price growth from ANZ to $3,600 by the end of the year
Technically, the psychological zones of interest 3325 - 3350 are ahead, from which a correction may form. The ideal scenario is to wait for a correction to local or intermediate support levels and only there look for an entry point.
Resistance levels: 3318, 3335, 3350
Support levels: 3275, 3265, 3244
On the background of a strong bull market it is worth using as a productive strategy to trade on the breakdown of resistance in order to continue growth, but in this case we need to wait for consolidation, we do not have it.
Or wait for correction, support retest and only then consider buying.
Regards R. Linda!

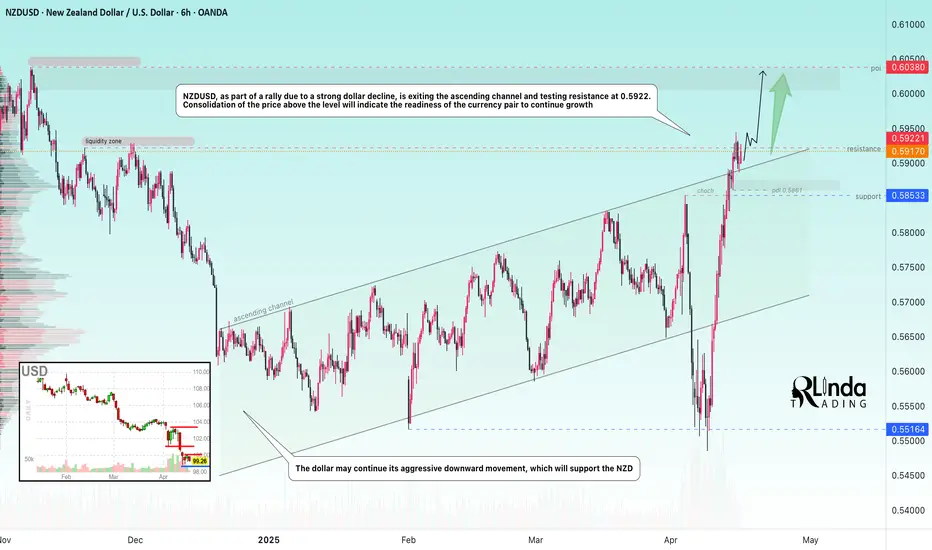
NZDUSD → Is there a chance for continued growth?FX:NZDUSD within the framework of the rally, which is associated with a strong decline in the dollar, is exiting the ascending channel and testing the resistance at 0.5922.
Against the backdrop of the falling dollar, which is associated with economic factors, the New Zealand has good chances to continue to grow. Consolidation of the currency pair above the level will indicate the readiness of the currency pair to continue to grow.
But! Today is quite a day full of economic news. Traders are waiting for Core retail sales & retail sales, as well as Powell's speech at 17:15 UTC. High volatility is possible!
Resistance levels: 0.5922, 0.6038
Support levels: 0.5853
A small correction may be formed from the resistance, but another retest and price consolidation above 0.5922 may be a good signal for both the bulls and us to make decisions. The currency pair has all chances to reach 0.6000
Regards R. Linda!
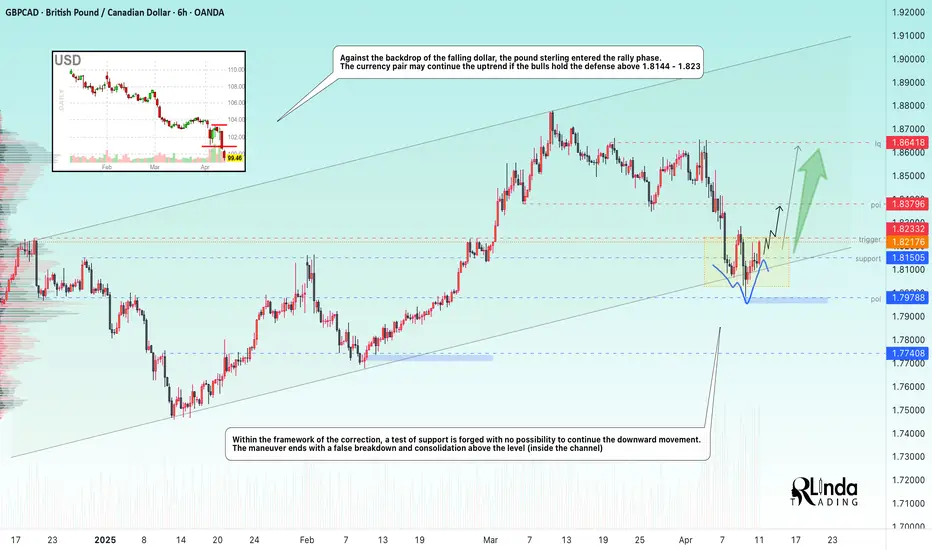
GBPCAD → False breakdown, where do we go from here?FX:GBPCAD is forming a false breakdown of trend support. Against the backdrop of the falling dollar, the pound sterling went into the rally phase, which is favorable for the currency pair.
The fundamental situation is in favor of GBP and CAD against the dollar, which continues its rapid decline.
As part of the correction, the currency pair forms a test of support without the opportunity to continue the downward movement. The maneuver ends with a false breakdown and consolidation above the level (inside the channel). The currency pair may continue the uptrend if the bulls hold the defense above 1.8144 - 1.823
Support levels: 1.81500, 1.79788
Resistance levels: 1.8233, 1.83796
Accordingly, based on the fact that we have an uptrend, a strong currency pair (on the background of a weak dollar) and a false breakdown of support, we can say that the price is not allowed down and it is worth considering an attempt to continue the uptrend.
Regards R. Linda!
Trend Support and 18M AVWAP: Our Final Stronghold📜 Field Orders – Operation: Defensive Line
Troops, listen up.
We’re falling back to our key defenses—Trend Support and the 18M AVWAP.
Hold your ground.
Do not charge.
We wait.
🎯 Your Orders:
Stand down unless support is broken cleanly with force.
If the red army pushes through and confirms—join the short side.
Enter only with structure, never emotion.
Protect your treasures—capital is your ammunition. Don’t waste it fighting in the chop.
If this is a trap, and you’re caught in it—retreat immediately.
Take the loss. Regroup. Redeploy with strength and clarity.
If we bounce here—watch for signs of a counteroffensive near the AVWAP wall.
But again—only enter with confirmation. Not hope.

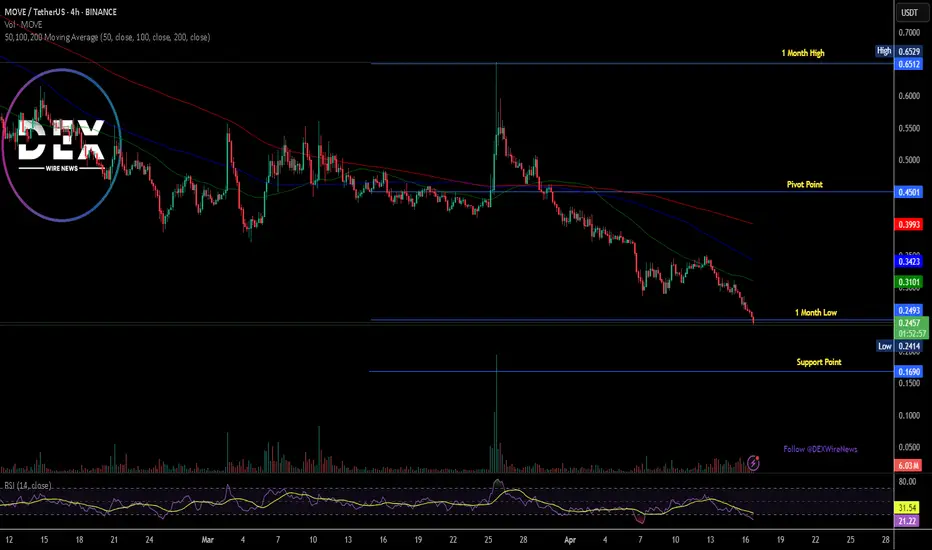
Breaking: Movement Token ($MOVE) Dips 12% TodayThe price of Movement coin ( TVC:MOVE ) nosedived 12% today, leading to a bearish pennant.
The ecosystem of Modular Move-Based Blockchains that enables developers to build secure, performant, and interoperable blockchain applications, bridging the gap between Move and EVM ecosystems has experience immense selling pressure today albeit the general crypto industry was also in a state of turmoil with CRYPTOCAP:BTC losing its $85k grip now down to $83k.
The first Move-EVM L2 for Ethereum has not being exempted, as hinted by the RSI at 20.64, TVC:MOVE has long being oversold with the asset moving around the 1-month low axis and a break below that axis could be dire for TVC:MOVE token.
Similarly, a break above the 50% Fibonacci retracement point could resort to a bullish reversal for Movement token ( TVC:MOVE ).
Movement Price Data
The Movement price today is $0.251764 USD with a 24-hour trading volume of $104,973,849 USD. Movement is down 10.27% in the last 24 hours. The current CoinMarketCap ranking is #87, with a live market cap of $616,822,310 USD. It has a circulating supply of 2,450,000,000 TVC:MOVE coins and a max. supply of 10,000,000,000 MOVE coins.
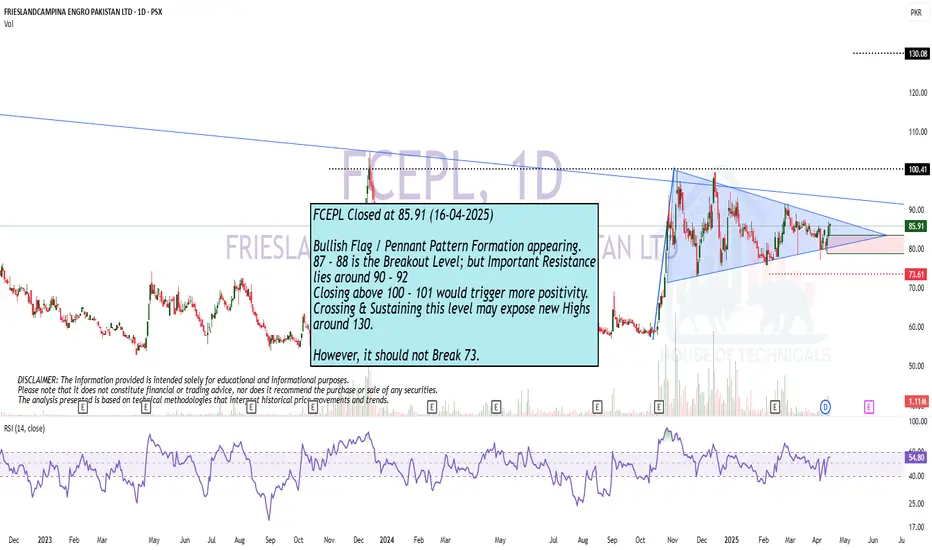
Bullish Flag / Pennant Pattern Formation appearing.
Bullish Flag / Pennant Pattern Formation appearing.
87 - 88 is the Breakout Level; but Important Resistance
lies around 90 - 92
Closing above 100 - 101 would trigger more positivity.
Crossing & Sustaining this level may expose new Highs
around 130.
However, it should not Break 73.
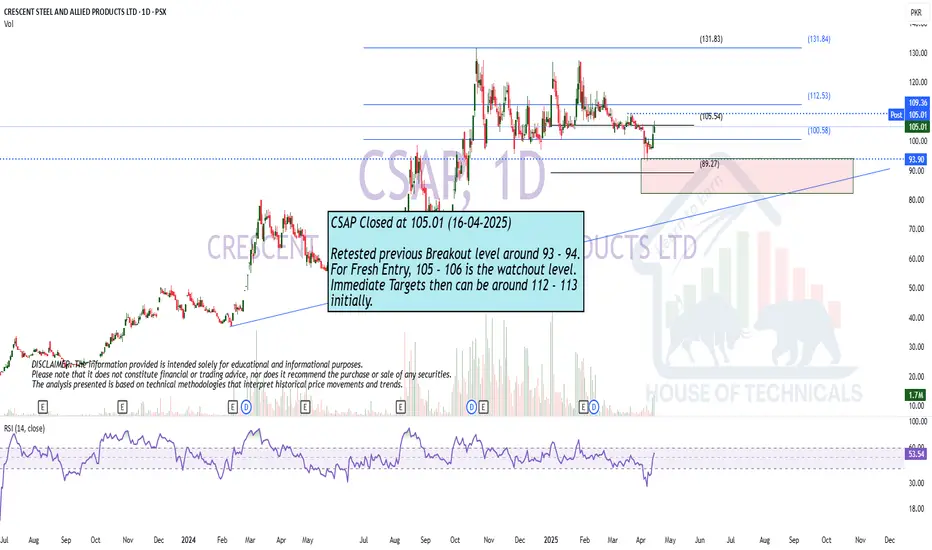
Breakout Retest done?Retested previous Breakout level around 93 - 94.
For Fresh Entry, 105 - 106 is the watchout level.
Immediate Targets then can be around 112 - 113
initially.
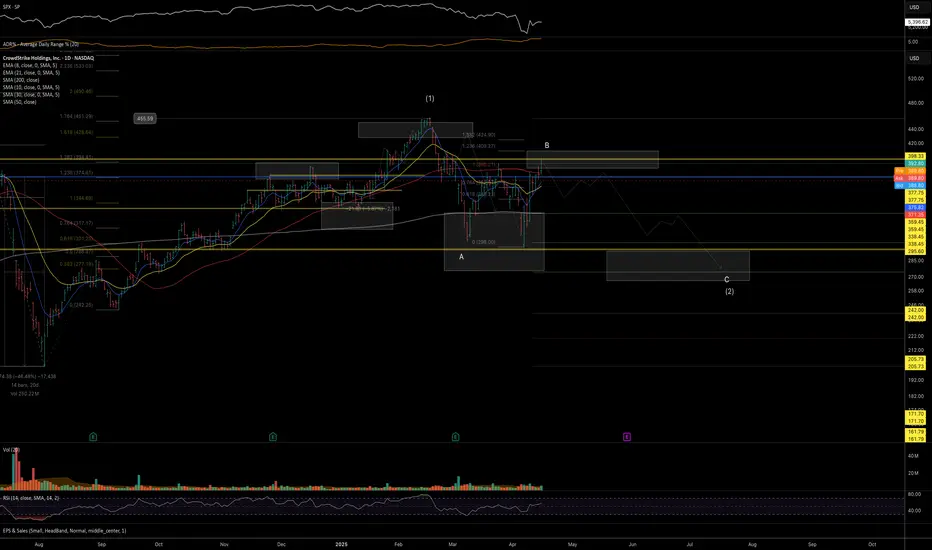
CRWD: in main resistance for one more leg down Price has now reached an ideal resistance zone, aligning with the 2024 summer top, where a bounce (wave B) is to complete itself.
As long as price remains below the 425 level, I see the odds favoring another leg lower, targeting the macro support zone around 300–270.
Thanks for your attention and best of luck with your trading!
AERGO: Golden Pocket Hit – Crash Incoming?On April 3rd, AERGO hit a historic low of $0.04746—and just 13 days later, it's trading around $0.60, an astonishing +1500% surge in less than two weeks. The rapid rise begs the question: What are the bulls aiming for next, and how sustainable is this move?
Key Observations:
Explosive Rally:
AERGO’s meteoric move from $0.04746 to $0.70 in just 13 days has propelled the coin into uncharted territory. Such a dramatic spike is not only eye-catching but also raises concerns about overextension.
RSI Overbought:
The daily RSI sits at 98, indicating extreme overbought conditions. This level suggests that the current rally is unsustainable and may be ripe for a pullback.
Historical Resistance Levels:
Looking back at 2021, key highs were established around $0.60 to $0.62. These levels serve as critical resistance zones.
Fibonacci Confluence:
Taking the Fibonacci retracement from the low at $0.04746 to the previous rally's high at $1.0809 (April 13, 2024), the 0.618 level is projected at $0.68613. The bulls just tested that golden pocket.
Trade Strategy & Potential Setups:
For Longs:
With the market showing signs of being overbought (RSI at 98) and the explosive move possibly winding down, this may be the perfect opportunity to take profits rather than accumulate further.
Take Profit Consideration:
Target: Near the 0.618 fib retracement at $0.68613.
Observation: If bulls push beyond this level, the move might extend — however, the risk of a sharp pullback is high given current overbought conditions.
For Shorts:
A corrective move is very much on the table, and traders looking to short should focus on the key resistance zone between $0.60 and $0.70.
Short Setup:
Entry: Look to initiate shorts near the $0.60–$0.70 zone.
Target: $0.4 and $0.2 as take profit targets
The Big Question:
Will AERGO drop as sharply as it surged? Given the extreme overbought conditions and the rapid, unsustainable spike, a healthy—and perhaps brutal—correction seems very possible. Keep a close eye on volume and price action near the $0.60–$0.70 resistance zone and be ready to adjust positions accordingly.
Anyone riding this wave has experienced one of the wildest moves in recent memory. For those in long positions, consider taking profits now; for potential short traders, watch those key levels tightly. The market's rhythm will soon reveal its next chapter.

GBP/JPY - Resistance into fibonacci golden pocketGBP/JPY 1H Technical Analysis - Key Levels
Price action shows clear resistance zones marked by Lift indicators at 0.28 , 0.08 , and 0.06 levels. The market appears slightly overbought with Lift readings of 0.01 to 0.05 , suggesting potential for pullback or consolidation.
Key observations:
- Resistance cluster between 0.06-0.28 may cap upside moves
- Overbought conditions warrant caution for longs
- Monitor Lift indicator for trend continuation signals
Trading approach:
Consider short opportunities near resistance with stops above 0.28 , or wait for pullback to support for long entries if momentum sustains.
for more FX analysis. Comments welcome!

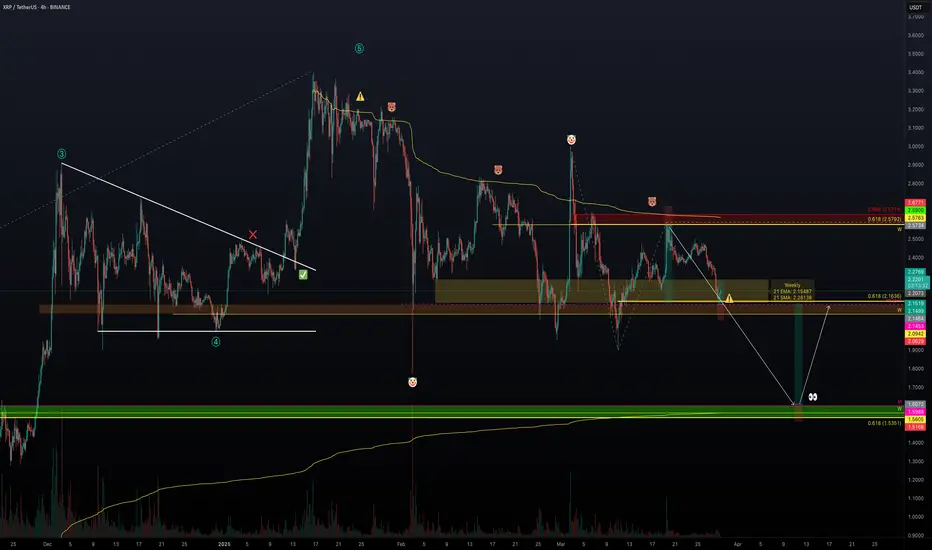
XRP - Choppy Market, Will We See $1.5 Again?After finishing the 5-wave structure in early 2025, XRP had a rough patch, trading between $3 and $2 and offering some pretty neat swing trade opportunities. Now, two months later, the big question is: will this range continue, or is a breakout on the horizon? Let’s break down the key levels and high-probability setups.
Short Trade Setup
Resistance Zone:
The weekly level and the 0.618 Fibonacci retracement are both around $2.5763 to $2.5792, aligning nicely with each other.
The anchored VWAP from the all-time high at $3.4 adds extra resistance at about $2.63.
Setup Details:
A low-risk short trade can be considered at the weekly level, with a stop-loss set above both the anchored VWAP and the swing high.
Target: The monthly open, aiming for an R:R of about 4:1.
Support Backup:
Additional support in this range comes from the 0.618 Fibonacci retracement (from a low at $1.9 to a high at $2.59), the weekly 21 SMA at $2.28, and a weekly level at $2.0942 just below the monthly open.
This support between the weekly level at $2.0942 and the monthly open is crucial for maintaining bullish momentum. If it holds, the bearish short setup stands; if it breaks, things could get tricky.
Long Trade Setup
When to Consider a Long:
If the support zone mentioned above fails, look for a long trade opportunity at the swing low around $1.77.
Support Confluence:
Primary Support: The swing low at $1.77, with lots of liquidity around that area.
Additional Layers:
The monthly level at $1.5988.
The weekly level at $1.5605 sits just below the monthly.
The 0.618 Fibonacci retracement from the 5-wave structure at $1.5351.
Anchored VWAP from the low at $0.3823, aligning with the weekly level.
And don’t forget the psychological level at $1.5.
Setup Details:
This long trade setup would offer an attractive R:R of roughly 6:1, targeting back to the monthly open for an approximate 33% gain, with a stop-loss placed below the $1.5 mark.
XRP's current trading range has provided some good short and long trade setups, a long opportunity at the swing low ($1.77-$1.5) could be the next big play. Whether you lean towards short or long, finding these confluence zones helps in making more informed, high-probability trade decisions.
If you found it helpful, please leave a like and a comment. Happy trading!
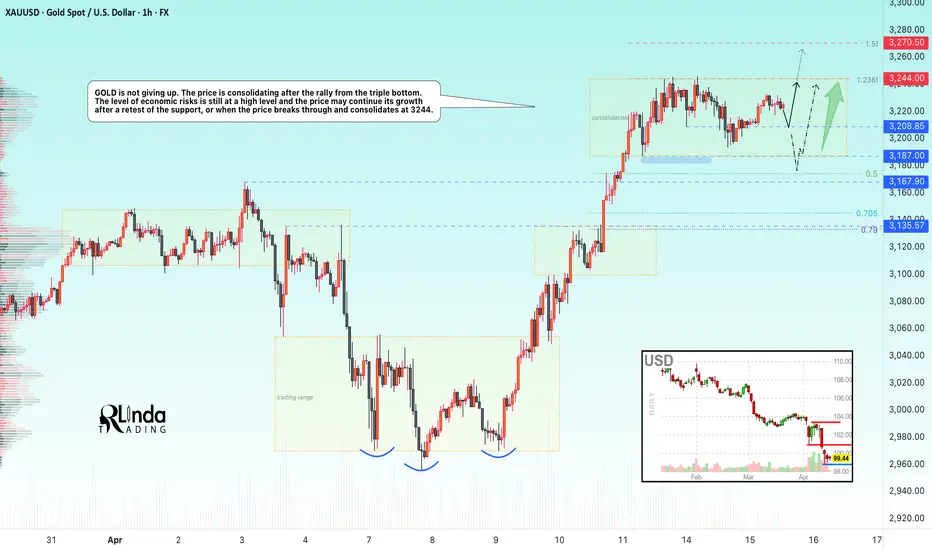
GOLD → Consolidation before the news. What to expect?FX:XAUUSD is not going to turn around. The level of economic risks is still at a high level and the price may continue to rise, but after the end of consolidation.
Gold is back to a record $3,246 despite calm markets. Lower US bond yields and a pause in capital withdrawals are supporting demand for protective assets.
Uncertainty around Trump's tariff policy and expectations of a Fed rate cut are driving prices higher. Additional support is provided by inflows into Chinese ETFs and expectations of Chinese GDP data. Further gold movement depends on headlines on tariffs and Fed rhetoric.
Technically, the focus is on consolidation 3244 - 3187 and internal support level 3208.
Resistance levels: 3244, 3270
Support levels: 3208, 3187
The market is likely to be in consolidation until tomorrow, when important economic reports will be published. But nevertheless, there could be strong movements intraday due to various factors. I expect to see a retest of support at 3208 or 3187 before further upside. But, consolidation near 3244, breakout and consolidation above the level may give a chance for growth
Regards R. Linda!
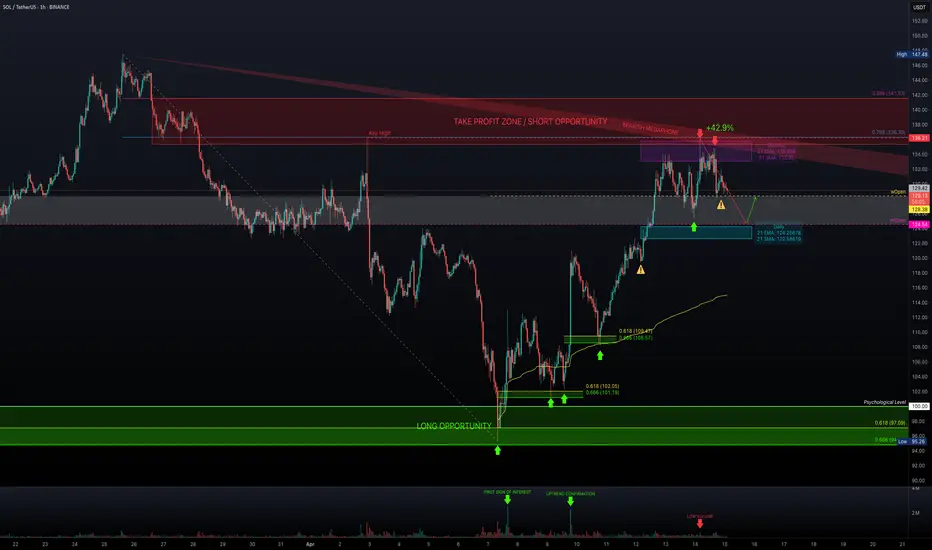
SOL Bulls Strike Back — But Is It Sustainable?Solana continues to respect technicals with precision — after a +42.9% move from the $95 low, we're now at a pivotal moment in price structure. Let’s break down what’s happening and where the high-probability setups lie.
📍 Key Bounce Zone – Golden Pocket Confluence
Local Low: $95.26
Golden Pocket Zone (0.618–0.666): $97.09–$94.82
This area acted as a major demand zone, with price sharply rebounding.
First Volume Spike: Followed by retracement into Golden Pocket Zone at $102.
Second Volume Spike: Occurred right after touching Anchored VWAP ($108.21) from the $95.26 low, which added beautiful confluence with the Golden Pocket Zone – a secondary high-conviction long entry.
📈 Rally to Resistance – Short-Term Climax
After the anchored VWAP retest, SOL rallied into the key resistance zone aligned with the 0.786 Fib retracement from the previous down move — a historically reactive level and a prime profit-taking zone.
Monthly 21 EMA ($135.83) and the monthly 21 SMA ($133) — both key dynamic resistance zones.
Low-volume retest of that key high suggests buyer exhaustion, not continuation — a classic setup for a short-term reversal.
🧭 Current Market Structure
Current Price Action: Trading above both the weekly open ($128.38) and the monthly open ($124.54).
This forms a critical S/R zone between $124–$128, now acting as a potential battleground for bulls and bears.
As long as price stays above this zone, momentum remains with the bulls.
🔍 What to Watch Next – Reclaim or Reject?
Key Support to Watch:
$125 (psychological level) and monthly open at $124.54 – This zone is likely to be liquidity-hunted. Expect a sweep of this low, look for the reaction.
Daily Support Confluence: currently at 21 EMA: $123.77 & 21 SMA: $123.27
1.) 📈 Scenario A – Bullish Reclaim:
If SOL sweeps the low and shows strong buying reaction (bullish engulfing candle, volume spike), it sets up a potential long opportunity towards the weekly open, to watch for the next reaction.
2.) 📉 Scenario B – Failed Hold:
If there's no bullish reaction at $124–$125, expect further downside.
First target = $122
Second target = $120.65
🎯 Tactical Game Plan
Bulls:
Watch for reaction at $124–$125 – potential scalp long with tight SL.
Confirmation on volume expansion and break of $128.38 for continuation.
Re-enter long after clean retest of weekly open from above.
Bears:
Short setup possible if weekly/monthly open is broken and retested as resistance.
First TP = $122, second TP = $120.65.
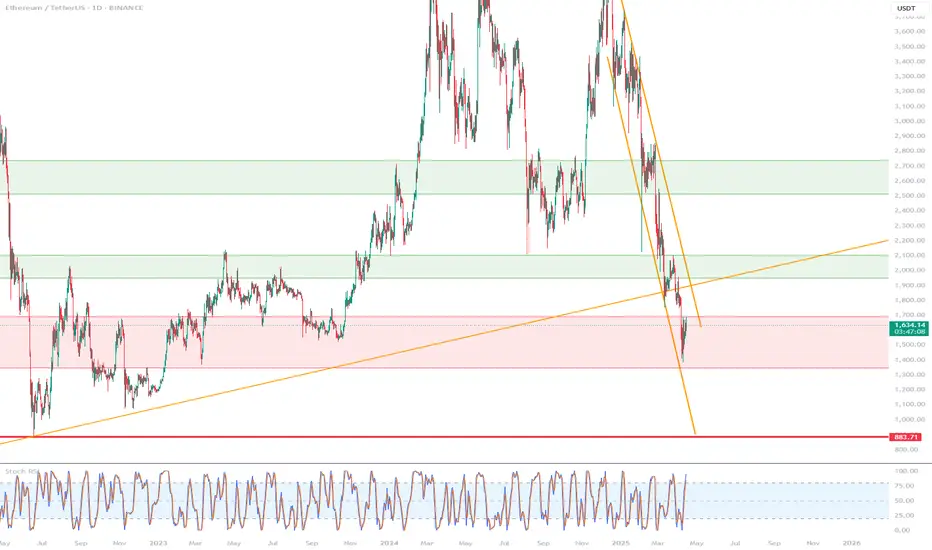
ETH is fighting in the support zoneHello everyone, I invite you to review the current situation on ETH. When we enter the one-day interval, we can see how the ETH price moved in a strong downtrend channel. What's more, we can see that the price fell below the main uptrend line.
As we can see, the price is currently fighting to break out on top in the support zone from $ 1690 to $ 1350, in a situation if this zone was broken, we could see another strong drop to the support area at $ 884 at the previous low after the bull run.
On the other hand, if ETH gets wind in its sails again, it must first pass through the resistance zone from $ 1952 to $ 2100, while further on there is a very strong zone from $ 2500 to $ 2740.
However, here, taking into account the one-day interval, the RSI indicator shows a breakout above the top of the border, which may affect the potential end of the current uptrend.
GOLD → Countertrend correction. What to do in this case?FX:XAUUSD , after a bull run, bumps into strong limit resistance at 3244 and enters a correction phase, which is generally a logical maneuver amid strong gains.
Gold corrects from Friday's record $3,245 and moves back to $3,200 amid improving market sentiment and progress in trade talks. The price pared gains after a strong weekly rally, reacting to U.S. concessions on tariffs on Chinese electronics and China's pledges to boost economic stimulus. Additional influences come from the dialog between the US and Iran, as well as the anticipation of China's GDP and trade data for March. Despite the pullback, downside may be limited due to ongoing uncertainty.
Technically, it is worth looking at the 3187 - 3167 conglomerate of support, which can stop (temporarily or even turn the price upward) a strong and sharp decline, as the fundamental backdrop within the tariff war is still tense.
Resistance levels: 3244, 3270
Support levels: 3187, 3174, 3167
The rally is temporarily halted, but there is no talk of a trend reversal, as the tariff war fire is still burning, Trump or Xi Jinping may add to the fire....
Within the framework of counter-trend correction, the emphasis is on the support of 3187, 3174, 3167 from which we can trade a false breakdown and catch the price rebound.
Regards R. Linda!

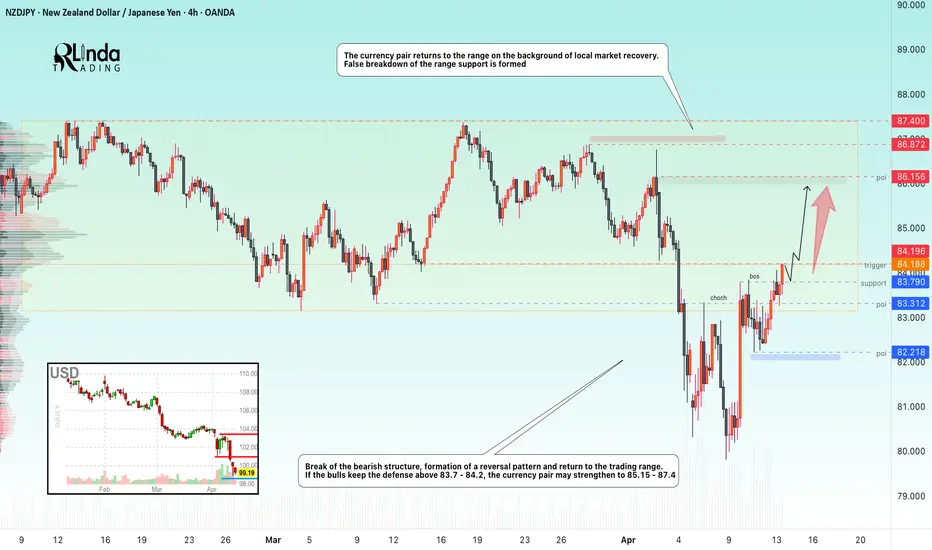
NZDJPY → Back in range, there's a chance to strengthenFX:NZDJPY is forming a false break of the range support and within the reversal pattern confirms the break of the bearish structure
The fundamental background has been extremely unstable lately and depends on any harsh statements of politicians, mainly related to the trade war.
But, technically, the pair is returning to the range on the background of local market recovery. A false breakdown of the range support is formed.
The break of the bearish structure, the formation of the reversal pattern and the return to the trading range give chances for strengthening of the price. If the bulls hold the defense above 83.7 - 84.2, the currency pair may strengthen to 85.15 - 87.4
Resistance levels: 84.196, 86.15
Support levels: 83.79, 83.31, 82.21
Consolidation above the key support zone may allow the bulls to strengthen the price to the local zone of interest. Global trend is neutral, local trend is upward.
Regards R. Linda!
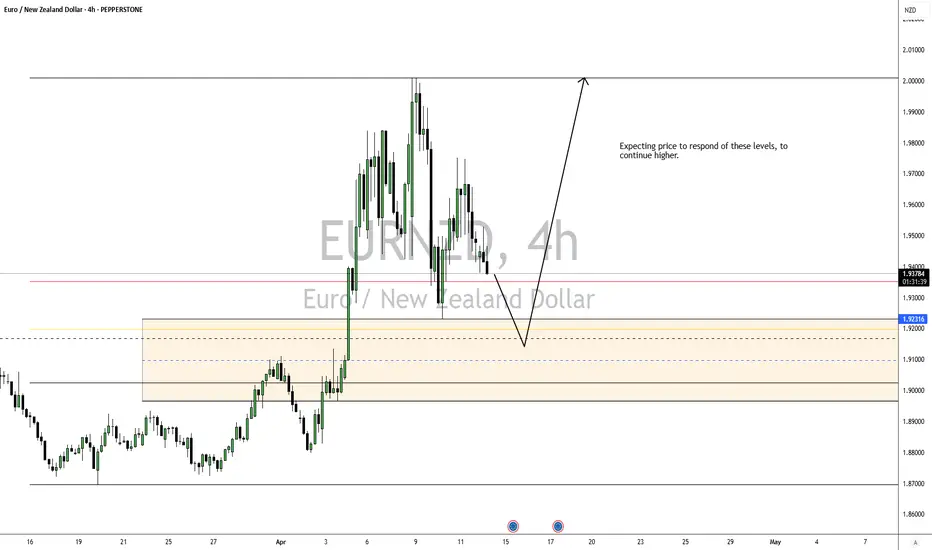
EUR/NZDExpecting price to react off the levels that I marked, to continue higher, these levels I marked are aligned with my Fib levels.
$HNT Massive Weekly Close up 60%
Grabbed all downside liquidity.
Helium Up 60% on the week.
W bottom reversal pattern formed.
Broke out of a 16-week downtrend, but got rejected at .236 Fib
Closed above the EMA9, which is now support.

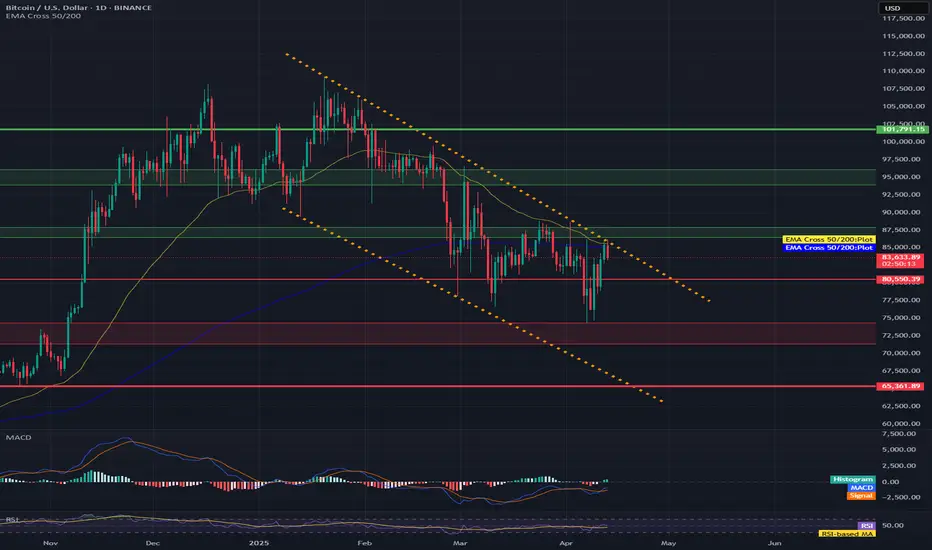
Will BTC emerge from the descending channel on top?Hello everyone, I invite you to review the current situation on BTC. On the one-day interval, you can see how the price is moving in the downtrend channel in which there is again a fight with the upper boundary of the channel. At this stage, you can also see how the EMA Cross 50/200, they have come very close but still indicate the maintenance of a long-term upward trend.
Here you can see how the price has currently bounced off the resistance zone from $ 86,503 to $ 87,934. Only an upper exit from this zone will open the way towards the second important zone at the levels of $ 93,959 to $ 96,142, and then we have visible strong resistance around $ 101,800.
Looking the other way, you can see that in the event of further declines, we have support at $ 80,550, then you can see an important zone that previously maintained the price decline from $ 74,340 to $ 71,380, in a situation where this zone is broken, we can see a quick decline to around $ 65,360.
The MACD indicator shows an attempt to switch to an upward trend, it is worth watching whether there is enough energy for further movement.