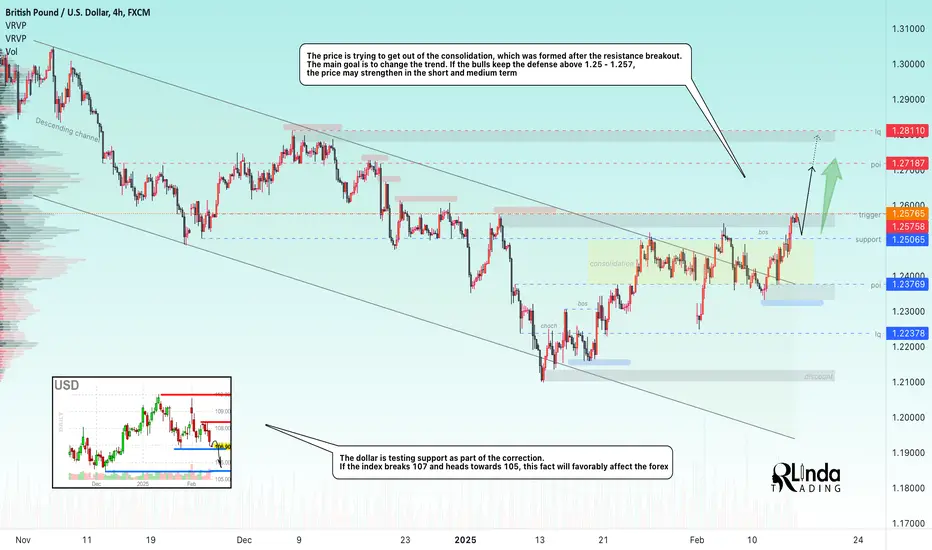
GBPUSD → Attempting a trend change. 1.257 - triggerFX:GBPUSD is trying to take a chance for a trend change amid the dollar correction. The price is testing consolidation resistance for a breakout
On the daily timeframe, the price is consolidating above the previously broken trendline and the attempt to break the resistance is generally indicative of the market sentiment. A dollar correction could favor the pound if the index breaks 107 and heads towards 106-105.
Technically, the focus is on 1.257, a key resistance trigger. A break and price consolidation above this zone could trigger a rally.
Resistance levels: 1.2575, 1. 2718
Support levels: 1.250, 1.2377
I do not exclude the possibility of a retest of 1.250 support in order to accumulate liquidity before further growth. The dollar is likely to continue its correction after Trump's and Powell's comments on rate cuts
Regards R. Linda!
Fibonacci Retracement
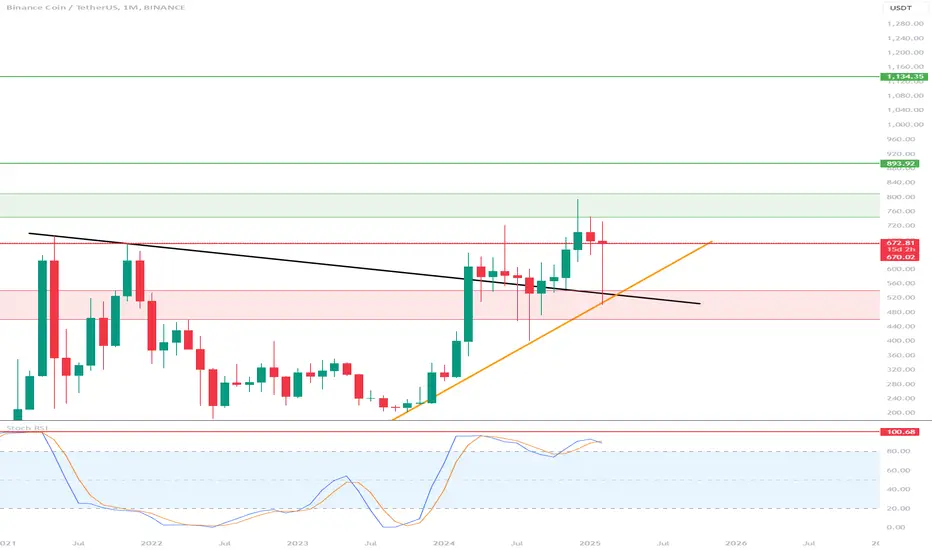
BNB - will there be enough time for further growth in this cycleHello everyone, I invite you to review the current situation on BNB. When we enter the one-month interval, we can see how the price, after a long period of bearishness, turned into an upward trend in which it came out on top of the long-term downward trend line. Currently, we can see the movement along the upward trend line, which is also a support line for declines.
Here we can see how the price is currently based on support at $ 670, however, if this support is broken, we can then see the price quickly descending again to the area of a strong support zone from $ 540 to $ 460.
Looking the other way, we can see that when the trend reverses, we first have a resistance zone from $ 744 to $ 810, only when we come out on top of this zone can we see further movement towards $ 893, which may open the way towards another strong resistance in the area of $ 1134.
The RSI indicator shows that we are staying above the upper limit, which could potentially indicate an approaching larger rebound, but before that we may still see an attempt at growth so that the indicator reaches its previous highs.
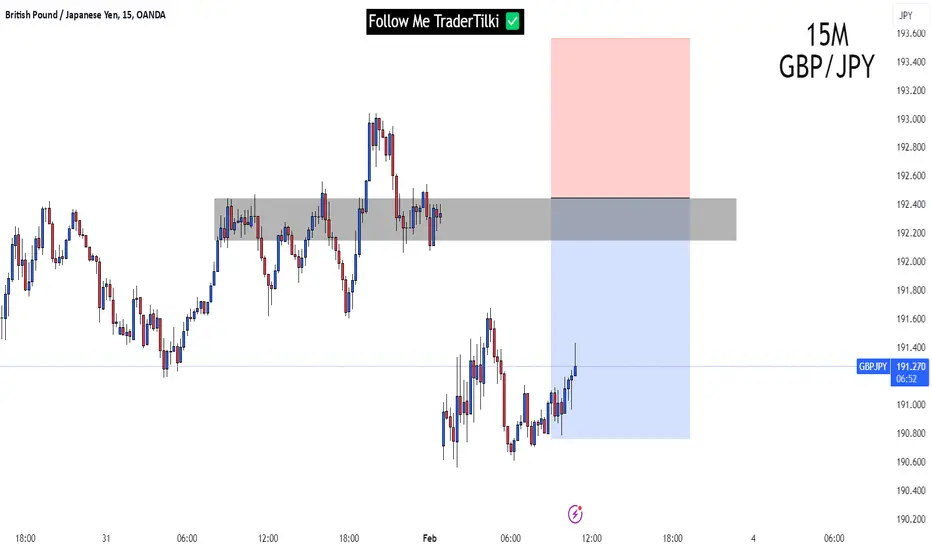
GBPJPY | 15M | SELL LIMIT ORDER Don't forget to press like if you want to receive updates of this analysis. 🚀
SIGNAL ALERT
SELL LIMIT ORDER - GBPJPY ( OANDA:GBPJPY ) | 193,450 OR 192,146
🟢TP1: 192,000
🟢TP2: 191,840
🟢TP3: 190,753
🔴SL: 193,559
RISK REWARD - 1,51
Thanks to everyone who supports my analysis with likes.🫡
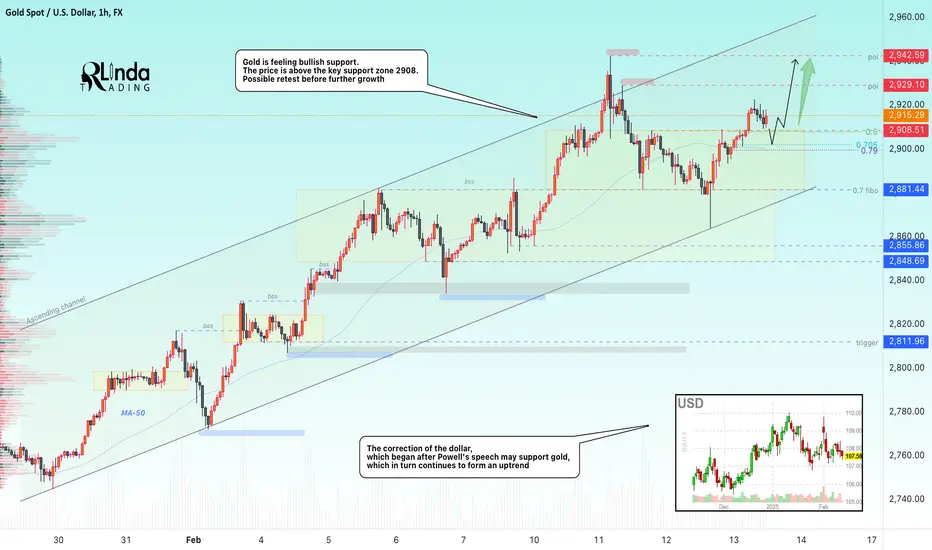
GOLD → The northbound train is ready to move onFX:XAUUSD is back in trend after a news (inflation) shakeout. The northbound train can continue its journey from station 2908. Initial Jobless Claims and PPI ahead
Prices are supported by uncertainty around Trump's tariffs and US economic data. The Fed remains hawkish due to rising inflation, which raised bond yields and briefly drove the gold price down to $2,865. However, buyers quickly returned, driving the price back up again. The market is waiting for PPI data that could influence Fed policy, but the decline in gold prices is likely to be limited due to trade risks
The price is consolidating in the buying zone relative to the important 2900 - 2908 point. If bulls hold their defenses above 2908, gold could update ATH in the medium term
Resistance levels: 2920, 2929, 2942
Support levels: 2908, 2902
Emphasis on key levels. Gold may test 2908 support before rising further. Also the emphasis is on 2918 - 2920. A price consolidation above this zone will also support the price
Regards R. Linda!
Is BTC approaching its upcoming price increases?Hello everyone, let's look at the 1D BTC to USDT chart, in this situation we can see how the price is moving in the local uptrend channel, as you can see we are holding at the lower border of the channel which may indicate that we are close to the return of the price growth.
What's more, on the RSI indicator we can see how we are moving below the lower border which may also indicate the upcoming growth.
Let's start by defining the targets for the near future that the price has to face:
T1 = 98944 USD
T2 = 101432 USD
Т3 = 103769 USD
Т4 = 107237 USD
Now let's move on to the stop-loss in case the market continues to fall:
SL1 = 94233 USD
SL2 = 90048 USD
SL3 = 84997 USD

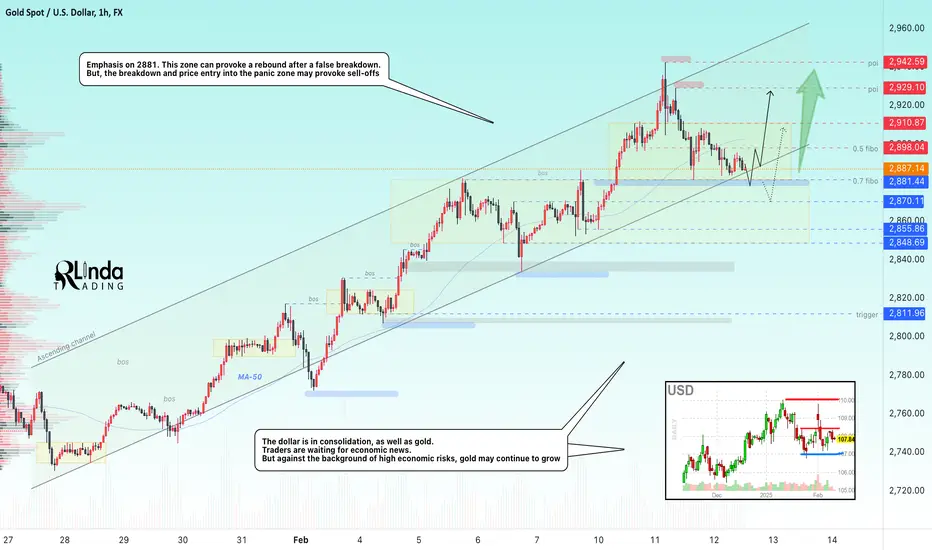
GOLD → News ahead. Price is testing the risk zone 2881FX:XAUUSD within the correction is testing the key risk zone from which either a continuation of the trend or a deeper correction will take place.
In the center of attention is the US CPI data, which may give a new impetus to prices.
Markets remain in uncertainty over Trump's possible tariffs and Fed policy. According to WSJ, the president's administration is preparing new tariffs and this is another dose of risks for the global economy.
Powell said that the Fed is in no hurry to change course, which raised expectations of a single rate cut in July and strengthened bond yields. Gold's further movement depends on inflation data and Trump's tariffs. If CPI exceeds forecasts, the dollar will strengthen and gold will fall in price. Weak data, on the contrary, may support the metal's growth.
Resistance levels: 2898, 2910, 2929
Support levels: 2881, 2870, 2855
A false break of the support at 2881 would mean that the market is still bullish and quite aggressive. If the bulls keep the price above 2881 - 2885, then in the short and medium term we should expect a rise to 2930 - 2950.
If gold breaks 2881 and sticks below this zone, then liquidation may take place in the market and the price may decline to 2855, 2848.
The situation is stalemate, as there is news ahead and that is why we should consider 2 scenarios.
Regards R. Linda!
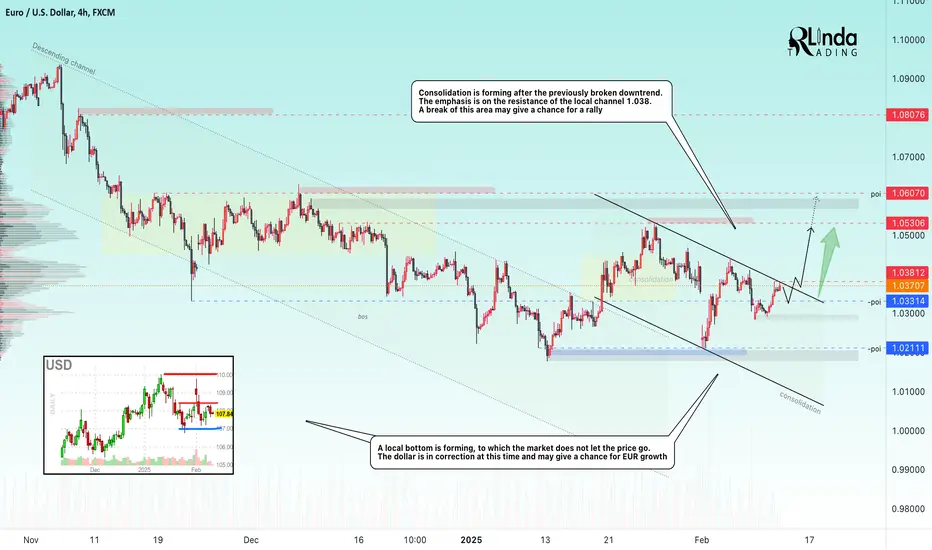
EURUSD → Pending a breakout of resistanceFX:EURUSD is trying to take a chance amid the dollar correction. The price is forming a retest of consolidation resistance for a breakout and further growth
After an attempt to break the downtrend resistance, the price moves into consolidation and forms a range of 1.053 - 1.021. Inside this set-up a local channel (consolidation) is formed and the price tests the resistance at 1.038. The market is still trying to confirm the change of trend and get stronger on the background of the dollar correction.
The fundamental background is complicated due to the tariff war and economic crisis....
Resistance levels: 1.038, 1.053
Support levels: 1.033, 1.021
A breakthrough of the resistance at 1.038 and price consolidation above this area may trigger further growth within the distribution of the accumulated potential
Regards R. Linda!
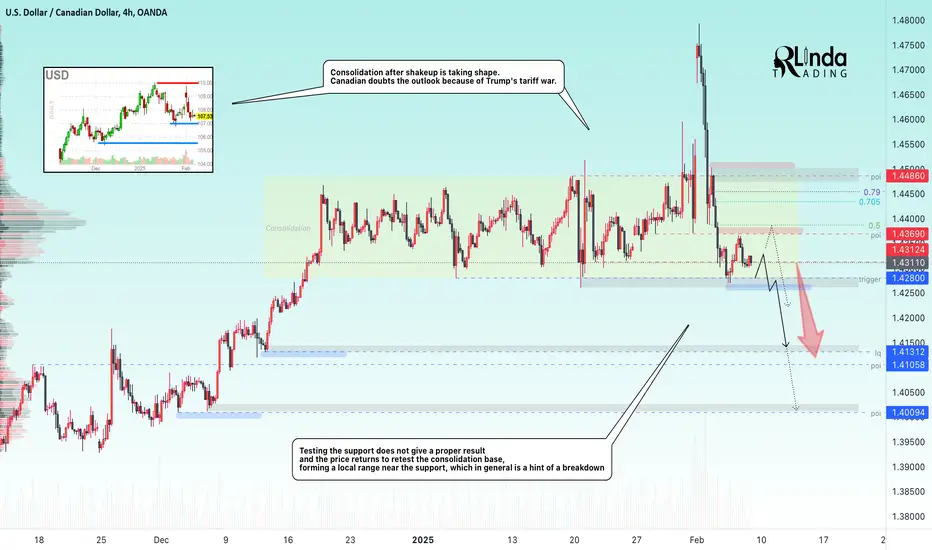
USDCAD → Consolidation before downward distributionFX:USDCAD is stuck in a range (consolidation) between 1.4486 and 1.428. The dollar has been showing negative momentum lately, but with NFP ahead, the data could both reinforce the correction and support the index...
All eyes are on today's economic news. If the actual NFP is below the forecast (169K), it will strengthen the expectations of the Fed rate cut.
At 15:00 the Fed's monetary policy report will be released, which may clarify the further course of the regulator.
If the NFP comes out weak, the dollar may sag and USDCAD may decline.
If the data is stronger than expected, the USD will strengthen, which will lift the USDCAD.
If the Fed hints at a rate cut, it may weaken the USD, supporting the CAD
Resistance levels: 1.4345, 1.4369
Support levels: 1.428
News is uncertainty, as it is impossible to determine the outcome of this situation in advance.
Technically, the currency pair looks weak due to the falling dollar. A break of the support at 1.428 may trigger further decline.
Regards R. Linda!
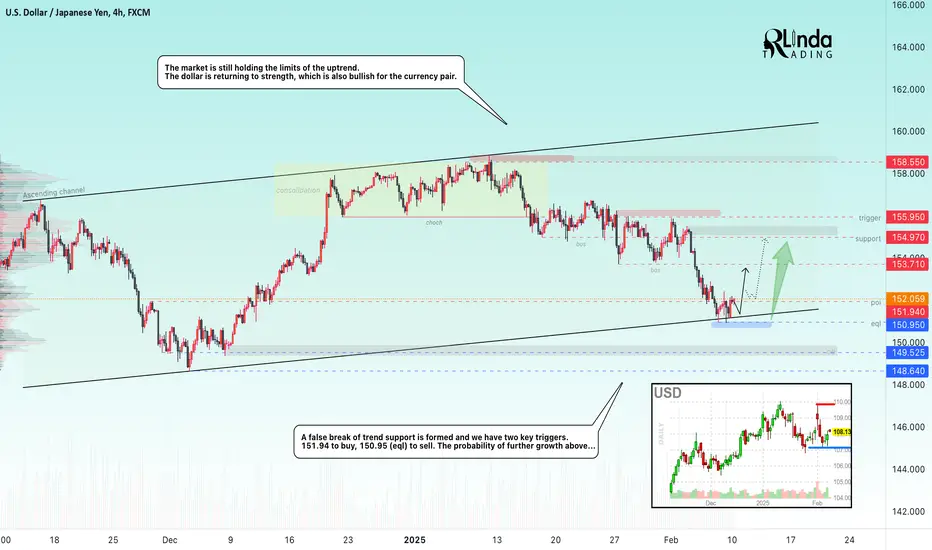
USDJPY → False break of support gives bulls a chanceFX:USDJPY bumps into support and forms a false breakdown of the lower boundary of the local trend. The dollar is strengthening at this time, which may give a chance for growth of the currency pair.
The price stops in the zone of strong support, the fundamental background has been unstable lately and depends more on the USA. Everyone has long forgotten about the growth of interest rates in Japan and follows the economic data from the West.
Technically, there are two triggers on the chart, one to buy and one to sell, but since the global and local trend is upward, the preference is to buy. If the currency pair is able to consolidate above 151.9 - 151.95, then in the short and medium term we should expect growth to the targets indicated on the chart.
Resistance levels: 151.94, 153.7, 153.97
Support levels: 150.95, 149.52
But, if the dollar continues the correction and the bulls fail to realize the false support breakdown, the price return to 150.95 may provoke the support breakout and fall to 148.64.
Regards R. Linda!
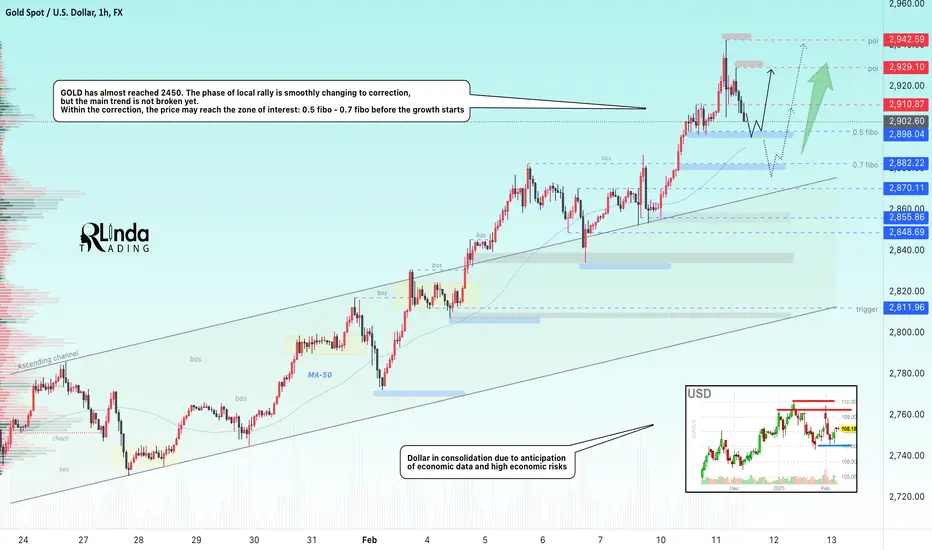
GOLD → Is $3000 still relevant? News aheadFX:XAUUSD has almost touched 2450 and without reaching the psychological target is smoothly flowing into correction with the purpose of respite and filling liquidity before the news and possible growth.
Gold is testing 2450 after Trump's new tariffs, keeping demand high. Investors are waiting for Powell's speech and U.S. inflation data, which may influence rate cut expectations and further dynamics of gold. Gold remains volatile on one side and bullish on the other side due to trade risks and Fed policy.
Technically, a correction is a logical scenario on the back of a strong market. The price cannot rise all the time, it needs energy, which is accumulated at the expense of sellers.
At the moment the emphasis is on such zones as: 2910, 0.5 fibo and 0.7 fibo.
Resistance levels: 2910, 2929
Support levels: 2898, 2882, 2870
Powell speaks tonight and tomorrow is the inflation data. High volatility is possible, but the general economic situation supports the metal.
Before further growth the price may test 2898, 2882. The target in the form of 2950 - 3000 remains relevant.
Regards R. Linda!
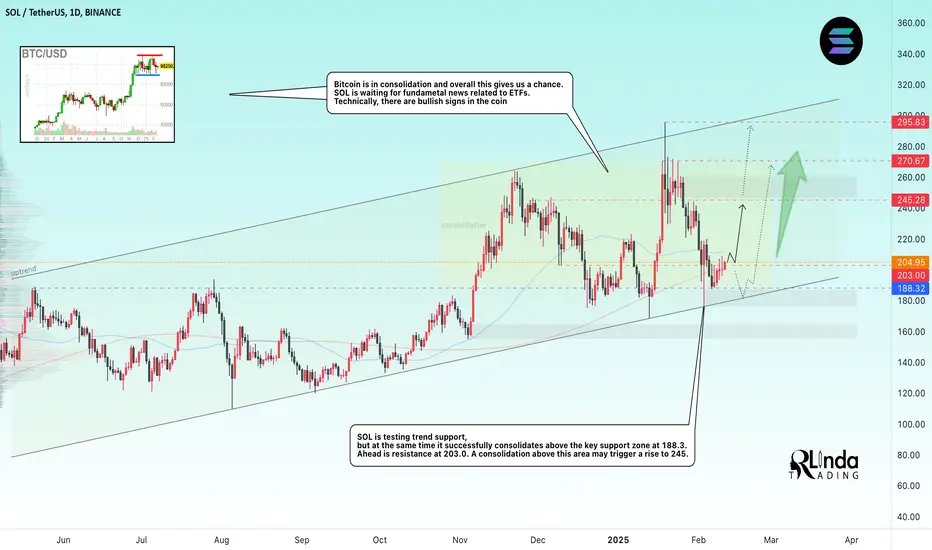
SOL → The coin may get a chance for growthBINANCE:SOLUSDT is testing trend support and at the same time bulls are trying to hold their defenses above the intermediate bottom and enter the buy zone.
SOL both fundamentally and technically has good potential. Bitcoin is consolidating at this time and it can give strong coins a chance.
Technically, solana tested the trend support with a touch and is trying to consolidate. I don't exclude the possibility of a false breakdown of the trend support before further growth, but at the moment the focus is on the resistance 200 - 203. If the bulls hold the defense above this area, the coin could strengthen to 245 - 270 - 290 in the medium term.
Resistance levels: 203, 200
Support levels: 188, trend
Emphasis on the local boundaries of the range. The market is struggling for the zone 200-205, bitcoin at this time is forming a local bullish momentum, which can also become a driver for the cryptocurrency market.
Regards R. Linda!
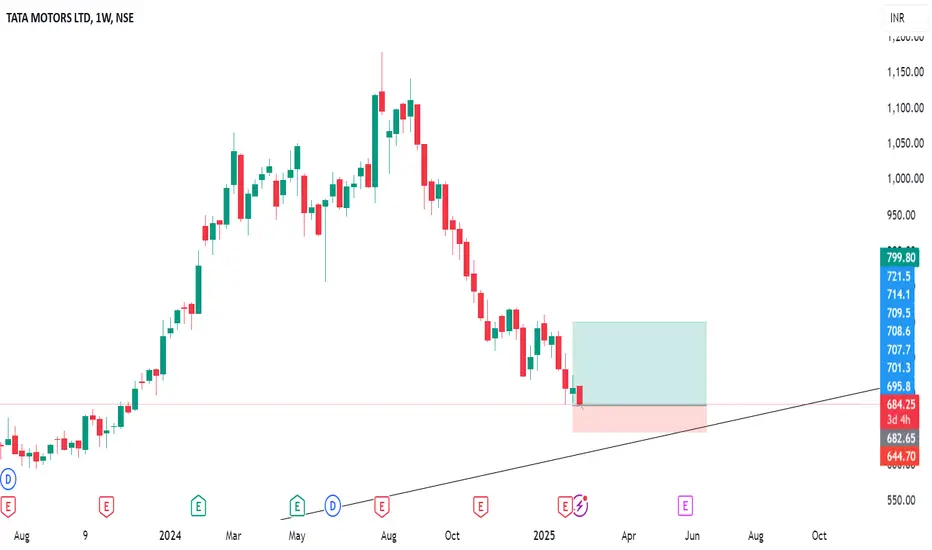
Tata motor at golden Fib ratio Tata motor at golden Fib ratio
Disclaimer :-
This is only for the knowledge purpose don't take it as a buy or sell recommendation do your own analysis before dealing in securities
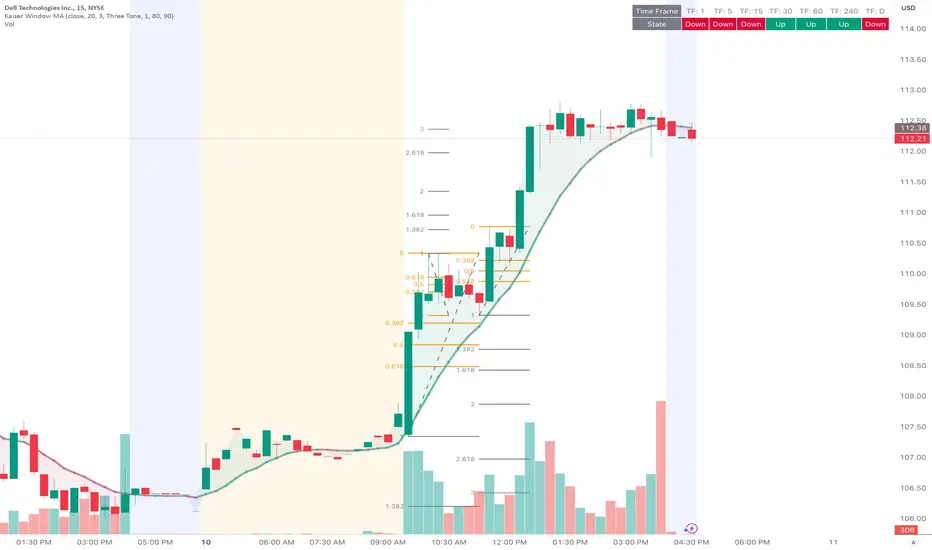
Todays Best Performer - DellNYSE:DELL
Scanning through the market today I found some good looking price action in the tech sector. Dell Computers along SMCI ,TSLA, and PLTR where also some big movers today. I look for what price action is the most clean for entry and exit points. Yes, other stocks may have returned more than Dell Computers today. However according to this chart, some great opportunities presented themselves.
NVDA, AMD, and others began to stall out coming into lunch. Out of my surprise DELL had some decent areas of high volume leading into the lunch hour. On the initial pullback after 10AM price setup beautifully at the 0.382 Fibonacci level. At Approximately 11:30 Dell gave you a confirmed breakout move back above the KMA and RSI.
Price Quickly closed above the 0.618 measurement of the most recent pull back indicating strong momentum to upside.
Price Topped out at the 3.00 Fib level from the initial morning pullback, closing the day just near by. A beautiful opportunity to add to a winning position also occurred after a secondary pullback, holding the moving average. Its all in the Fibs. Let the market show you what it wants to do!
Key Points
Use the Fibonacci levels on the Retrace
Scan Heat-maps for Volatility changes
Price will show you good opportunities to trade
Only trade whats best and fits your strategy
Paper trade your ideas, practice finding setups, than perfect them!
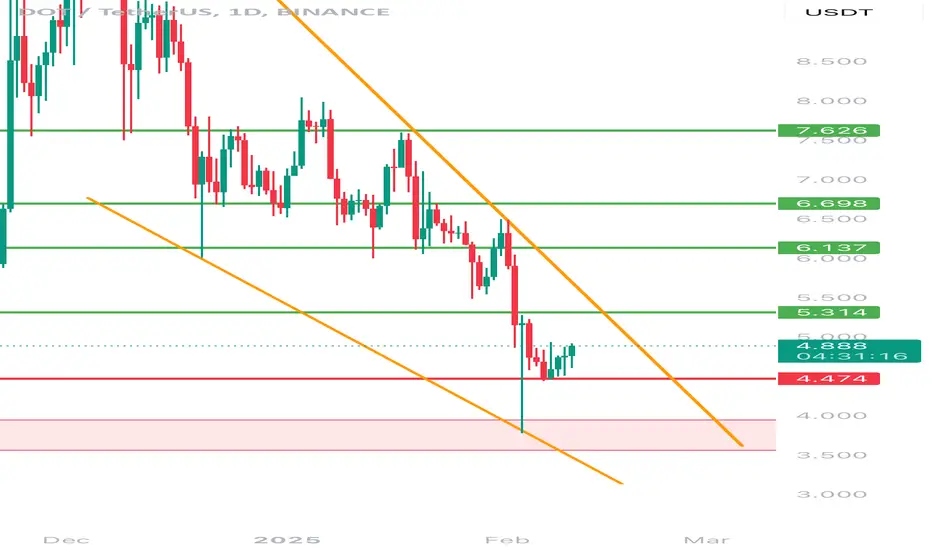
Will Dot break the barrier of the inheritance channel?Hello everyone, let's look at the 1D Dot chart to USDT, in this situation we can see how the price moves in a local strong tendu inheritance channel.
However, let's start by defining goals for the near future the price must face:
T1 = = $ 5.31
T2 = = $ 6.14
Т3 = 6.70 $.
T4 = $ 7.63
Let's go to Stop-Loss now in case of further declines on the market:
SL1 = $ 4.47
However, we still have a very strong support zone that has repeatedly maintained the price from a further correction zone from $ 3.95 to $ 3.56.
UNI is at a bottom!BINANCE:UNIUSDT
UNI is at a bottom right now! if we use Fibonacci retracement on the chart, we can understand that the price is at a great support. and we shall wait for it to ascend to the 61.80 line.
once a support,now becomes a resistance. the 61.80 was a support a few days back but now It's a Resistance.if the price breaks the line,It can become a support once again!
⚠️ Disclaimer:
This is not financial advice. Always manage your risks and trade responsibly.
👉 Follow me for daily updates,
💬 Comment and like to share your thoughts,
📌 And check the link in my bio for even more resources!
Let’s navigate the markets together—join the journey today! 💹✨

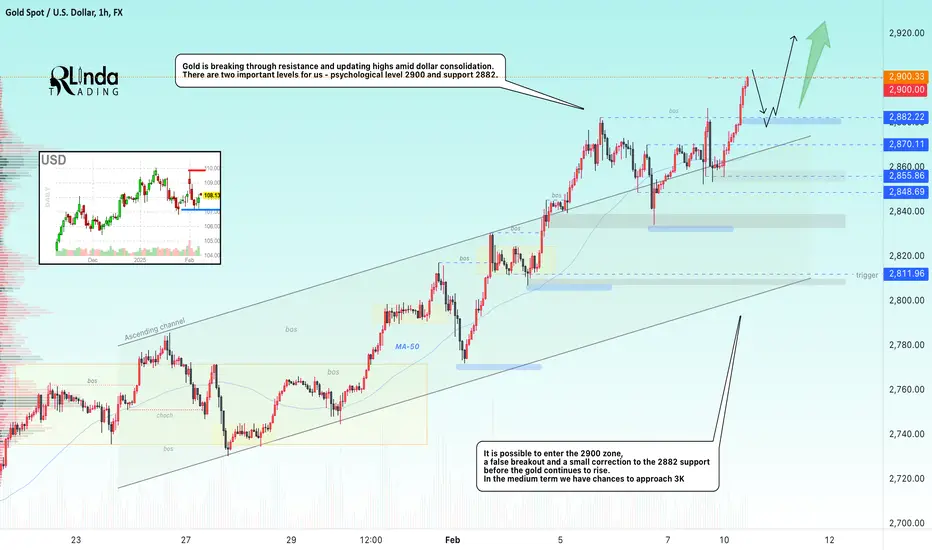
GOLD → The northbound train continues to make its way to 3KFX:XAUUSD continues its aggressive rally. The reasons for growth are the same as before - high economic risks. The price is getting closer and closer to the cherished goal of $3000.
Gold exceeded $2,850 at the beginning of the week in the U.S., but its growth is limited by the strengthening of the dollar due to increased trade risks.Trump announced new 25% tariffs on imports of steel and aluminum.
Gold is further supported by rising PBOC reserves and expectations of stimulus from China. However, the dollar may continue to strengthen ahead of US inflation data, limiting gold gains. Expectations of a dovish Fed and trade risks will help contain gold's decline.
Technically, the next two levels are important for us: the psychological level of 2900 and the key support of 2882.
Resistance levels: 2900 (not confirmed)
Support levels: 2882, 2870, 2855
The bulls can consolidate above 2900 without a pullback and continue the rally, but the most likely scenario is a false break of 2900, correction to 2882 to accumulate liquidity before continuing the rally northward
Regards R. Linda!
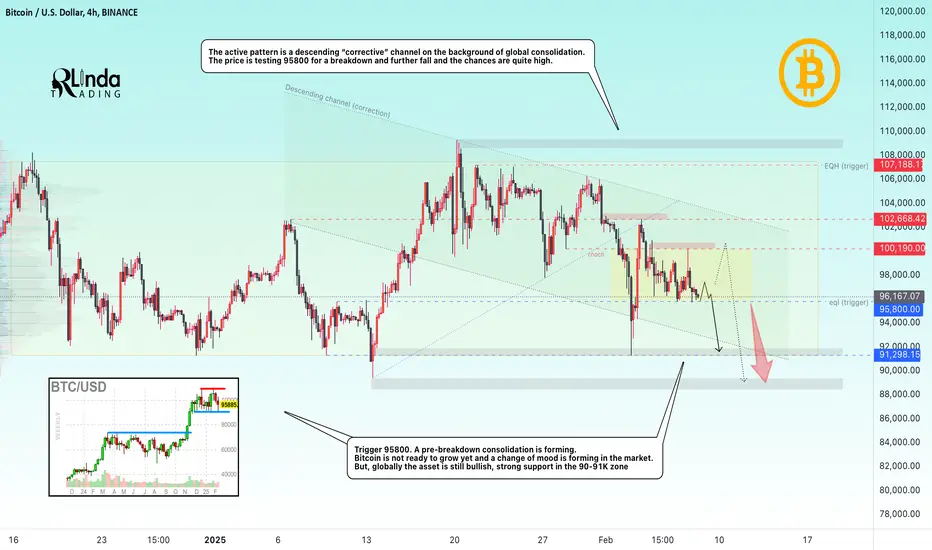
BITCOIN → Down to $90,000. Downside risks are risingBINANCE:BTCUSD feels the change of mood and continues to form set-ups hinting at a possible continuation of the correction. Another retest of the 90K risk zone is possible.
On the medium-term timeframe bitcoin failed to hold near ATH, in the upper consolidation range and entered the local selling zone, under the level of 99800. A negative note is felt in the cryptocurrency market, as well as a change in sentiment. Altcoins continue to break through bottom after bottom without any positive prospects. Bitcoin at this time is most likely resentful of the US governing apparatus due to the fact that no promises from Trump have been kept so far, and the price is moving into a protracted correction in the local perspective
Briefly, here's what's going on:
Expectations: Bitcoin reserve, cryptocurrency market support, transparent regulation, pumping the market ...
Reality: new scam coins created before the US election that sucked all liquidity, market manipulation, trade war with almost every country on the planet, dumping the market into the abyss.
Support levels: 95.8 (trigger), 91300, 90K
Resistance levels: 100.2, 102.67
Technically, the situation is that bitcoin may continue its decline and test 90K again, from which the risks around 90K will grow.
At the moment, the price is in consolidation between 95.8 - 100.2. A pre-breakdown consolidation is forming near the support, foreshadowing the support breakdown and further fall to 90K. But, due to the dependence of the asset before the actions of politicians in the U.S., the price may shake out to 100.2 before further falling
Regards R. Linda!
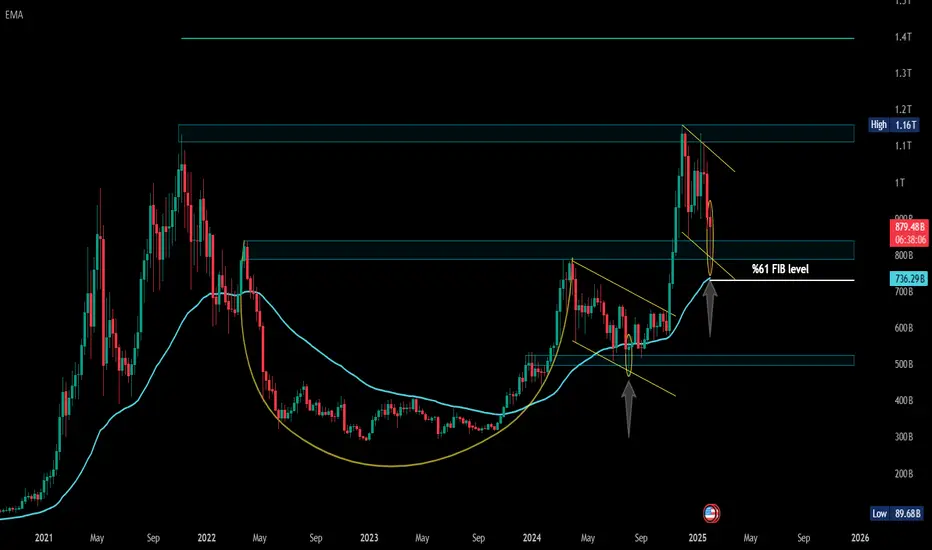
TOTAL3 is repeating the same exact pattern of cup and handleTOTAL3 is exactly repeating the same exact pattern of cup and handle also align with the 50 EMA and 61% Fibonacci level
we may see reversal of this strong levels
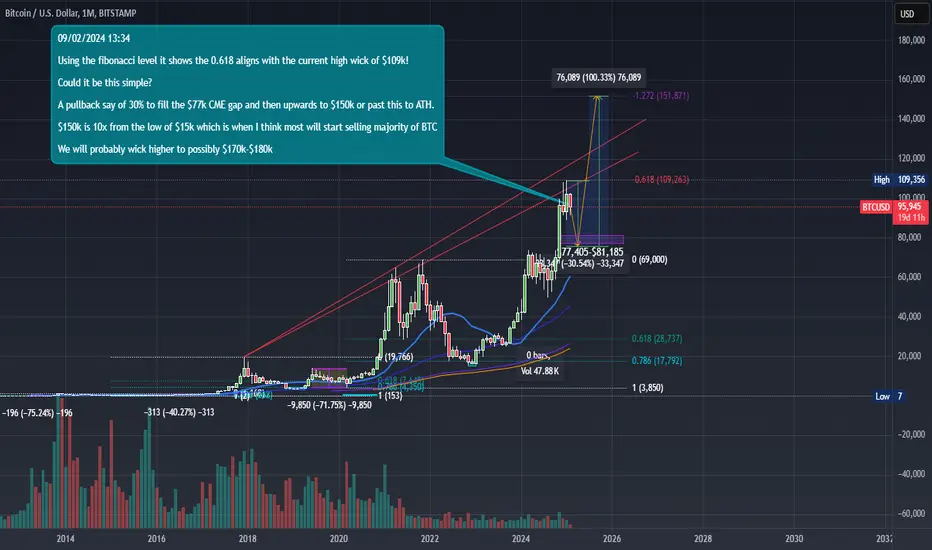
Bitcoin's BTC Next Moves?My prediction for BTCs next moves in the coming year.
We have touched the 618 fib which looks like resistance and I believe there will be approx a 30% pullback to fill the current $77k-$81k CME gap.
Once this happens we are likely to see alt szn.
We will then see a upwards movement to approx $150k which is 10x from the $15k low. BTC will most likely move up higher and will form a large wick possibly up to $17k-$180k
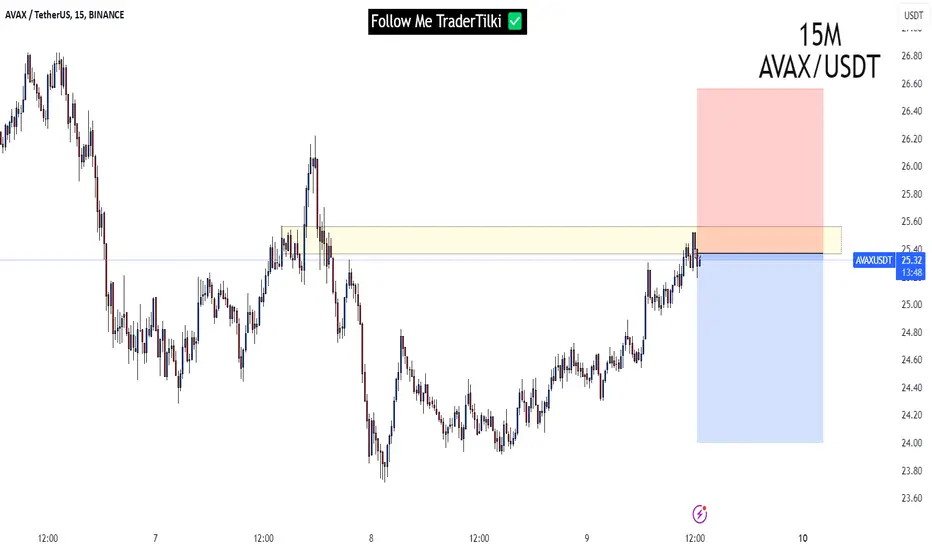
AVAXUSDT | 15M | SCALPING TIME Hey There;
Thanks to everyone who supports my analysis with likes.🫡
SIGNAL ALERT
SELL AVAX > > 25,32 OR 25,50
🟢TP1: 25,00
🟢TP2: 24,80
🟢TP3: 24,00
🔴SL: 26,56
RISK REWARD - 1.15 RR
🔻Don't forget to press the like button not to miss the updates of this analysis.
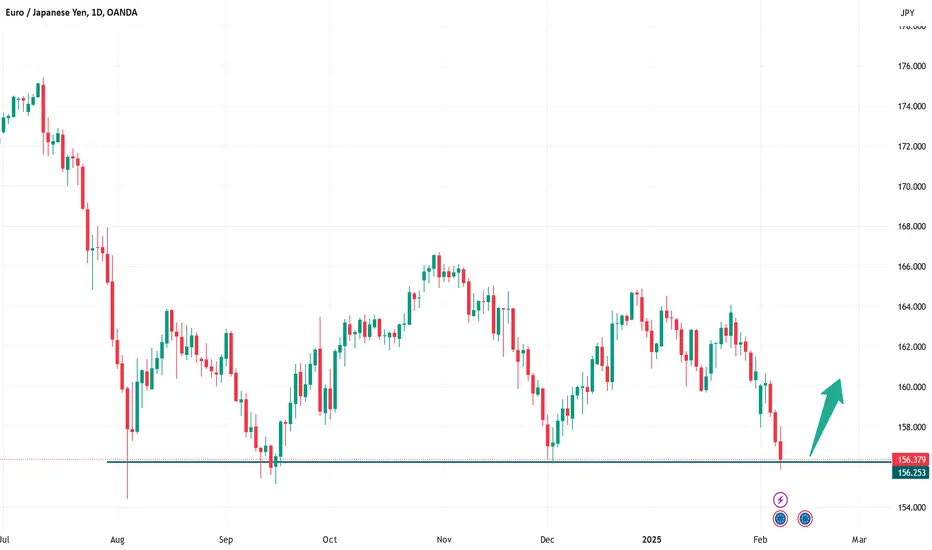
EURJPY LongEuro Yen Analysis
The pair is on a strong support line and on a fibonacci level; its expected to bounce back and be in the triangle shape it formed.
What are your technical and fundamental analysis on this pair?
PEPE Deep dive before pumping? To what price?CRYPTOCAP:PEPE Script: A potential deep dive might be on the horizon before the next pump.
Right now, it’s forming a structure that looks a lot like the pattern we saw from March to May, which I’ve marked as points 1 to 7.
Both of these structures showed up after breaking out from the near-end of a symmetrical triangle.
Currently, we’re sitting at point 6.
Using Fibonacci retracement, we can estimate how deep the dip might go.
Last time, it reached Fib 1.618. If history repeats itself, PEPE could pull back to around 0.00009485.
This potential drawback would also break the uptrend line, which could shake market confidence and flush out weaker hands—perfect for accumulating liquidity to fuel a future price surge.
I’ve already set a buy order at this level, just in case this scenario plays out.
Of course, this is just one potential script among many. I’ll share more as they unfold.
Follow me for more insights and updates! 😊

Markup phase begun ?It seems like a massive accumulation phase has been completed in paypal and potentially a markup phase has begun. If an impulsive move has begun, then its a good trade to go long on a correction.
