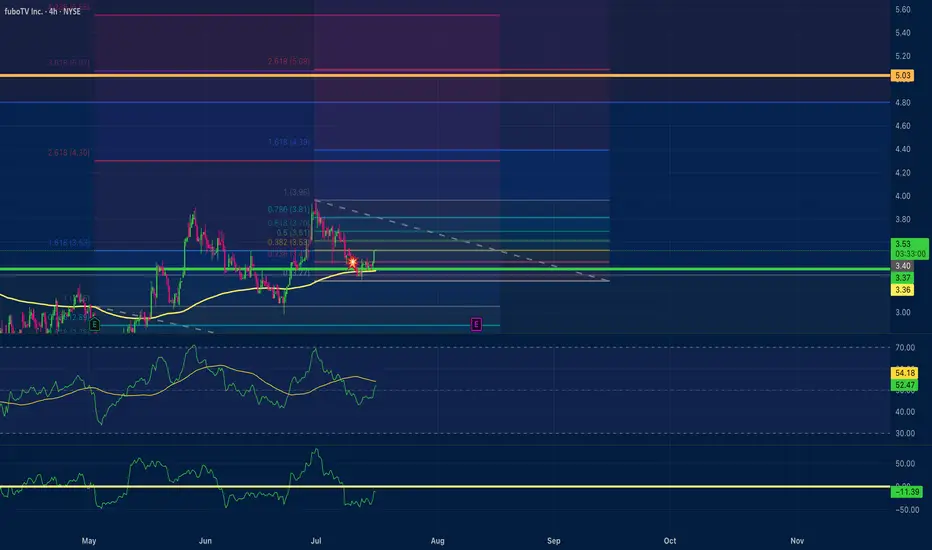
fuboTV $5.00 price target Positive Divergence Multi time frameMy trade on fuboTV has a $5.00 price target. With positive divergence multiple time frames 15,1hr, 4hr. An RSI scoop where the hrly RSI with a length setting of 36 shows upward momentum? The Chande momentum oscillator with a setting of 24 indicates the price may not stall at $4.50.
Fibonacci Retracement
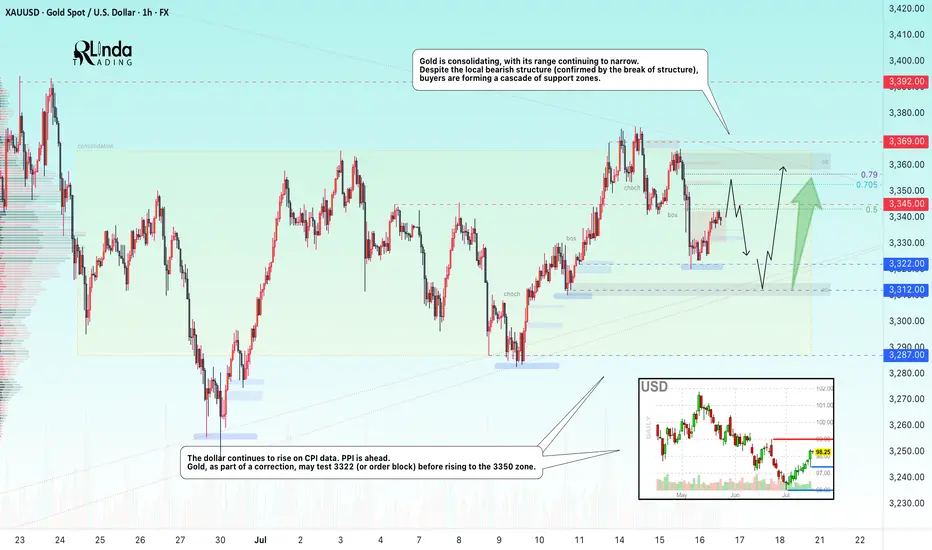
GOLD → Borders are shrinking. Consolidation continues...FX:XAUUSD is adjusting amid controversial CPI data and confirming the local bearish market structure. The PPI is ahead, and gold is consolidating, with its boundaries continuing to narrow...
Gold is recovering slightly but remains under pressure amid rising bond yields and a stronger US dollar. Higher inflation in the US reduces the chances of a quick Fed rate cut. Traders are cautious ahead of the PPI data release. If producer inflation exceeds forecasts, the dollar may rise again, putting further pressure on gold
Technically, we see consolidation in a symmetrical triangle pattern. Trading within the consolidation has a negative side - low volatility and unpredictable movements. The purpose of such movements is accumulation. However, decisions can be made based on relatively strong levels. In the current situation, we are seeing a rebound from 0.5 Fibonacci (I do not rule out a retest of the 0.7 zone before correction). The price may head towards the liquidity zone of 3322 before rising to the upper boundary of the consolidation and the zone of interest of 3350-3360.
Resistance levels: 3345, 3353, 3369
Support levels: 3322, 3312, 3287
The problem is that the price is in a consolidation phase. That is, technically, it is standing still and moving between local levels. You can trade relative to the indicated levels. Focus on PPI data. At the moment, gold is in the middle of a triangle and is likely to continue trading within the boundaries of a narrowing channel due to uncertainty...
Best regards, R. Linda!
Bitcoin positive diversion to $131,000Using fibonacci retracements for price targets based off of positive divergences on the 15 min time frame and hourly time frame. I am utilizing 2 ioscilating indicators: RSI length is 36 with smma at 50 and the Chande momentum oscillator with a length of 24. My conservative estimate is $131,000 for a safe trade close. $132,400 exact area for pullback to $128,500?
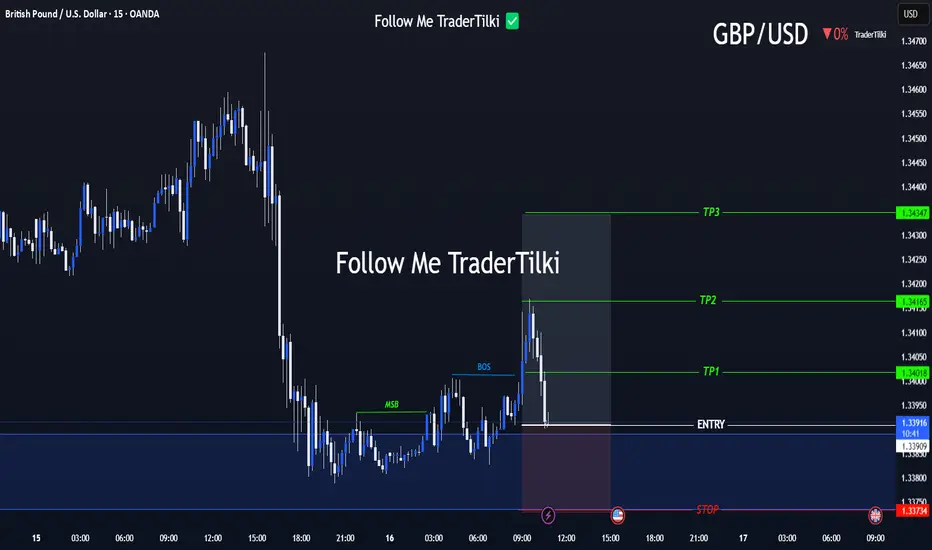
Strategic Entry, Clear Targets: The GBPUSD Game Plan Is Set📢 Hello Guys,
I've prepared a fresh GBPUSD signal for you:
🟢 Entry Level: 1.33918
🔴 Stop Loss: 1.33734
🎯 TP1: 1.34018
🎯 TP2: 1.34165
🎯 TP3: 1.34347
📈 Risk/Reward Ratio: 2,40
------
Your likes and support are what keep me motivated to share these analyses consistently.
Huge thanks to everyone who shows love and appreciation! 🙏
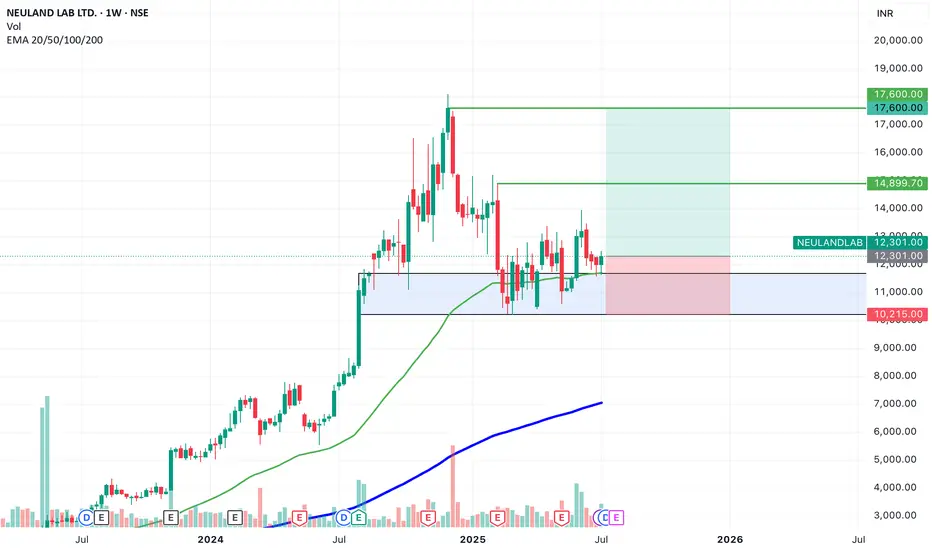
SWING IDEA - NEULAND LABNeuland Lab , a niche API manufacturer with strong export presence and leadership in complex molecules, is offering a technically strong swing trade opportunity from key support levels.
Reasons are listed below :
11,500 zone acting as a crucial support area
Formation of a hammer candle on the weekly timeframe, signaling potential reversal
Reversing from the 0.618 Fibonacci retracement zone – the golden pocket
Taking support at the 50-week EMA , holding long-term trend structure
Target - 14900 // 17600
Stoploss - weekly close below 10215
DISCLAIMER -
Decisions to buy, sell, hold or trade in securities, commodities and other investments involve risk and are best made based on the advice of qualified financial professionals. Any trading in securities or other investments involves a risk of substantial losses. The practice of "Day Trading" involves particularly high risks and can cause you to lose substantial sums of money. Before undertaking any trading program, you should consult a qualified financial professional. Please consider carefully whether such trading is suitable for you in light of your financial condition and ability to bear financial risks. Under no circumstances shall we be liable for any loss or damage you or anyone else incurs as a result of any trading or investment activity that you or anyone else engages in based on any information or material you receive through TradingView or our services.
@visionary.growth.insights
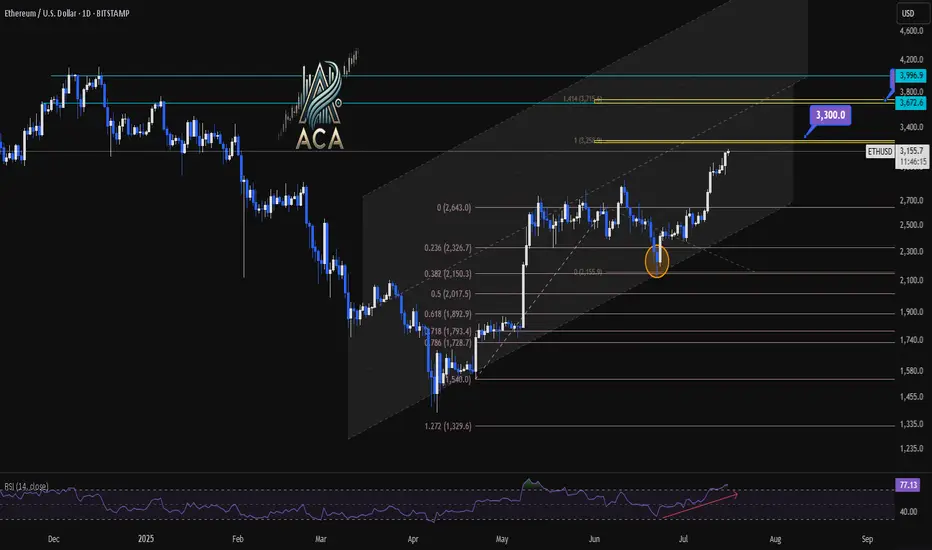
ETHUSDT 1D Chart Analysis | RSI Strength & Fibonacci TargetsETHUSDT 4H Chart Analysis | RSI Strength & Fibonacci Targets in Play
🔍 Let’s break down the latest ETH/USDT setup — bullish momentum is building with confluences pointing toward key upside targets.
⏳ 4-Hour Overview
Ether continues climbing within a well-defined ascending channel, with recent candles holding above mid-level support. Price is pressing higher from a clean bounce at the 0.5 and 0.618 Fibonacci retracement zone ($2,017–$1,899), signaling the correction has likely ended.
📉 Fibonacci Levels & RSI Confirmation
- The strong recovery aligns with rising volume and a bullish structure.
- RSI is pushing into overbought territory (above 73), often a sign of strength during trends—not exhaustion.
- ETH is now positioned for a breakout continuation move if momentum holds.
🎯 Bullish Targets Ahead
- Immediate resistance: $3,300 (1.414 Fib extension + historical supply)
- Next major target: $3,700 (1.618 extension + upper channel confluence)
- Pullback zones: $2,950 (mid-channel) and $2,017 (Fib support base)
📊 Key Highlights:
- Price is respecting the rising channel structure — higher lows, higher highs in play.
- Volume supports the breakout narrative, rising on green candles.
- RSI breakout supports trend continuation, not exhaustion.
- Targets at $3,300 and $3,700 remain actionable on a confirmed breakout.
🚨 Conclusion:
ETH is showing a multi-variable bullish setup with clear continuation potential. A strong move above $3,300 could quickly send price toward $3,700. Pullbacks to $2,950–$2,017 could offer high-risk/reward re-entry zones. Momentum favors bulls — stay alert.
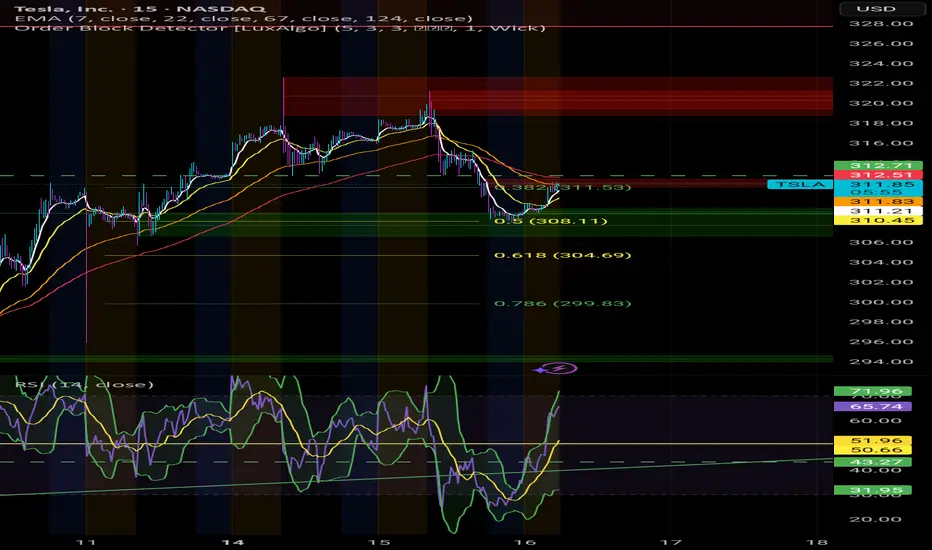
Is the BullRun over? I don't think so. $TSLAYesterday we saw a somewhat heavy fall in Indexes, and it probably scared alot of retail Bulls outs.
However, it seems we've fallen straight into potential medium term supports across multiple stocks in the markets.
I'm convinced we will get a good economic data print today.
This would open the door to new ATHs, again, in the Indexes.
For this to play out, the local bottoms established over night need to hold.
NZDCHF → Pre-breakdown consolidation on a downtrendFX:NZDCHF is forming a pre-breakout consolidation amid a downtrend. Focus on support at 0.4759. Global and local trends are down...
On July 10-11, the currency pair attempted to break out of the trend. In the chart, it looks like a resistance breakout, but technically it was a short squeeze aimed at accumulating liquidity before the fall. We can see that the price quickly returned back and the market is testing the low from which the trap formation began. The risk zone for the market is 0.4759 - 0.475. In simple terms, this is a bull trap against the backdrop of a downtrend. The NZD has passed through the risk zone. At this time, the currency pair is forming a pre-breakout consolidation relative to the support level of 0.4759 with the aim of continuing its decline.
Support levels: 0.4759, 0.4753
Resistance levels: 0.477, 0.4782
A breakout of the 0.4759 level and consolidation in the sell zone could trigger a continuation of the decline within the main and local trends.
Best regards, R. Linda!

XRP 1D Chart Review📊 Support and Resistance Levels:
🔼 Resistance:
$2.95 - $3.02 – currently being tested, a local resistance zone. Price slightly rejected.
$3.40 – another strong resistance level from the previous high (visible on the left side of the chart).
🔽 Support:
$2.75 – the closest, recently broken support level.
$2.58 – another local support level.
$2.28–$2.30 – a very strong support zone that has been tested multiple times.
📈 Pattern and Momentum:
A breakout from a wedge-shaped downtrend with very high volume and long bullish candles indicates strong demand.
We are currently observing a correction/rejection at $3.02 – a possible short-term pullback.
🔄 Oscillator – Stochastic RSI:
The Stochastic RSI oscillator is in the overbought zone (near 100) – indicating possible consolidation or correction.
The curves are starting to curve downwards – a potential signal for a slight correction in the coming days.
🧠 Scenarios:
✅ Bullish (continued growth):
If the $2.95–$3.02 level is broken strongly and confirmed (e.g., by a daily candlestick closing above it), the target will be $3.40.
In this case, a quick rally to $3.40 is possible without major obstacles.
⚠️ Bearish (correction):
If the $3.02 zone holds as resistance, the price could retrace to $2.75 (the first local support).
If downward pressure persists, $2.58 could be tested.
📌 Summary:
XRP is in a strong uptrend after breaking out of long-term resistance.
In the short term, overbought prices on the Stoch RSI could trigger a correction to $2.75.
Key resistance: $3.02 – breaking it could signal further gains towards $3.40.
It's worth monitoring price reaction in this zone and candlestick confirmation.

GBPUSD is Nearing the Daily Trend!!!Hey Traders, in tomorrow's trading session we are monitoring GBPUSD for a buying opportunity around 1.34100 zone, GBPUSD is trading in an uptrend and currently is in a correction phase in which it is approaching the trend at 1.34100 support and resistance area.
Trade safe, Joe.
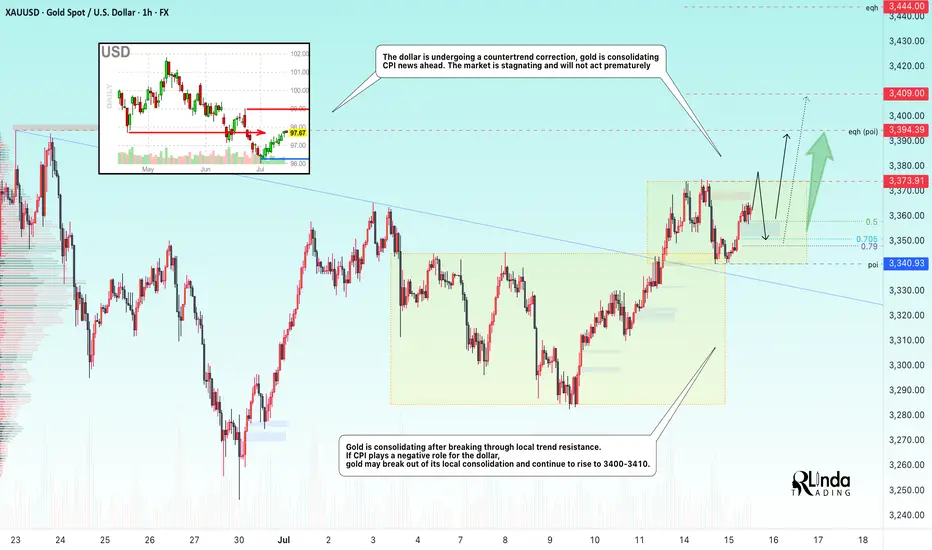
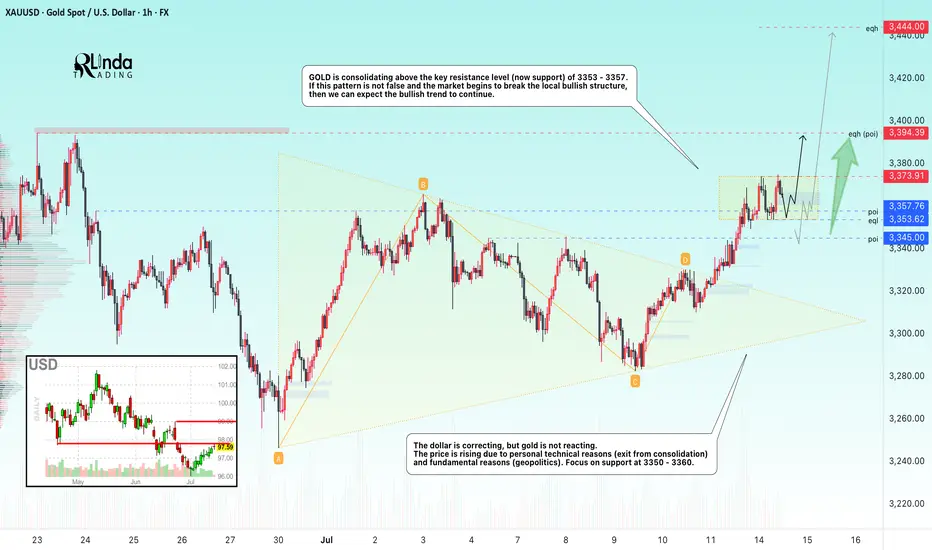
GOLD → Consolidation ahead of CPI. Chances for growth?FX:XAUUSD Gold is consolidating amid a correction in the dollar ahead of important news. Consumer price index data is due later today. The market is stagnant and will not move prematurely.
On Tuesday, gold rose slightly amid profit-taking ahead of the US CPI release. Investors are waiting for a signal from inflation: weaker data could strengthen bets on a Fed rate cut and support gold, while strong inflation would strengthen the dollar and put pressure on the metal. The situation is exacerbated by Trump's new tariff threats and his criticism of the Fed chair. Let me remind you of Trump's pressure on regulators regarding inflation and interest rate cuts.
Technically, gold is trading above the previously broken “symmetrical triangle” consolidation. Bulls are trying to hold their ground above 3340-3350. Focus on the current range of 3340-3373
Resistance levels: 3373, 3394
Support levels: 3350, 3340
Favorable news for gold could boost interest in the metal, which would generally lead to growth. However, there is a factor of unpredictability, and against this backdrop, gold may test support at 3350-3340. If the bulls manage to keep the price above this zone, we may see growth in the medium term. Otherwise, the price may drop to 3310-3280.
Best regards, R. Linda!
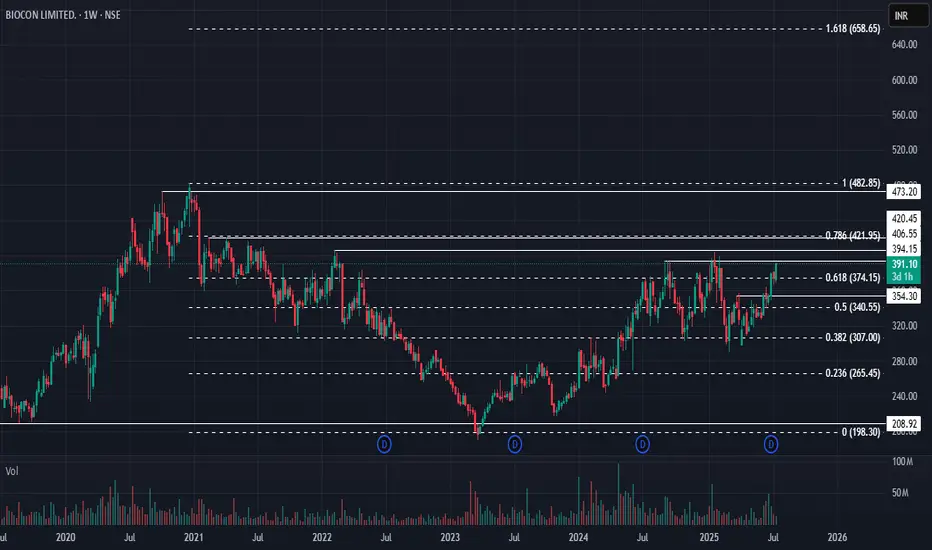
Biocon: Heading for All-Time High?🚀 Biocon: Heading for All-Time High? 🚀
📉 CMP: ₹390
🔒 Stop Loss: ₹330
🎯 Targets: ₹428 | ₹478 | ₹560
🔍 Why Biocon Looks Promising?
✅ Weekly Rounding Bottom Breakout: Breakout triggered above ₹390
✅ Weekly Box Breakout: Confirmation above ₹398 strengthens the setup
✅ Final Confirmation: A weekly close above ₹402 will validate the breakout for a potential strong upside
💡 Strategy & Risk Management:
📈 Phased Entry: Build positions gradually post confirmation to manage risk effectively
🔒 Strict SL: Maintain stop loss at ₹330 to protect capital in case of reversal
📍 Outlook: Biocon is showing strong technical signals with an all-time high on the radar, making it a compelling positional trade setup.
📉 Disclaimer: Not SEBI-registered. Please do your own research or consult a financial advisor before investing.
#Biocon #PharmaStocks #TechnicalBreakout #AllTimeHigh #SwingTrading #StockMarket #InvestmentOpportunities
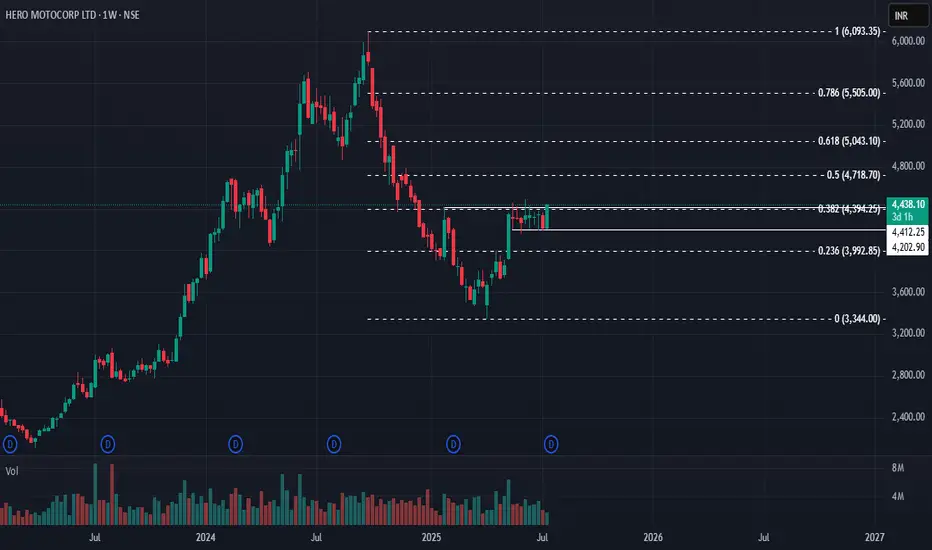
Hero MotoCorp: Reversal in Sight? 🚀 Hero MotoCorp: Reversal in Sight? 🚀
📉 CMP: ₹4438
🔒 Stop Loss: ₹4090
🎯 Targets: ₹5030 | ₹5700
🔍 Why Hero MotoCorp Looks Promising?
✅ Rounding Bottom Breakout: Weekly close above ₹4412 confirms this bullish reversal pattern
✅ Box Breakout: 8-week consolidation range of ₹4454–₹4202 broken above ₹4460, signalling strength
✅ Flag & Pole Setup: Larger range of ₹3354–₹4454 forms a flag-pole structure with breakout above ₹4460
💡 Strategic Insight:
📈 Confirmation Level: A weekly close above ₹4500 will further confirm reversal for long-term upside
🔒 Strict SL: Maintain stop loss at ₹4190 to manage downside risks effectively
📍 Outlook: Multiple technical setups indicate potential for a long-term bullish reversal with targets up to ₹5700.
📉 Disclaimer: Not SEBI-registered. Please do your own research or consult a financial advisor before investing.
#HeroMotoCorp #AutoSector #TechnicalAnalysis #BreakoutTrade #ReversalPattern #SwingTrading #StockMarketIndia #InvestmentOpportunity
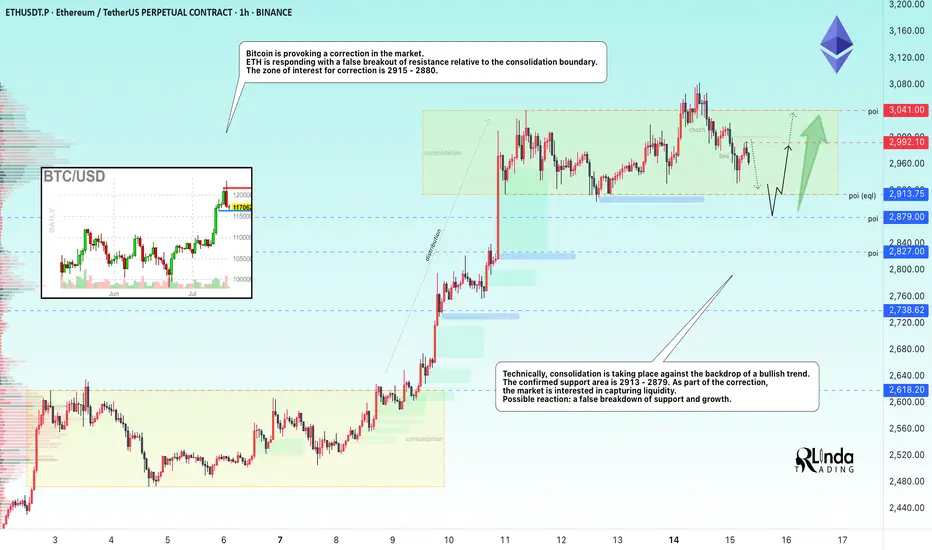
ETHEREUM → Correction to 2900 before growth BINANCE:ETHUSDT is entering a correction after a strong breakout of resistance. At the same time, Bitcoin is falling from 123K to 116K, triggering a pullback across the entire market...
On D1, ETH is facing strong resistance and is not yet ready to break it (it lacks strength after the rally). The most likely scenario after a false breakout is a correction to support. But the main focus is on Bitcoin — will there be a correction or a reversal of the local trend? If the flagship continues its decline, the cryptocurrency market will humbly follow suit.
ETH has a nearest zone of interest at 2913, where liquidity capture could attract buyers, but I do not rule out the possibility that the correction could go much deeper before further growth, for example to 2879-2827 (support on D1).
Resistance levels: 2992, 3041
Support levels: 2913.7, 2879, 2827
Technically, consolidation against a bullish trend. Confirmed support area 2913 - 2879. As part of the correction, the market is interested in capturing liquidity. If, against the backdrop of the current correction, the bulls manage to hold their ground above the specified support, ETH may still surprise us with its growth :)
Best regards, R. Linda!
GOLD → Consolidation. Long squeeze before growth to 3400FX:XAUUSD has broken through resistance at 3353-3357 since the session opened, and bulls are currently trying to keep the market in the buying zone. Should we expect a long squeeze before growth?
Gold is in local consolidation after breaking through a key level. The price is still in the consolidation phase formed during a week-and-a-half correction. The price reached a three-week high of $3,374 on Monday but fell after the EU's conciliatory statements. Investors are awaiting US inflation data and Chinese GDP figures as they assess the prospects for a Fed rate cut. Heightened geopolitical and trade tensions are keeping demand for safe-haven assets high.
Technically, gold has entered a local buying zone, but there is a fairly complex resistance zone above it, and consolidation is needed to break through it. Such patterns could include a retest of support and a liquidity grab before growth.
Resistance levels: 3373, 3394
Support levels: 3357, 3353, 3345
There is a possibility of a retest of eql 3353 in a long squeeze format and a return to resistance at 3373 for a breakout. I also do not rule out a retest of the key level of 3345. The global trend is bullish, with the price locally in a fairly wide range, with an emphasis on the support zone of 3345-3355. If the bulls can hold this zone overall, the market will have a good chance of rising to 3400-3450
Best regards, R. Linda!
EURJPY IDEA After seeing the previous day close with bullish momentum we could expect continued push to the upside but since the 4hr is trading at a HH area a slight retrace could occur before the next bullish move to the upside

BTC/USD 1H ShortTerm🔍 Trend:
The short-term uptrend remains in effect, supported by the orange trendline.
The price has tested dynamic support but has not yet broken it.
🟥 Supports (Important Levels):
🔻 1. 119.550
Key support.
The price is currently testing it. Holding = potential upside rebound.
Breaking = greater downside risk.
🔻 2. 117.260–118.040 USD
Clear demand zone (reinforced by prior consolidation).
If the price breaks below current support, this is the next logical stopping point.
🔻 3. 115.237–115.500 USD
Strong weekly support – very important in the event of a stronger correction.
Historically, it has responded many times.
🟩 Resistance:
🔼 1. USD 121.673
The nearest local resistance – this could pose a problem for further growth.
🔼 2. USD 123.961
The last local high. Breaking it confirms the continuation of the uptrend.
🔼 3. USD 125.785
The next resistance – a potential target after a breakout to the upside.
📈 Technical Indicators:
RSI (classic):
Still below 50, but starting to reverse slightly upward – neutral with a slight potential for a rebound.
Stochastic RSI:
Gives a long signal – the lines have crossed in the oversold zone and are pointing upward.
📊 Scenarios:
🟢 Bullish:
Maintaining the current support zone (119.5–120k).
Breakout above 121.673 → target: 123.961.
Breakout of 123.961 = trend confirmation and target: 125.8k+
🔴 Bearish:
Break of the trend line and support at 119.550 → possible quick decline to 117.2k–118k.
If this doesn't hold, target: 115.2k
✅ Summary:
Decisive moment – tested trend line + support = rebound or breakout point.
The Stochastic RSI indicates a potential upside breakout, but the RSI needs confirmation.
Careful monitoring of volume and reaction to 120k in the coming hours.
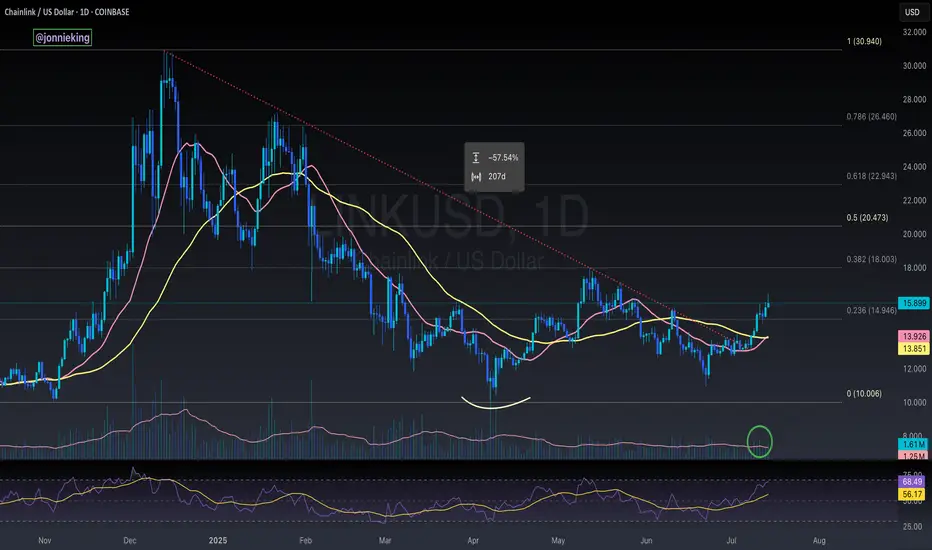
LINK has FINALLY Broken out of a 207D DowntrendReclaimed the .236 Fib 🔥
Volume to confirm ✅
Bullish crossover on the 20 / 50MA
It’s about time!!!
CRYPTOCAP:LINK Marines Unite 🪖
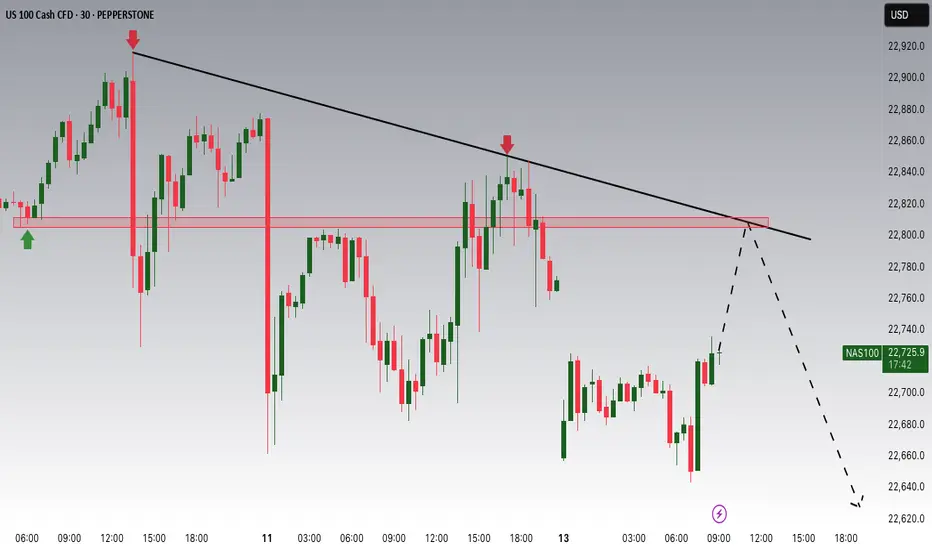
NASDAQ Potential DownsidesHey Traders, in today's trading we are monitoring NAS100 for a selling opportunity around 22,800 zone, NASDAQ is trading in a downtrend and currently is in a correction phase in which it is approaching the trend at 22,800 support and resistance area.
Trade safe, Joe.
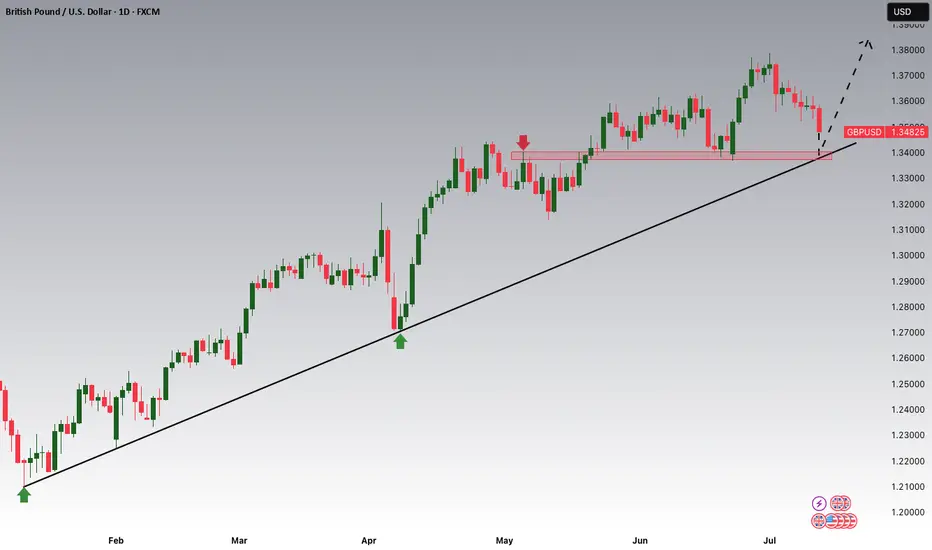
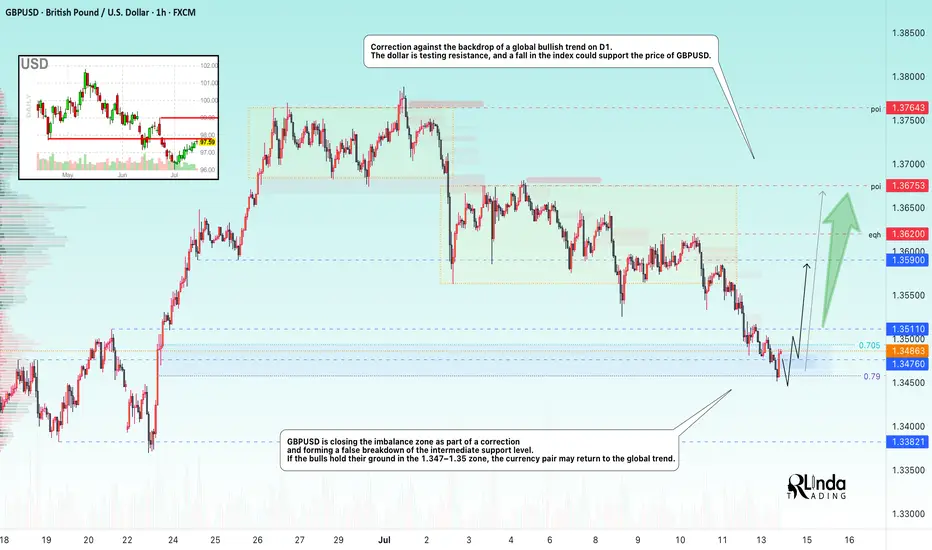
GBPUSD → Correction amid a global bullish trend...FX:GBPUSD is testing the 1.345 - 1.35 area as part of a correction. The price is closing the imbalance zone and testing support, which may trigger a reaction. Further developments will largely depend on the dollar, which is testing resistance.
The daily market structure is quite strong. The correction against the backdrop of a strong trend is within acceptable limits, and bulls should fight to keep the price away from risk zones. GBPUSD, as part of the correction, closes the imbalance zone of 1.34 - 1.35 (0.7 - 0.79f) and forms a false breakdown of the intermediate support level of 1.3476. If buyers hold their ground in the 1.347-1.35 zone, the currency pair will be able to return to the global trend.
Support levels: 1.3476, 1.345, 1.3382
Resistance levels: 1.3511, 1.359, 1.375
Price consolidation above 1.349 - 1.350 will confirm the market's intentions. In this case, we can expect growth to 1.36 - 1.374.
Best regards, R. Linda!
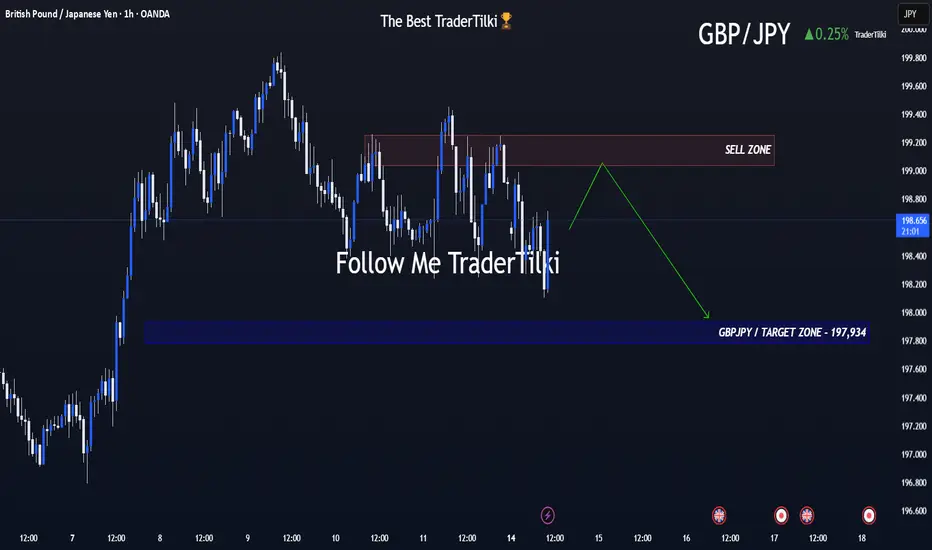
Volatile Times for GBPJPY: What’s Going On Behind the Moves?Good morning, Guys,
I’m anticipating a new short opportunity on GBPJPY once the pair reaches my sell zone level. From there, my target is set at 197.934.
Every like from you is what truly motivates me to keep sharing these insights.
Massive thanks to everyone who shows love and support!
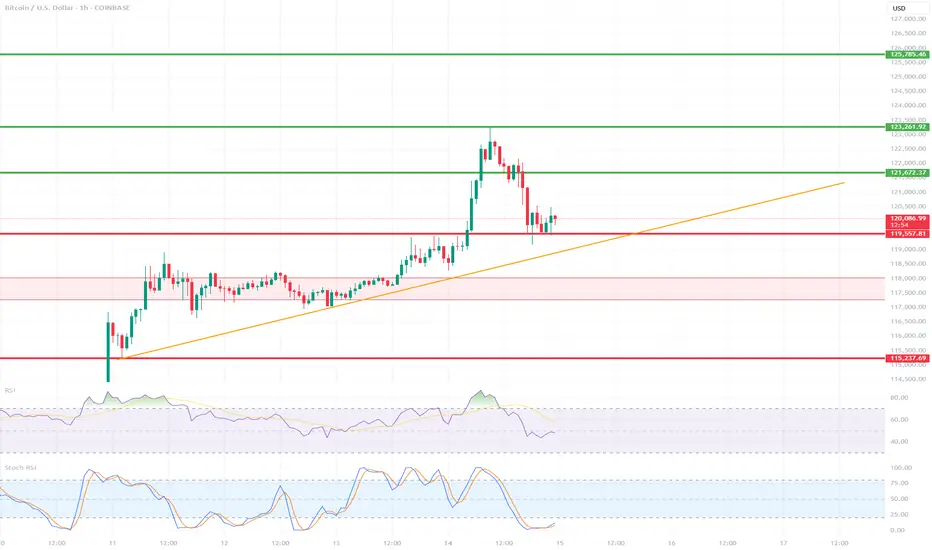
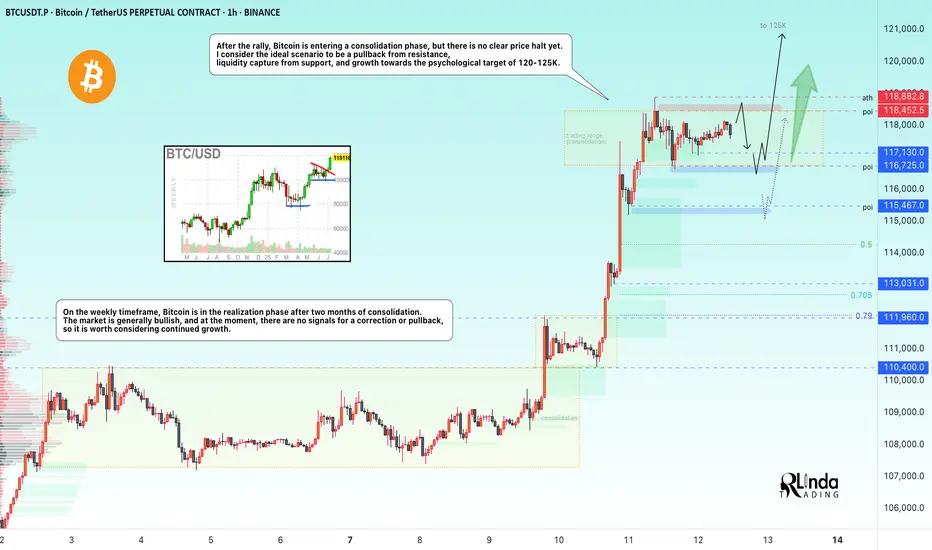
BITCOIN → Stopping after the rally? What next? 125K or 110K?BINANCE:BTCUSDT rose and updated its historical maximum to a new record of 118K with “kopecks” (different prices on different exchanges). Now the price has supposedly stopped and entered a consolidation phase, but it is too early to draw any conclusions based on this alone...
Fundamentally, Bitcoin rose following the SP500 and NQ100 indices. The reasons are clearly geopolitical. The correlation level is not high, but the flagship is following the stock indices, which are also updating their historical highs.
Technically, Bitcoin has emerged from a two-month consolidation and entered a realization phase. So what's next? Continuation of the phase or correction? Let's take a look.
On the daily chart, I would highlight two zones. The risk and sell zone is below 117,500. If the price closes below this zone today/tomorrow, we will most likely be able to look for signals for a possible correction. As part of the correction, we can expect a decline to 115,500, 114,300, or even to the old ATH of 112K.
The second zone is the buying zone. A closing price above 118,400–118,900 and consolidation with the gradual formation of a breakout of structure may hint at a possible continuation of growth toward psychological targets.
Resistance levels: 118,400, 118900
Support levels: 117100, 116700, 115500
In the chart above, I have highlighted the situations, levels, and zones that interest me more precisely.
Now I am waiting for Bitcoin to retest resistance or support and confirm certain levels, based on which decisions can be made. I think that in the near future, Bitcoin will show us where it is headed. Updates will be published as something interesting emerges...
Best regards, R. Linda!
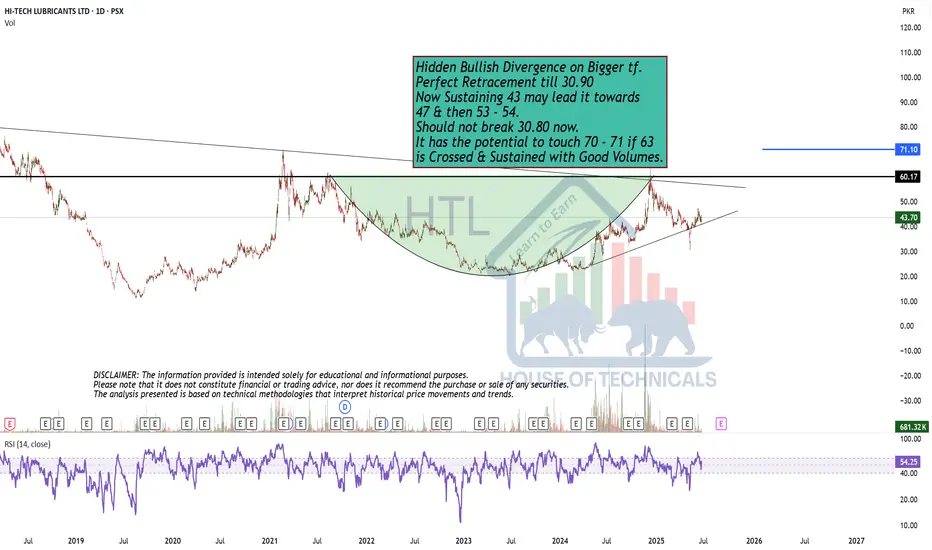
Perfect Retracement till 30.90Hidden Bullish Divergence on Bigger tf.
Perfect Retracement till 30.90
Now Sustaining 43 may lead it towards
47 & then 53 - 54.
Should not break 30.80 now.
It has the potential to touch 70 - 71 if 63
is Crossed & Sustained with Good Volumes.