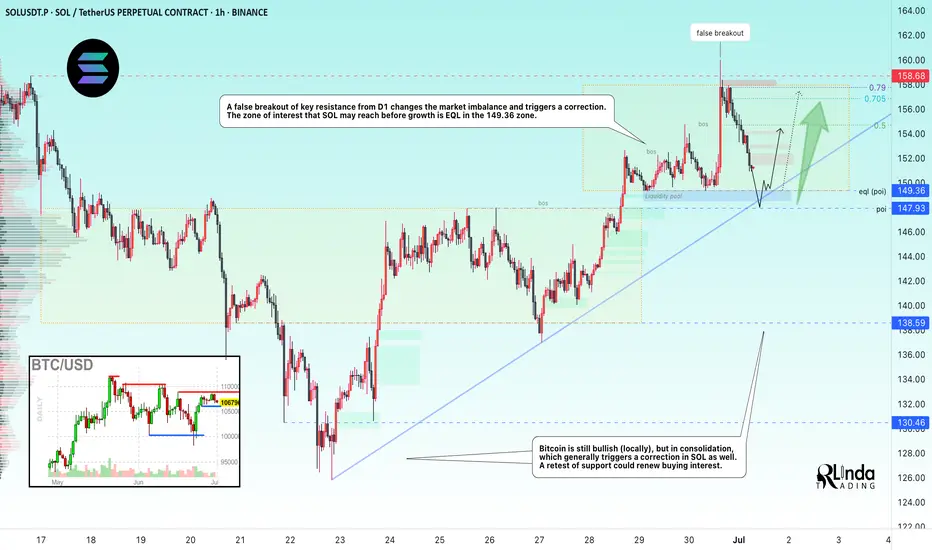
SOLUSDT → Countertrend correction and hunt for liquidityBINANCE:SOLUSDT looks quite promising on the bullish side. The price is testing one of the key resistance levels within the local trend rally. A correction is forming. Is it beneficial for us?
On the higher timeframe, we see a change in character, a breakout of the trend resistance, and the formation of an upward trend support line. Bitcoin is still bullish (locally) at this time, but it is consolidating, which generally provokes a correction in SOL as well. Focus on the 150-149 area. If the bulls are able to keep the price above this zone after the retest, followed by the formation of momentum, this can be considered a positive medium-term sign.
Locally, the price within the trading range of 149.36 - 158 is heading towards the area of interest and liquidity (eql) at 149.36. The current sell-off is most likely triggered by a large player seeking a more favorable entry into the market.
Resistance levels: 154.75, 156.8
Support levels: 149.36, 147.93
In the current situation, it makes the most sense to consider an intraday trading strategy. A countertrend correction and a retest of support could attract buyers...
Best regards, R. Linda!
Fibonacci Retracement
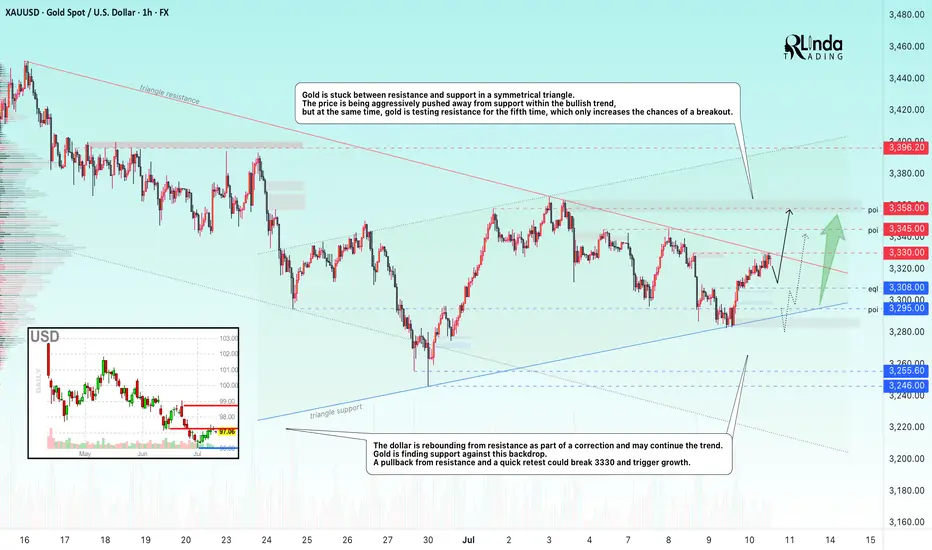
GOLD → Retest of consolidation resistance. Breakout?FX:XAUUSD is consolidating in a symmetrical triangle pattern. The price is stabilizing amid a falling dollar and uncertainty...
Gold is recovering after falling to $3,283 thanks to a weaker dollar and lower bond yields amid concerns over Trump's new tariff threats. The announced tariffs against seven countries, including Brazil and the Philippines, have heightened tensions, partially offsetting the Fed's hawkish signals. Markets are now awaiting new data from the US and speeches by Fed officials, which could influence the further dynamics of gold.
Technically, gold is squeezed between the resistance and support of a symmetrical triangle. The price is being aggressively pushed away from support within a bullish trend, but at the same time, gold is testing resistance for the fifth time, which only increases the chances of a breakout.
Resistance levels: 3330, 3345, 3358
Support levels: 3308, 3295
If gold continues to storm the local resistance at 3330 and the triangle resistance during consolidation, we will have a good chance of catching the breakout and growth. An additional scenario could be growth after a shake-up of the triangle support and the global trend.
Best regards, R. Linda!
Gold Potential UpsidesHey Traders, in today's trading session we are monitoring XAUUSD for a buying opportunity around 3,330 zone, Gold is trading in an uptrend and currently is in a correction phase in which it is approaching the trend at 3,330 support and resistance area.
Trade safe, Joe.

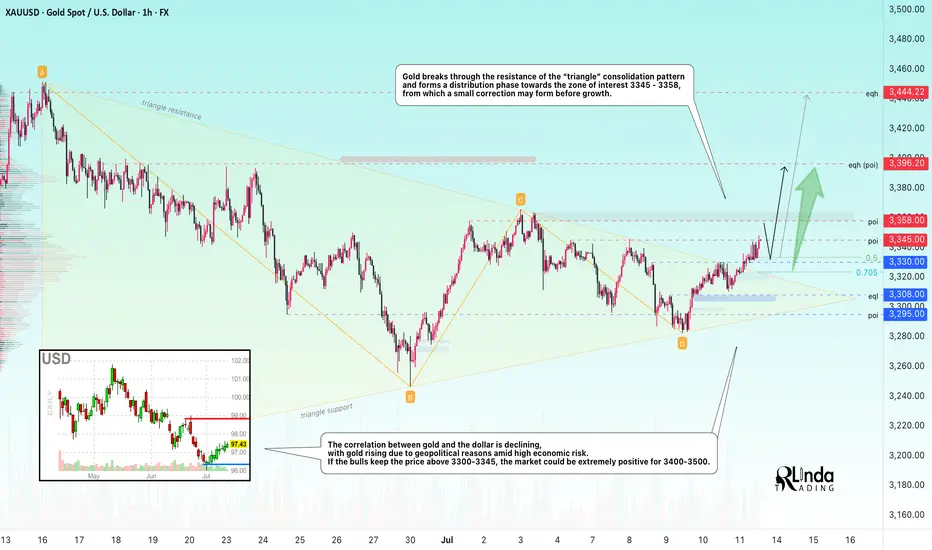
GOLD → Distribution. There is potential for growth to 3450–3500FX:XAUUSD breaks through consolidation resistance and forms a distribution pattern. A breakout of 3345-3358 could lead to another rally amid high economic risks...
Gold is rising for the third day in a row amid growing concerns about new tariffs announced by Trump. He threatened to impose tariffs on Canada and most of its trading partners, as well as the EU. Despite the strengthening of the dollar, demand for gold remains strong due to uncertainty and expectations for US inflation data next week. Investors are cautious ahead of CPI and the Fed's possible response
The correlation between gold and the dollar is declining, with gold rising due to geopolitical reasons amid high economic risks.
If the bulls keep the price above 3300-3345, the market could be extremely positive for 3400-3500.
Resistance levels: 3345, 3358
Support levels: 3330, 3308
Gold has broken through the resistance of the “triangle” consolidation pattern and is forming a distribution phase towards the zone of interest 3345 - 3358, from which a small correction may form before growth. Since 3345 is an intermediate level, the focus is on 3358. I do not rule out the possibility of a long squeeze of the support levels 3330, the triangle support, and 3310 before the growth continues.
Best regards, R. Linda!
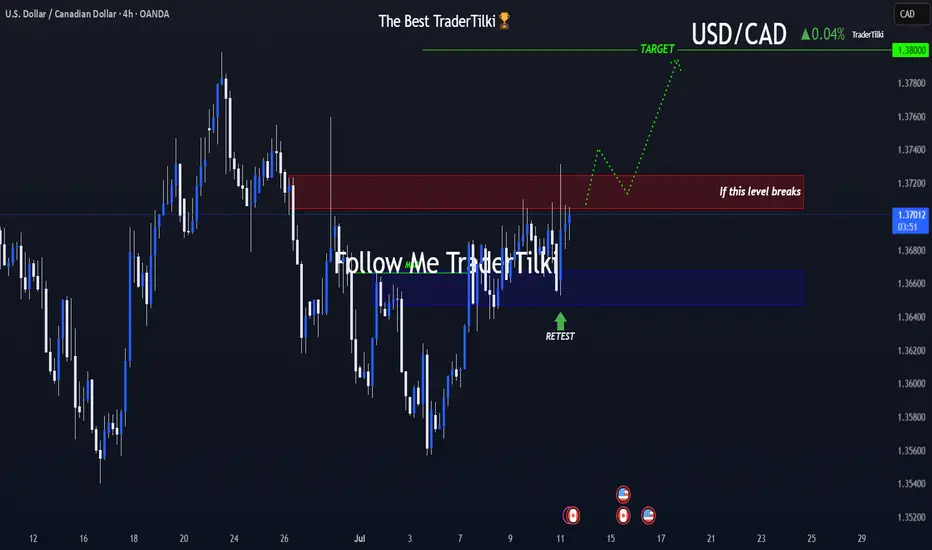
USDCAD's Opportunity Bell Is Ringing — Don’t Miss Out!Hey there, my valued friends!
I’ve prepared a fresh USDCAD analysis just for you.
📌 If the 1.37245 level breaks, the next target will be 1.38000.
Every single like you send my way is the biggest motivation behind sharing these analyses.
🙌 Huge thanks to each and every one of you who supports me!
Would you like to add a visual or a catchy headline to boost engagement even more? I can help with that too.
Balrampur Chini: Eyeing All-Time High! 🚀 Balrampur Chini: Eyeing All-Time High! 🚀
📉 CMP: ₹619
🔒 Stop Loss: ₹575
🎯 Target: ₹700
🔍 Why Balrampur Chini Looks Promising?
✅ Technical Strength: Trading above 61.8% Fibonacci level post-correction, indicating strong support
✅ Consolidation Base: Tight range between ₹615–₹580 signals accumulation before a potential breakout
✅ Upside Potential: Breakout from current range could take the stock to all-time high levels
💡 Strategy & Risk Management:
📈 Staggered Entry: Accumulate in phases as the market remains sideways; avoid expecting sharp moves
🔒 Strict SL: Maintain stop loss at ₹575 to manage risk effectively
📍 Outlook: Strong base formation with Fibonacci support makes Balrampur Chini an attractive swing opportunity towards ₹700.
📉 Disclaimer: Not SEBI-registered. Please do your own research or consult a financial advisor before investing.
#BalrampurChini #SugarStocks #TechnicalAnalysis #BreakoutTrade #SwingTrading #StockMarketIndia #InvestmentOpportunities

Understanding Elliott Wave Theory with BTC/USDIntroduction to Elliott Wave Theory:
Elliott Wave Theory is a popular method of technical analysis that seeks to predict the future price movement of financial markets. Developed by Ralph Nelson Elliott in the 1930s, the theory is based on the idea that market movements follow a repetitive pattern, driven by investor psychology.
At the core of Elliott’s theory is the idea that markets move in a 5-wave pattern in the direction of the trend, followed by a 3-wave corrective pattern. These waves can be seen on all timeframes and help traders identify potential entry and exit points in the market.
Key Concepts of Elliott Wave Theory:
1. Impulse Waves (The Trend)
2. These are the waves that move in the direction of the overall trend. They are labeled 1, 2, 3, 4, 5 and represent the price movement in the main direction of the market.
* Wave 1: The initial move up (or down in a bearish market). I like to mark up the first wave how I do my Fibs, from the point where price showed a major impulse.
* Wave 2: A correction of Wave 1 (it doesn’t go lower than the starting point of Wave 1).
* Wave 3: The longest and most powerful wave in the trend.
* Wave 4: A smaller correction in the direction of the trend.
* Wave 5: The final push in the direction of the trend, which can be shorter and weaker than Wave 3.
3. Corrective Waves (The Pullbacks)
4. After the five-wave impulse, the market enters a corrective phase, moving against the trend. This corrective phase is generally a 3-wave pattern, labeled A, B, C:
* Wave A: The initial correction, typically smaller than Wave 3.
* Wave B: A temporary move against the correction (it often confuses traders who think the trend has resumed).
* Wave C: The final move against the trend, usually the strongest and most aggressive.
How to Implement Elliott Wave on BTC/USD:
Let’s break down how you can apply the Elliott Wave Theory to BTC/USD using a simple example.
1. Identify the Trend
2. Start by identifying the current market trend for BTC/USD. Are we in an uptrend or downtrend? This will determine whether you’re looking for a 5-wave impulse up (bullish) or down (bearish).
3. Locate the Waves
4. Look for the five-wave structure in the trend direction. Once you identify a potential impulse move, label the waves accordingly:
* Wave 1: A new uptrend starts.
* Wave 2: A small pullback (usually less than the size of Wave 1).
* Wave 3: A significant surge in price, often the most volatile.
* Wave 4: A smaller pullback or consolidation.
* Wave 5: The final push higher, which might show signs of exhaustion.
5. Corrective Phase
6. After completing the 5-wave impulse, expect a corrective 3-wave pattern (A, B, C). These corrections typically last longer than expected and can often confuse traders.
* Wave A: Price starts to reverse.
* Wave B: A retracement that may confuse traders into thinking the trend is resuming.
* Wave C: A strong pullback that brings the price even lower.
7. Use Fibonacci Levels as confluence
8. One of the most powerful tools in Elliott Wave analysis is Fibonacci retracement levels. You can use these to predict potential levels where Wave 2 and Wave 4 could end, or where Wave C might complete the correction. Common retracement levels are 38.2%-50% for Wave 4, and 50-61.8% For Waves 2 and B but keep in mind, these wave can retrace up to 100% before the wave analysis becomes invalid. But ideally these points are where you look to make an entry.
Wave 2 Example:
This one hit the golden spot (0.5-0.618) perfectly and continued to push upward.
Wave B and C Example:
This example hit closer to the 0.786 level which is also a key level for retracement.
Wave 4 Example:
This one hit the golden spot (0.382-0.5) for Wave 4 perfectly before continue the bullish momentum.
I try to use the RED levels below (1.1 and 1.2) as my invalidation (Stop Loss) levels and the GREEN levels (-0.27 and -0.618) as my Take Profit levels. Depending on your goals you can also use Fib Levels 0.236 and 0 as partial Take Profit levels.
9. Confirm with Indicators
10. To validate your Elliott Wave counts, use other indicators like the RSI (Relative Strength Index), MACD, or Moving Averages. For example, a Wave 3 might occur when the RSI is above 50, indicating strength in the trend.
In this example you can see the RSI cross the 50 threshold and the 3rd Wave form.
Continuation after the Wave is complete:
Tips for Trading with Elliott Wave Theory:
* Stay Flexible: Elliott Wave Theory is not set in stone. If the market doesn’t follow the expected pattern, adjust your wave counts accordingly.
* Don’t Rely on One Timeframe: A 5-wave structure on one timeframe may be part of a larger wave pattern on a higher timeframe. Always analyze multiple timeframes.
* Wave Personality: Waves don’t always look the same as stated earlier. Wave 2 can retrace up to 100% of Wave 1 and Wave 4 should generally not overlap Wave 1 or this may invalidate the Wave structure.
* Risk Management: Always use proper risk management techniques. No theory is perfect, so make sure you have a stop-loss in place to manage your risk.
Conclusion: Using Elliott Wave Theory on BTC/USD:
The Elliott Wave Theory can be a powerful tool for analyzing and forecasting price movements. By identifying the 5-wave impulse and 3-wave corrective patterns, you can gain insights into potential market direction. Just remember to use it alongside other tools and indicators for confirmation, and don’t forget to manage your risk.
As you apply it to BTC/USD or any other asset, remember that the market doesn’t always follow the "ideal" patterns, and flexibility is key. Practice on different timeframes, refine your skills, and use the theory as a part of your overall trading strategy.
Final Thoughts:
If you're just starting, don't get discouraged if you miss a wave or two. Trading is a journey, and with patience and practice, you'll begin to spot these patterns more naturally. Whether you’re analyzing Bitcoin's price action or any other asset, Elliott Wave Theory can give you a deeper understanding of market psychology.
Good Luck and Happy Trading!

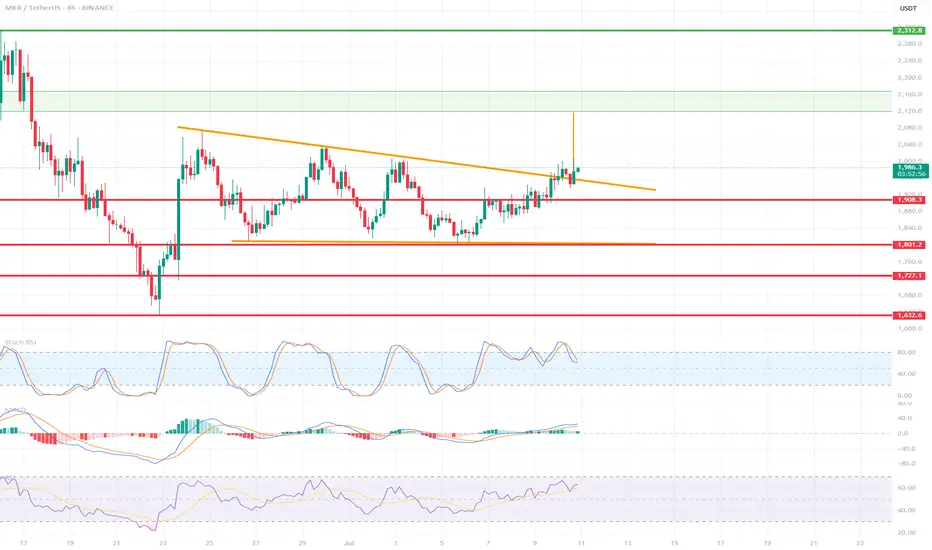
MKR/USDT 4H Chart🔍 1. Technical Pattern:
The chart shows a descending wedge (orange lines) that has broken out upward.
The breakout occurred on increasing volume (a signal of bullish strength).
The price is currently trading above a resistance line, which is now acting as support (~1980 USDT).
📊 2. Support and Resistance Levels:
Support (red lines):
1903 USDT – local consolidation support.
1801 USDT – strong support at the previous bottom.
1727 and 1632 USDT – fallback zones in case of strong declines.
Resistance (green and blue lines):
2120 USDT – first target after the breakout.
2168 USDT – another strong resistance from the previous consolidation.
2312 USDT – high resistance, potential target if the uptrend continues.
📈 3. Indicators:
🔹 Stochastic RSI:
Close to the overbought zone, but not yet giving a sell signal.
A short consolidation or correction may occur in the coming hours.
🔹 MACD:
The MACD line is above the signal and the histogram is still rising – a buy signal.
No signs of weakening momentum.
🔹 RSI:
The RSI is rising, but not yet in the overbought zone (>70).
Shows the strength of the trend, but there is room for further upward movement.
🧠 Summary and scenarios:
✅ Bullish scenario:
If the price remains above 1980 USDT, the next targets are:
2120 USDT
2168 USDT
Potentially 2312 USDT with continued demand
⚠️ Bearish scenario (less likely at this time):
If the price returns below 1980 USDT and does not regain this level:
Possible return to 1903 or lower (1801 USDT).
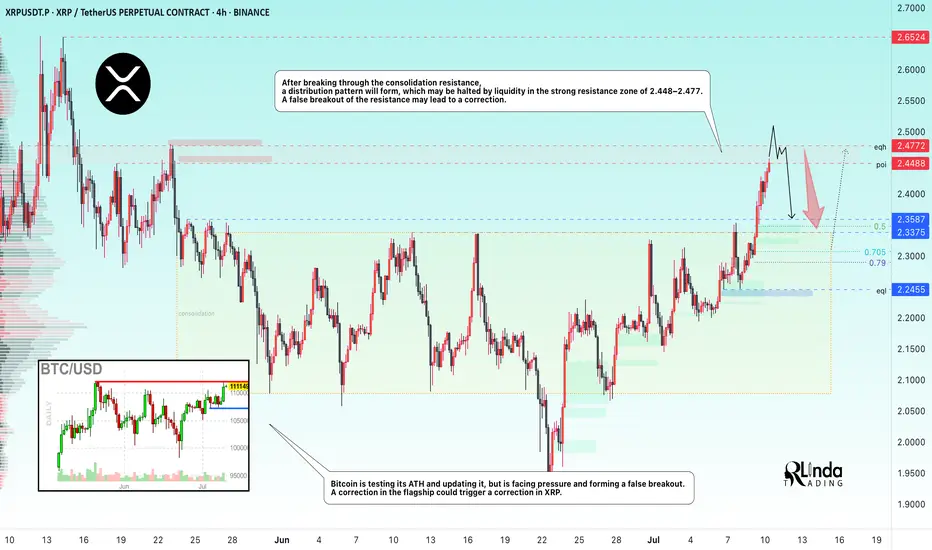
XRPUSDT → Resistance ahead. Correction before growthBINANCE:XRPUSDT is rising after breaking through consolidation resistance. Bitcoin's rally supported the overall market momentum, but a new resistance zone lies ahead...
Bitcoin is testing its ATH and updating it, but is facing pressure and forming a false breakout. A correction in the flagship coin could trigger a correction in XRP, but if Bitcoin continues to storm the 112K area without a pullback, followed by a breakout, the market could find support and continue to rise.
After XRP broke through resistance, the coin entered a distribution phase and is testing an important resistance zone of 2.4488 - 2.4772. The inability to continue growth, a false breakout, and price consolidation in the selling zone could trigger a correction.
Resistance levels: 2.4488, 2.4772, 2.6524
Support levels: 2.3587, 2.3375, 2.2455
Despite breaking through resistance, XRP is still in a local downtrend. Pressure on the market is still present. The formation of a false breakout will indicate that growth is limited for now. However, if the price consolidates above 2.4772 and begins to break out of the local structure, we can expect growth to continue.
Best regards, R. Linda!
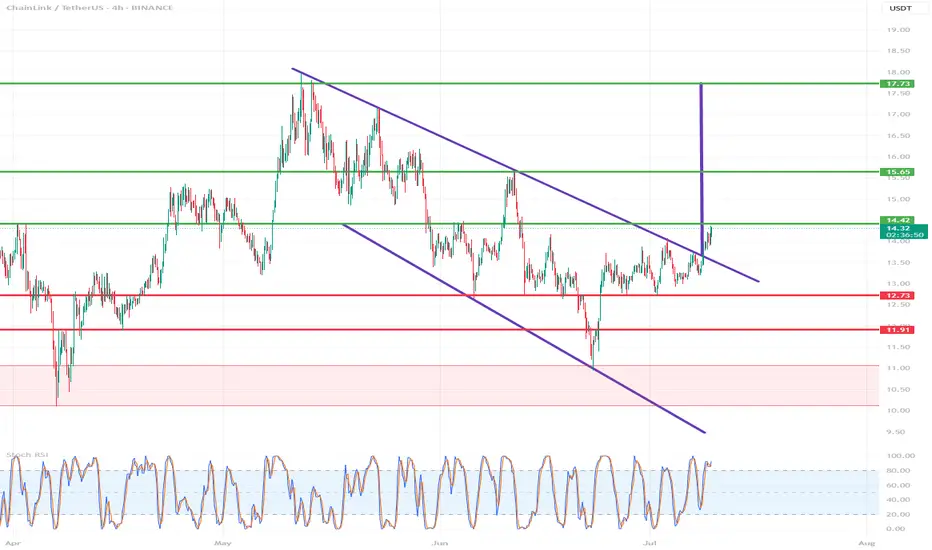
LINK/USDT (Chainlink to Tether) from the 4H interval⚡️ Technical situation – quick overview
✅ Breakout from the descending channel (purple lines)
✅ Resistance zone 14.42 – currently being tested
✅ Target within the breakout range – around 17.73 USDT
⚠️ Stochastic RSI in the overbought zone – local correction possible
🟪 Descending channel – broken!
The descending channel that has been in place since mid-May has been broken upwards.
Such breakouts often signal a change in the local trend.
Theoretical range of movement = channel height (~3.30 USDT) added to the breakout point (around 14.42) = ~17.73 USDT – perfectly aligned with your resistance level.
🟢 Key Resistance Levels (green):
Level Meaning
14.42 USDT Current tested resistance – psychologically significant
15.65 USDT Local high + June price gap
17.73 USDT Potential target after a breakout – range from the formation
🔴 Support Levels (red):
Level Meaning
12.73 USDT Support from the pre-breakout consolidation
11.91 USDT Key defensive level of the uptrend
11.07 / 10.12 USDT Historical support with strong demand reactions
📉 Stochastic RSI (oscillator):
Currently deep in the overbought zone (above 80).
This may indicate local exhaustion of momentum and a short correction before further upward movement.
However: in strong trends, the RSI may remain high for an extended period – it does not automatically provide a sell signal.
📈 Bullish scenario:
Retest of the 14.42 level as support → confirmation of the breakout
Then a move towards:
15.65 – local stop
17.73 – final target from the channel breakout
🟩 Stop-loss: e.g., below 12.73 USDT (loss of key support)
📉 Bearish scenario:
False breakout and decline below 14.42
Loss of the 12.73 level → possible quick decline to 11.91–11.07
🔴 In this case, a new swing low could open the way to 10.12 USDT.
📌 Summary:
Element Rating
Technical Pattern ✅ Breakout from a descending channel (bullish signal)
Current Level ❗ Test of Key Resistance – Decision Point
RSI (Momentum) ⚠️ Overbought – Correction Possible
Upside Potential (Target) 📈 17.73 USDT
Threat ❌ False breakout and return to below 12.73 USDT
🧠 My suggestion (not investment advice):
Observe the price reaction at 14.42 – if it holds above and consolidation forms → a signal to continue.
If the 4H/1D candle closes below, consider caution, as this could be a bull trap.
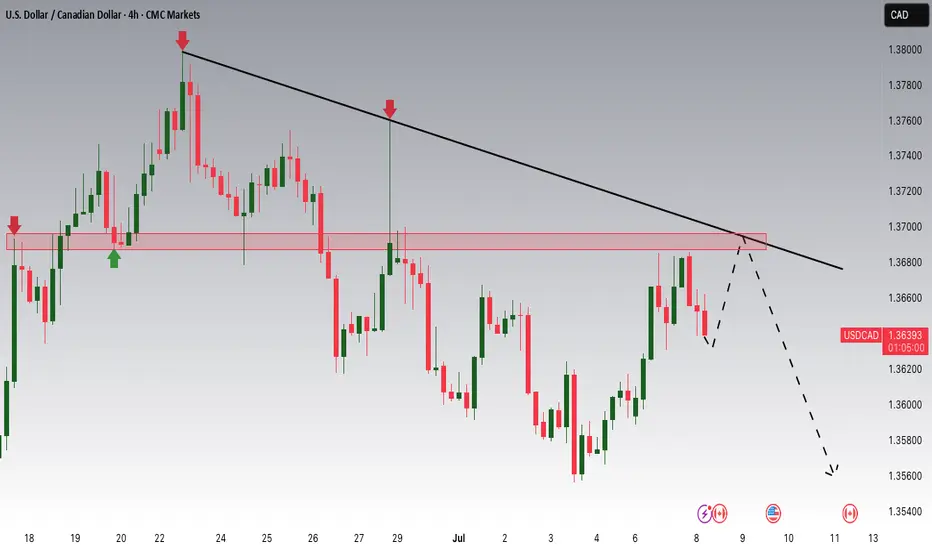
USDCAD Potential DownsidesHey Traders, in today's trading session we are monitoring USDCAD for a selling opportunity around 1.36900 zone, USDCAD is trading in a downtrend and currently is in a correction phase in which it is approaching the trend at 1.36900 support and resistance area.
Trade safe, Joe.
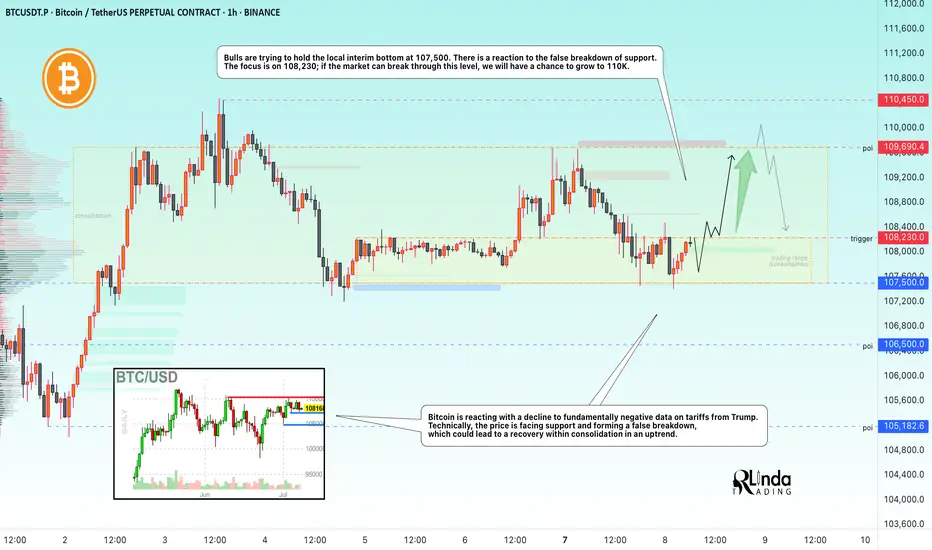
BITCOIN → Market manipulation. Chance for growth to 110KBINANCE:BTCUSDT , as part of a correction triggered by negative news from the US regarding tariffs, is testing liquidity in the support zone. There is a chance of recovery to 110K.
Bitcoin is reacting with a decline to fundamentally negative data on tariffs from Trump. Technically, the price is facing support and forming a false breakdown, the purpose of which was to capture liquidity. This could lead to a recovery within consolidation in an uptrend, but again, there are conditions...
Countries that have received notification of tariffs are responding positively to cooperation (if this trend continues, Bitcoin could receive a local bullish driver).
The market perceives this as positive, and after liquidity is captured, the price could recover to the resistance of the trading range.
Resistance levels: 108230, 109690
Support levels: 107500, 106500
Bulls are trying to hold the local interim bottom at 107500. There is a reaction to the false breakdown of support. The focus is on 108230; if the market can break through this level, we will have a chance to grow to 110K.
Best regards, R. Linda!
AUDUSD 4H: Sell Zone Confirmed📉 AUDUSD Analysis – Current Trend & Trade Opportunity
Hello Traders,
I’ve prepared an updated analysis for the AUDUSD pair.
At the moment, AUDUSD has shifted out of its previous bullish structure and has now entered a bearish trend. Based on this shift, I’m planning to enter a limit sell trade at the level shared below:
🔹 Limit Sell Entry: 0.65232
🔹 Stop Loss: 0.65576
🔹 Targets:
• TP1: 0.64591
• TP2: 0.64591
• TP3: 0.63738
🔸 Risk/Reward Ratio: 4.27
Considering the trend reversal, I’m looking to open a position from these levels.
I meticulously prepare these analyses for you, and I sincerely appreciate your support through likes. Every like from you is my biggest motivation to continue sharing my analyses.
I’m truly grateful for each of you—love to all my followers💙💙💙

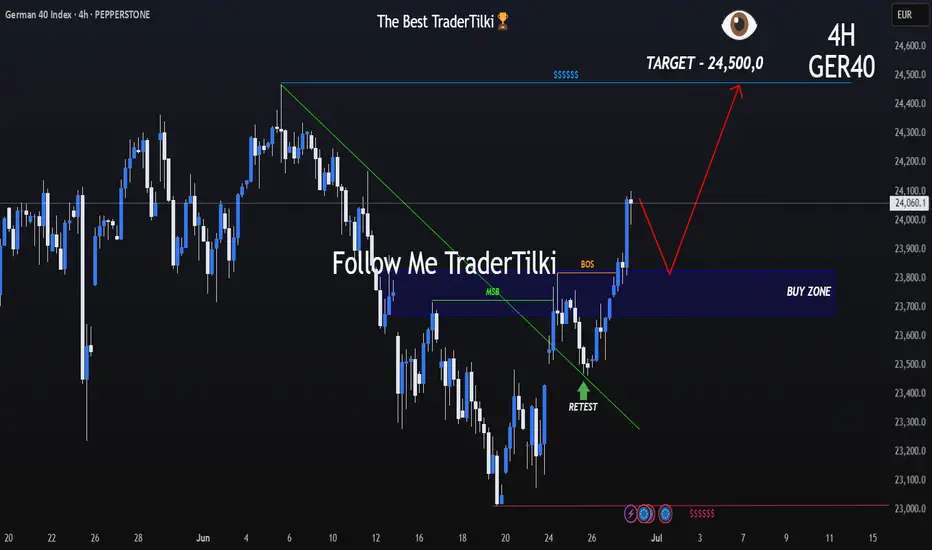
Is the Trend Intact? Key Signal Emerging on GER40 4H ChartHey Guys,
We could see a pullback on the GER40 index from the 24,060 level. If that happens, the 23,824 – 23,675 zone could present a potential buying opportunity. The primary trend still points upward, and bullish momentum remains intact.
Also worth noting—the rise in volume is quite striking, which supports my target level of 24,500.
I meticulously prepare these analyses for you, and I sincerely appreciate your support through likes. Every like from you is my biggest motivation to continue sharing my analyses.
I’m truly grateful for each of you—love to all my followers💙💙💙
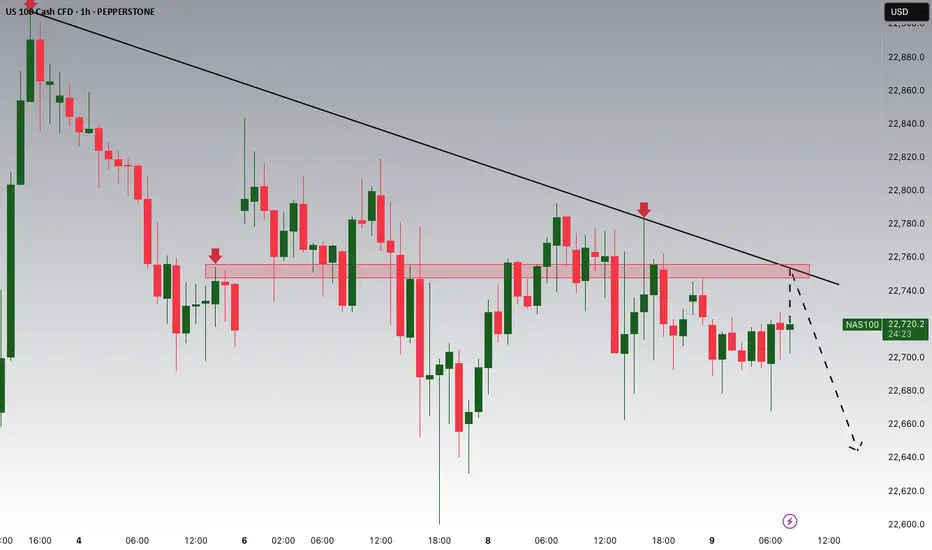
NASDAQ Potential DownsidesHey Traders, in today's trading session we are monitoring NAS100 for a selling opportunity around 22,750 zone, NASDAQ is trading in a downtrend and currently is in a correction phase in which it is approaching the trend at 22,750 support and resistance area.
Trade safe, Joe.
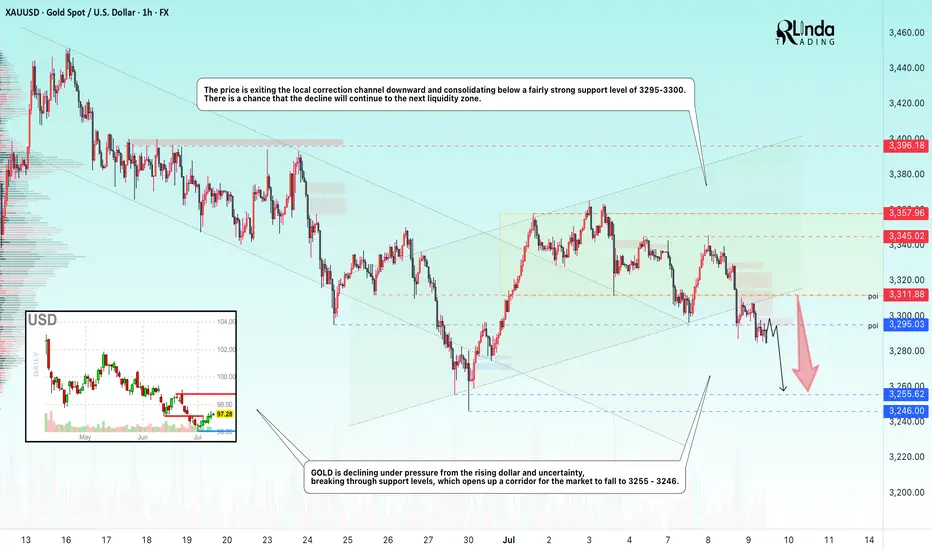
GOLD → Readiness to test the local bottomFX:XAUUSD is under pressure from the rising dollar and uncertainty, breaking through support levels, which opens up a corridor for the market to fall to 3255 - 3246
The price of gold is consolidating around $3300 after falling more than 1% amid expectations of the Fed minutes and news about tariffs.
Investors remain cautious: the dollar is supported by hopes for US trade deals, while the threat of new tariffs from August 1 is holding back gold's growth.
Weak inflation data in China did not support the metal, while expectations that the Fed will not rush to cut rates due to inflationary pressure from tariffs are also limiting interest in gold. Traders are waiting for the Fed minutes and new statements from Trump to determine the further direction.
Technically, the market looks weak (on D1, the price closed below the key level of 3300 on Tuesday) and there is a chance of a further decline.
Resistance levels: 3300, 3311
Support levels: 3295, 3255, 3246
Consolidation below 3295-3300 could trigger a further decline to 3255, from which the market could react with a correction.
Buying can be considered if gold reverses the short scenario, manages to strengthen to 3311, and consolidates above this level. At the moment, the price is in the selling zone...
Best regards, R. Linda!
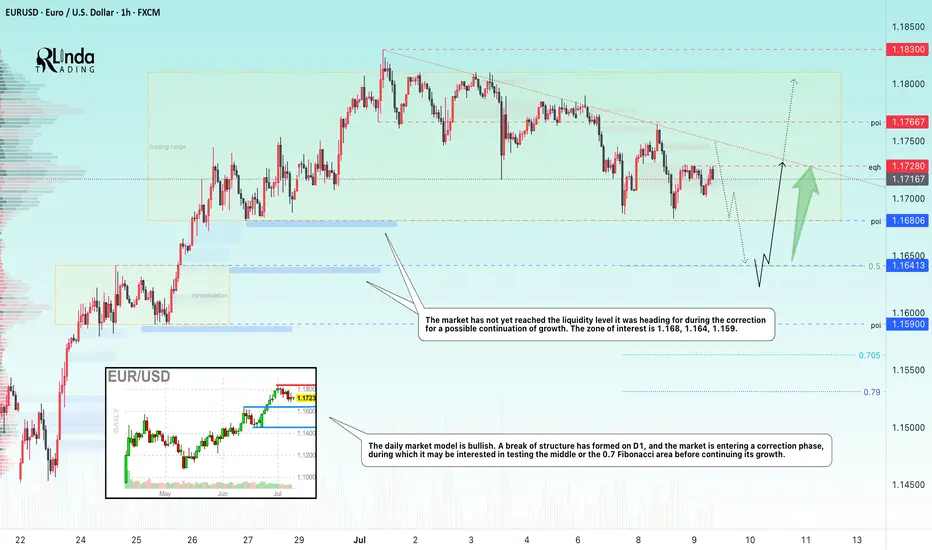
EURUSD → Bullish daily structure. Correction before growthFX:EURUSD , after significant growth and a break of structure, has entered a local correction, the target of which may be a phase of accumulation of potential for updating intermediate highs (1.183).
The daily market model is bullish. A break of the structure has formed on D1, and the market is entering a correction phase, during which it may be interested in testing 0.5 or the 0.7 Fibonacci area before continuing its growth. I would also like to draw attention to the previously broken resistance level of 1.164 - 1.163, which, within the current correction, may act as a support level for buyers...
In addition, the market has not yet reached the liquidity level it was heading for during the correction for a possible continuation of growth. Zone of interest: 1.168, 1.164, 1.159
Resistance levels: 1.1728, 1.1766
Support levels: 1.168, 1.164, 1.159
A false breakdown of the specified support zone could change the market imbalance and attract buyer interest, which could generally support the bullish trend.
Best regards, R. Linda!
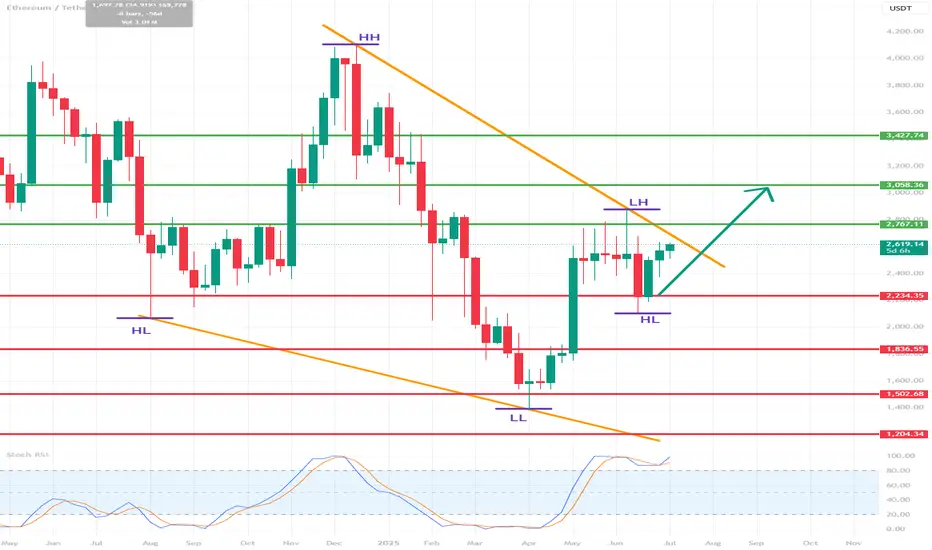
ETH/USDT 1W Chart📊 Trend structure (Price Action)
Downtrend (historical):
A series of Lower Highs (LH) and Lower Lows (LL) — a classic downtrend.
Confirmed by the orange downtrend line.
A change in structure — a possible beginning of an uptrend:
A Higher Low (HL) has recently been formed after a Lower Low (LL).
Suggests a possible end to the downtrend and an attempt to break out upwards.
Currently:
The price is testing the upper downtrend line.
A breakout above the orange line may confirm a trend change.
🟢 Key Resistance Levels (Green Lines):
Level Meaning
3.058 USDT Potential target after a breakout from consolidation
2.767 USDT Nearest strong resistance - currently being tested
3.427 USDT Deep resistance level from the previous high (HH)
🔴 Key Support Levels (Red Lines):
Level Meaning
2.234 USDT Nearest support - previous breakout
1.883 USDT Early 2023 support
1.507 USDT Local bottom
1.204 USDT Historical support - LL extreme
📉 Stochastic RSI (Momentum Indicator):
Currently in the overbought zone.
This may suggest a short-term correction before an actual breakout.
However, in a strong uptrend, the indicator may "hang out" in the overbought zone for a long time.
📈 Potential scenario:
If the breakout above 2.767 and the orange trendline holds:
A possible move to 3.058 USDT as the first target.
Extended target: 3.427 USDT (HH).
If the breakout fails:
Correction to 2.234 USDT or lower.
There is a risk of returning to a downtrend.
✅ Bullish signals:
Higher Low (HL) formation after Lower Low (LL).
Testing the upper downtrend line with an attempt to breakout.
Volume is increasing (based on candles).
⚠️ Bearish threats:
Stochastic RSI in the overbought zone.
Breakout not confirmed by 100% (needs a weekly closing candle above 2.767).
Resistance at 3,058 could halt the move.
📌 Conclusion:
Ethereum (ETH) could be on the cusp of a new uptrend, but a breakout above 2,767 USDT is needed for confirmation. If it does, a move to 3,058 and then 3,427 is possible. However, the current overbought level on the Stochastic RSI could signal a short-term correction before the trend gains strength.
30M Insight: EURUSD Buy Limit ReadyGood Mornıng Traders;☀️
Based on a 30-minute analysis, I’ve identified a shift in EURUSD market structure. I’ll be waiting for price to reach my level with a buy limit order.
📥 BUY LIMIT ORDER: 1.17180
🛑 STOP LOSS: 1.16946
🎯 TP1: 1.17275
🎯 TP2: 1.17412
🎯 TP3: 1.17649
📊 Risk / Reward Ratio: 2.00
Patience meets precision. Let the market come to you.
🧠 Master your mindset with iron discipline.
Never fear the trade—let the trade fear you.
Keep your motivation high and your focus sharper than ever.
-----
Your likes and support are what keep me motivated to share these analyses consistently.
Huge thanks to everyone who shows love and appreciation! 🙏

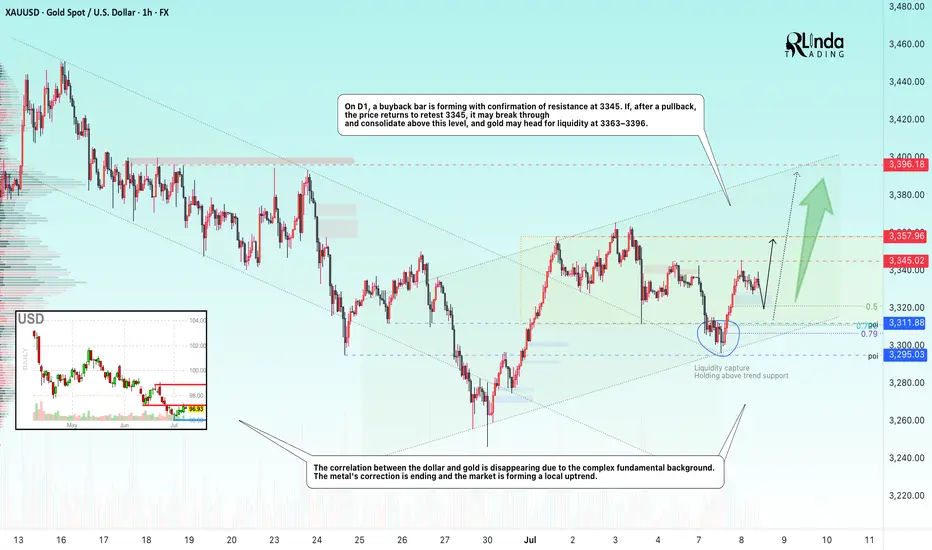
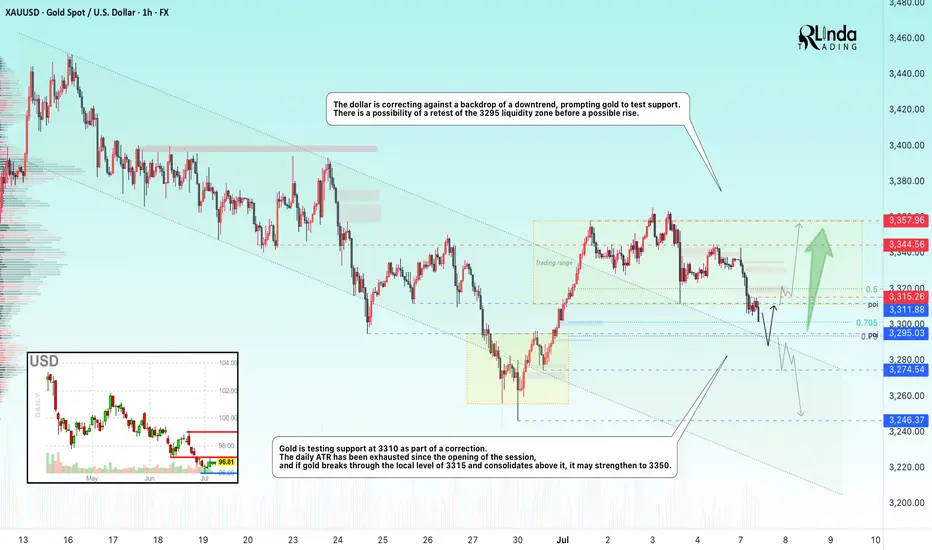
GOLD → Correction for confirmation before growthFX:XAUUSD is recovering due to increased demand as a safe-haven asset. After breaking through local trend resistance, an upward channel is beginning to form on the chart.
On Monday, gold tested the 3295-3300 zone (liquidity zone) and, against the backdrop of incoming economic data, is buying back the decline, forming a rather interesting pattern that could lead to continued growth, but there is a but!
Investors are reacting to President Trump's threats to impose tariffs on imports from a dozen countries starting August 1. In addition, the main question is the Fed's interest rate decision. The regulator is likely to leave the rate unchanged due to inflation risks.
Uncertainty surrounding tariffs is supporting interest in gold as a safe-haven asset. The market is awaiting further news and the publication of the Fed minutes on Wednesday.
Resistance levels: 3345, 3357, 3396
Support levels: 3320, 3311, 3295
A correction to support is forming. If the bulls hold their ground within the upward channel and above the key areas of interest, the focus will shift to 3345, a resistance level that could hold the market back from a possible rise. A breakout of this zone would trigger a rise to 3357-3396.
Best regards, R. Linda!
GOLD → Buyers are hesitant due to new tariffsFX:XAUUSD continues its correction phase after updating local highs and breaking through trend resistance. The dollar is making traders nervous...
After rising 2% last week, gold started Monday with a decline to $3,300 amid a stronger dollar due to the risk of new tariffs from Trump, who sent letters to 12 countries threatening to impose duties of up to 70% if no agreements are reached by July 9. This boosted demand for the dollar as a safe-haven asset.
Gold is also under pressure from strong US employment data, which has dampened expectations of a rate cut. The market is focused on news on tariffs and the publication of the Fed minutes on Wednesday, which may clarify the outlook for monetary policy.
Technically, the correction may end in the 0.7 Fibonacci zone, in the range of 3295-3300. After the formation of a reversal pattern, the market may strengthen to 3350-3360.
Resistance levels: 3315, 3344, 3358
Support levels: 3300, 3295
Locally, the price is trying to consolidate below the range, which could lead to a decline to 3300-3295. If, during the correction from support, the market manages to consolidate above 3315, we can expect growth. Otherwise, a weak reaction at 3295 could lead to a retest of 3275 and consolidation in the selling zone, which could lead to a further decline to 3245 .
BUT! We are closely monitoring the position of the US and Trump on tariffs, as he is once again issuing ultimatums to countries, to which the markets are reacting...
Best regards, R. Linda!
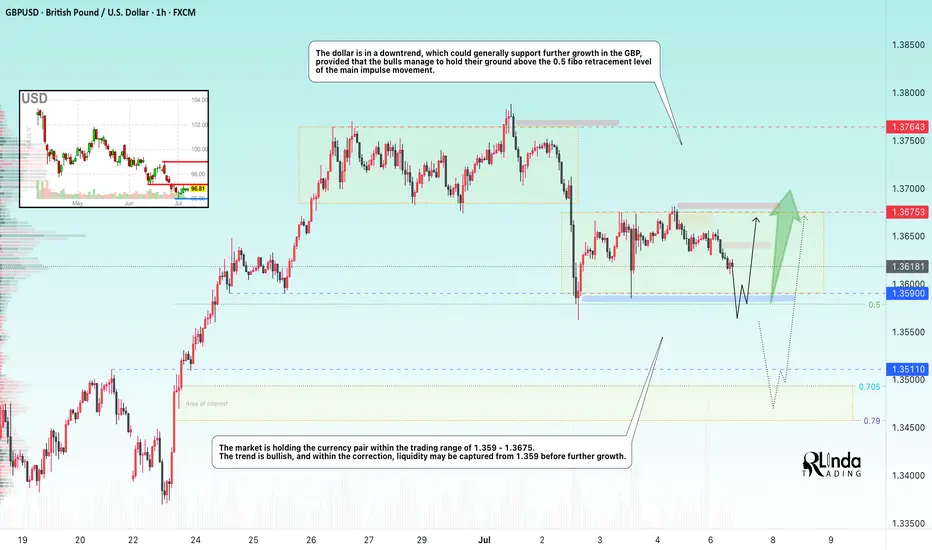
GBPUSD → Correction before the bullish trend continuesFX:GBPUSD is forming a trading range for consolidation of potential ahead of a possible continuation of growth as part of a countertrend correction.
The dollar is trying to recover from its decline due to a local change in the fundamental background, but the global trend for the DXY is bearish. This could provide support for the GBP to continue growing, provided that the bulls hold their defense above the 0.5 Fibonacci zone of the main impulse movement.
The market is holding GBPUSD within the trading range of 1.359 - 1.3675. The trend is bullish, and within the correction, liquidity may be captured from 1.359 before further growth.
Resistance levels: 1.3675, 1.3764
Support levels: 1.359, 1.3511
If the reaction to the subsequent retest of support at 1.359 is weak, we can consider a continuation of the correction to the 0.7-0.79 Fibonacci zone, which would be the most favorable entry point for us (focus on 1.3511 — a false breakout will increase interest in buying). In the current situation, the focus is on 1.359.
Best regards, R. Linda!
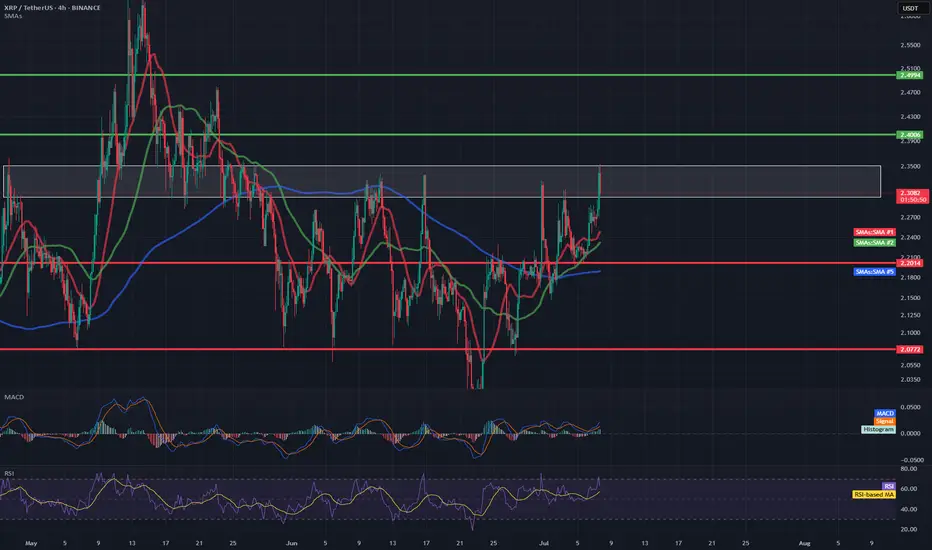
XRP/USDT 4H📊 1. Trend and moving averages
Red line (SMA 10) – short-term, currently rising, which suggests upward momentum.
Green line (SMA 20) – also in the upward trend and below the price – dynamic support.
Blue line (SMA 50/200) – probably SMA 50 or 200 – the price has broken through it from below and is currently above it – this is a pro-growth signal.
📌 Conclusion: In the short and medium term, a reversal of the trend to growth is visible.
📈 2. MACD (Moving Average Convergence Divergence)
The MACD line has crossed the signal line from below, which is a buy signal.
The MACD histogram is rising and is above zero – further confirmation of the upward trend.
📌 Conclusion: The upward momentum is increasing.
💪 3. RSI (Relative Strength Index)
RSI is currently at ~62, which means that:
We are still ahead of the overbought zone (70).
RSI is rising – it suggests bullish buyer pressure.
📌 Conclusion: There is still room for further growth before the market is overbought.
🔍 4. Market structure and resistance/support
The price is in the 2.30–2.35 USDT zone, which previously acted as resistance.
The closest resistance is around 2.38–2.40 USDT – the level from May, where the decline occurred.
The closest support is around 2.20 USDT (in line with the green SMA) and stronger at 2.05–2.10 USDT (earlier consolidations).
📌 Conclusion: Breaking 2.40 opens the way to a test of 2.50 and above.
🧠 Technical Summary
Aspect Rating
Trend (SMA) ✅ Up
MACD ✅ Buy
RSI ⚠️ Near overbought
Resistance/Support ⚠️ Resistance at 2.38–2.40
Movement Potential ✅ To 2.50 or higher
📌 Potential scenarios:
✅ Bullish (uptrend scenario)
A hold above 2.30 and a breakout of 2.40 could give an impulse for further gains towards 2.50–2.60.
Strong confirmation would be an increase in volume.
⚠️ Bearish (correction scenario)
A rejection from 2.38 and a drop below 2.20 could initiate a retest of support at 2.05 or even 1.95.