SHIB - What is Shib? I could google it but can't be asked right now; I see it referenced a bunch. Here is a 15 minute chart and it looks like it loves the fibs..
Fibs

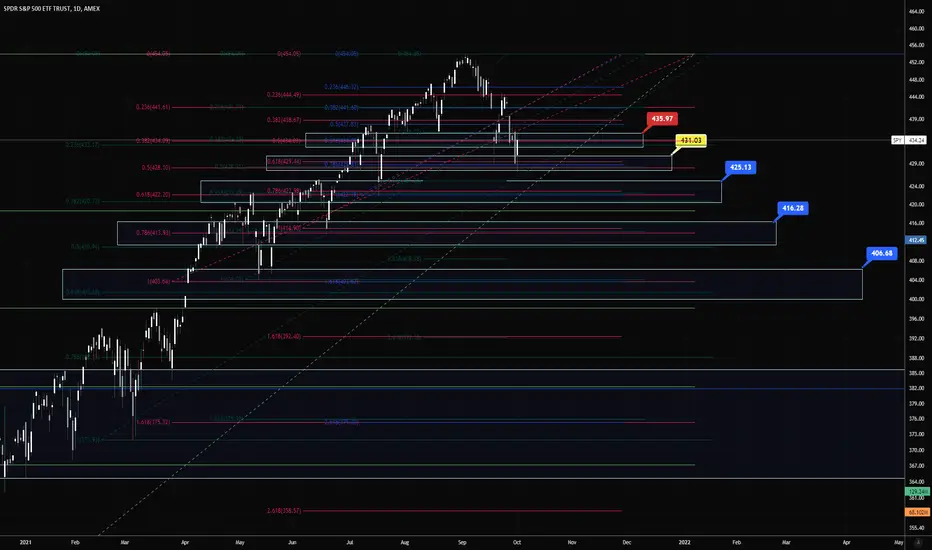
Post COVID Bull Market Fib ConfluencesSo as i was getting prepped for my weekly video i created this chart and figured i'd share. It's a fib analysis our entire posrt COVID bull market mainly focusing on major pivot lows and the top we printed a few weeks ago. The rectangles and fib confluence zones, or zones in which one could expect to find support based on the Fibonacci sequence. I mainly focused on .618 retracements as well as 1.618+ extensions. We've already found our way through one of them labeled in red, and Friday had wicked the second zone labeled in yellow. The first level was our first real support area before losing it last week. Fib wise it consisted of three .382's, a .5, and a .618. The one we're currently bouncing from consists of two .5's, one .618, and a .786. This chart is not suggesting a retest of the COVID lows, just a pure analysis of the fibs i have on the chart.
Normally i add the addition of trend based fibs and work of off the intraday timeframes as well, but for ease of use this is only fib retracements and their subsequent extensions form major pivot lows to the top printed 09/02.
Obviously this is to be used with other forms of technical analysis including volume profile and just standard price action analysis including support/resistance. More often than not you'll find that they all have a tendency to land at or near the same levels. If you're not familiar with the fiboonacci sequence or do not implement it into your day to day work cycle i highly recommend it.
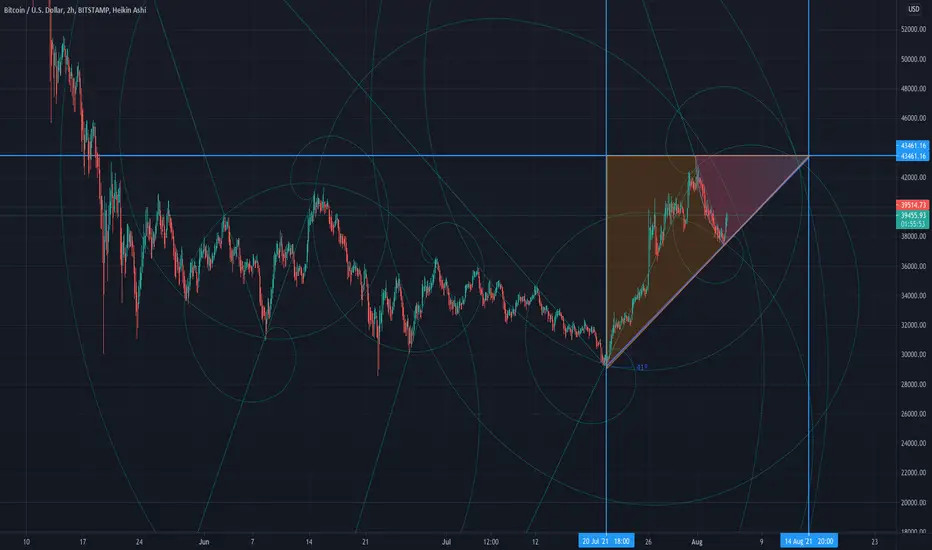
Interesting IntersectionsPlaying with with retracements and time fibs. Probably nothing, Just playing around. :)

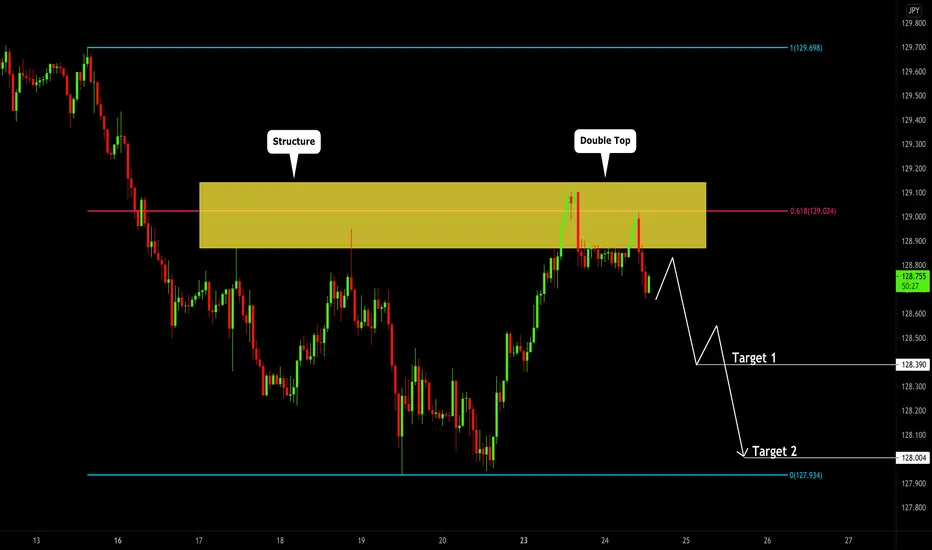
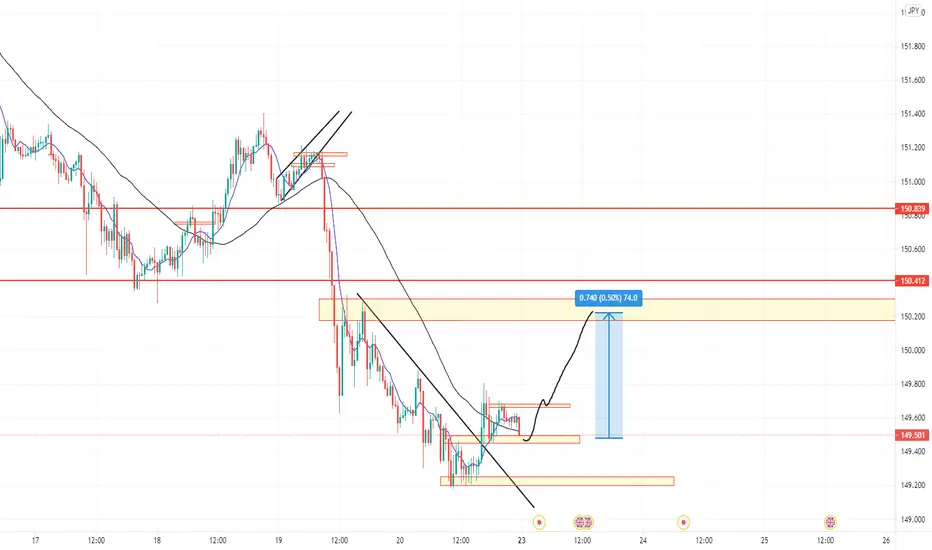
EURJPY: Looks Bearish Now! Let's Drop! 🇪🇺🇯🇵
And now I got my confirmation to short EURJPY.
Testing the intraday resistance cluster the price formed a double top formation with a lower high.
With its neckline breakout, I expect a bearish move.
Goals:
128.4
128.0
❤️Please, support this idea with a like and comment!❤️
AMD bullish falling wedgeamd looks bullish here ready to start wave 5, nvda also looks bullish and ready to rip

BTC 1hr scallop and wedge?Just another FTR chart. (for the record)
You can watch this with me throughout the day or until it breaks in either direction.
Fun!
The previous post is the video that gives it more context if you're curious.
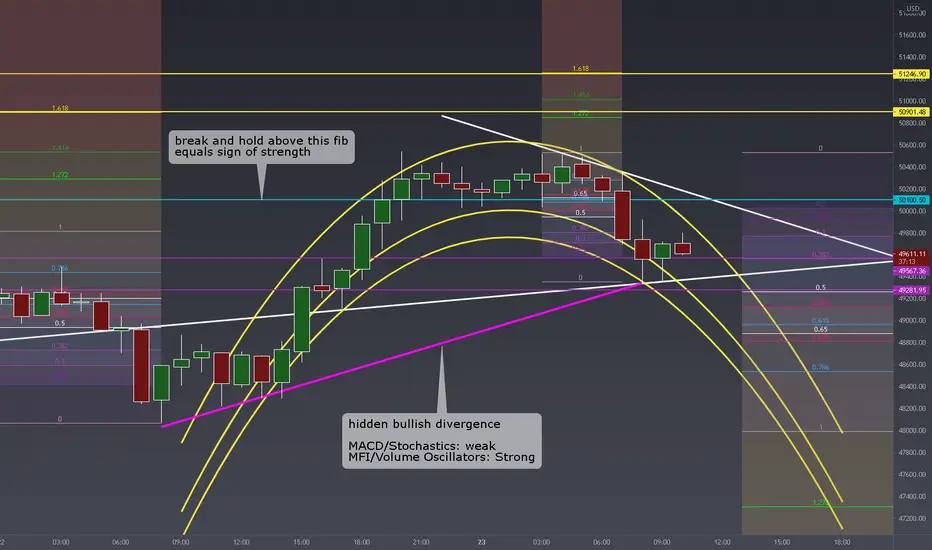
MORNING CHART REVIEW: 8/23/21Yet another potential scallop.
Seems to be a scallop and wedge with some divergences showing up on the 1hr.
If it holds true, it could take a while to break, regardless of direction.
I did find some divergences of the bullish variety, so we will see how those play out.
I will publish this chart so you can watch it at your leisure.

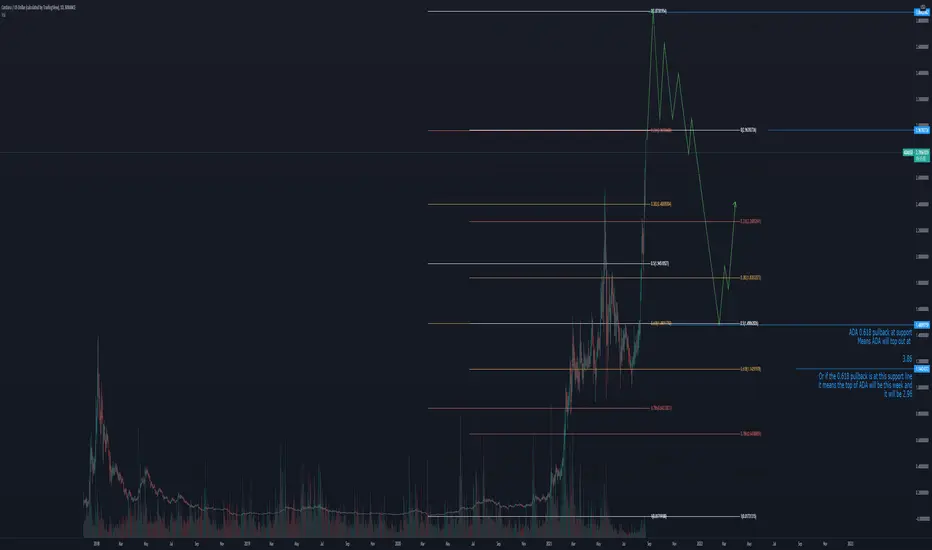
ADA will top out at 3.86By front running where a potential 0.618 fib pullback would come to on ADA we can set a target of 3.86 if the 0.618 bounce will be at the last support zone.
Pure speculation though this has worked in the past and may help to build more confluence to try and get a nice target to sell at.
The smart contracts will be a sell the news event as the demand for the token will be low compared to coins like BNB and Solana as it takes time for the humans to feel comfortable to trust a new platform that has not been battle tested live.
LATE CHART REVIEWS: 08/22/21Sorry for the late post.
I go over the current charts I am watching and what boundaries I have my eyes on.
I will try to get out the video sooner tomorrow so theres time to react to my charts.

Gold longterm trade with maximum gain rr. 1;5i am watching A BIG REVERSAL ZONE WITH 85% WINING RATE PATTERN.

gj trade idea with maximum profit RR.after weekly and daily heavy bearish trand i am expect littel uptrand as a pull up. after complete up trand with fibs level retracement. it will be continues....as a bearish trand as well.
MORNING CHART REVIEWS w/ a WARNING : 8/20/21This video goes over the charts we have been looking at on the streams.
We see a bunch of 1.618 fib targets got knocked out.
But we also see some warning signs of a pullback, and some of them are a bit creepy.
I end it with a moonshot chart just for funsies.
See you guys in tonight's stream, we'll go over whatever happens today and make some new charts. FUN!

LATE NIGHT REVIEWS: A Plethora of ChartsIn this video I just quickly go over all the charts we looked at in the stream today and a couple new ones.
Main takeaway is the bullish divergences on the daily chart, the high timeframe channels, and wedges, and the fun rounded-top/scallop chart.
Hope this was helpful, I just wanted to get these charts out without too many tangents or extra analysis that takes away from the charts observations.
Tomorrow we will do a stream where we look at these again, make changes, and then toss a bunch of indicators around.

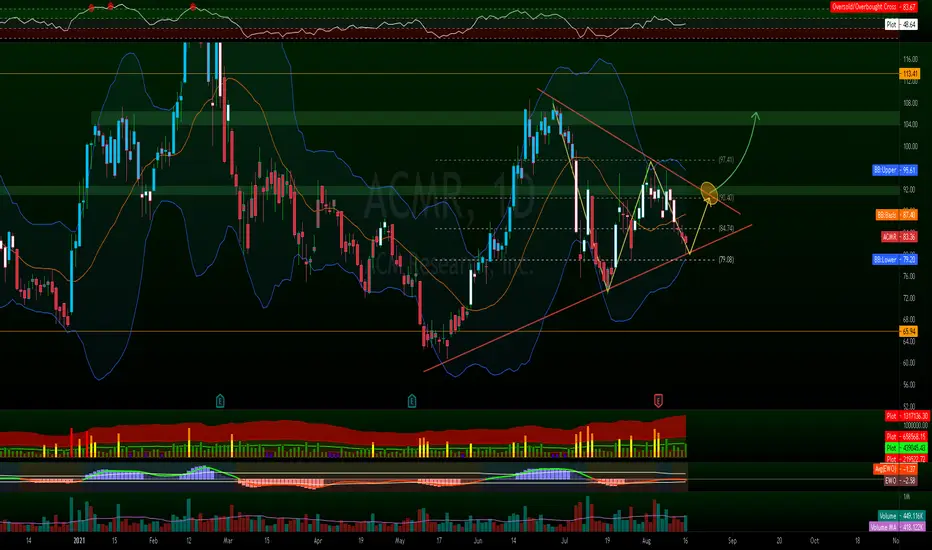
Bullish on ACMRIt seems it is bouncing perfectly from the .618Fib which coincidently matches the lower bollinger band right on the 200EMA. I mean, you have your confirmations right there, the only thing stopping it is volume from the resistance level at 91. Will it moon if it breaks that?... um doubt it since there's another wall at 104-106, however, tis will be the second attempt in a while to break it and the volume seems to be picking up!
EURGBP: Preparing For a Bearish Move 🇪🇺🇬🇧
Very important thing happened on EURGBP last week.
The price broke a year's low and set a new one confirming the predominance of bears.
After a retracement, the price is stuck within a peculiar daily supply area:
0.85 - 0.852 is our potential sell zone.
To sell with a confirmation, watch a horizontal decision range on 1H.
You need the breakout of its support (at least 1H candle close below) as your trigger to sell.
Intraday goals will be:
0.848
0.846
In case of a bullish breakout of the range,
the setup will be invalid.
❤️Please, support this idea with a like and comment!❤️
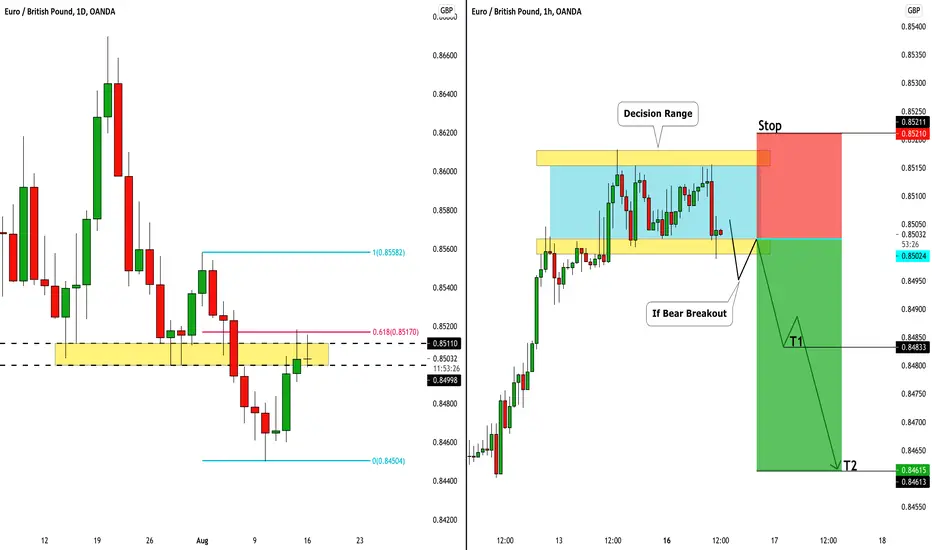
CHART REVIEW:BTC: 1 Week ChartWell, this is my weekly chart that I am watching.
20 minutes of non-stop raccoon fun!

HAPPY RACCON: CHART REVIEWS: 30 min, 1 day, 4 hrThis videos main focus is on the 30 min chart I am currently watching, as well as some observations on the daily chart and the 4hr timeframe.
Why am I happy? Because I can now stream, which means I can freestyle explain and analyze, and then consolidate and streamline that info from the stream into a summarized 20 min video idea.
I did 2 streams last night, there was some technical difficulties, but I did go over divergences, and today I should be getting around to making a well thought out 20 min video on divergences, and eliminating all the tangents I love so much.
Hope this video was helpful, thanks!

Bullish callPlaced a call and just want to see the bounce. From support @ fib level which is 27$ back up and stoped right @ 27.30 looking for the reverse back up.

SALTY RACCOON: CHART REVIEW: Daily ChartWell, this video had to be re-done as well, BUT I think I covered the most important stuff... except volume profile stuff... why? Because 20 minutes isnt enough and I forgot due to the pressure, lol.
Biggest takeaway though is to keep an eye on that daily chart developing bearish divergence.
I am going to make one more video after this, it will be a Charting Out Loud video with an emphasis on Divergence Hunting and just seeing what stands out.

CHART REVIEWS: BIG BOYS: 1day, 1week, & a couple microsThis video was my attempt to go over my larger timeframe charts of the daily and weekly BTC charts.
Sadly, 20 min never feels like enough time, the pressure to cover as much as I can in a short amount of time always makes me forget stuff, but I think I covered the big stuff.
Once TV lets me stream, I will be able to go over all the details at a much more calm pace and more thorough coverage.
The weekly doesnt require a ton of coverage as changes take forever to occur, but my daily chart is looks like pure chaos without any context.
I do go over a couple small timeframe charts in the beginning, which was a mistake in the end, but I cant make another video until later today, so this will have to do for now, lol.
Thanks!

RAMBLIN' RACCOON: Chart Reviews/Charting Out LoudSorry, this video was a bit rushed, I am on a time crunch.
I basically go over a couple charts in the beginning, multiple tangents, and then at the end some charting out loud on the 2 hr timeframe.
Takeaway, we broke a falling channel, and are potentially in a large rising channel.
Will make more videos today when IRL is less busy.
Hope some of this was helpful, cya!

MORNING CHART REVIEWS: BTCThis video just goes over my old chart that became invalidated due to my own negligence.
Biggest takeaway from this video is the large descending channel, potential wedge, and potential bullish divergence.
I will make another video today if things make some big moves.
And, I will be making a video soon to go over my daily and weekly charts as they should have their own vids because there is a lot to go over.
