FIL (SPOT)BINANCE:FILUSDT
#FIL / USDT
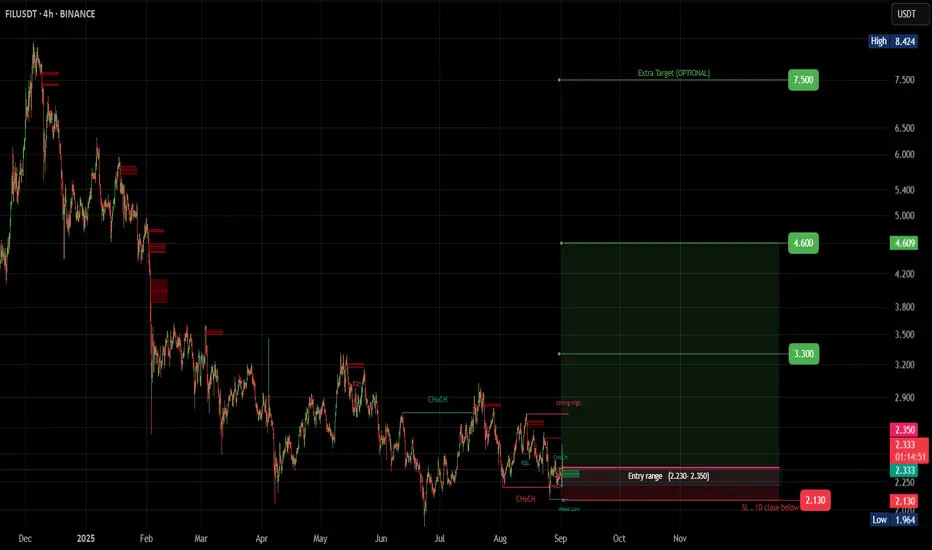
Entry range (2.230- 2.350)
SL 1D close below 2.130
T1 3.300
T2 4.600
Extra Target is optional 7.500
_______________________________________________________
Golden Advices.
********************
* collect the coin slowly in the entry range.
* Please calculate your losses before the entry.
* Do not enter any trade you find it not suitable for you.
* No FOMO - No Rush , it is a long journey.
FILUSDT
FIL/USDT — Bearish Continuation vs Potential Reversal?Currently, Filecoin (FIL) is trading at a critical decision point on the daily timeframe. The chart shows a clear descending triangle pattern, formed by a downtrend resistance line and a horizontal support zone around $1.96 – $2.28.
This pattern is typically seen as a bearish continuation, but it can also trigger a strong reversal breakout if price breaks above resistance with significant volume. In short, the market is now at a make-or-break zone — either a breakdown to new lows or a bullish breakout that could spark a strong rally.
---
🔎 Pattern Details & Key Levels
Pattern: Descending Triangle (lower highs + flat support)
Major Support Zone: $1.96 – $2.28 (strong demand zone, price has bounced multiple times)
Dynamic Resistance: descending trendline pressing since early 2025
Static Resistance Levels: $2.737 – $3.094 – $3.537 – $4.832
Psychological Levels above: $6.0 – $8.0
Measured Move Targets (triangle height):
Upside breakout = ≈ $3.51
Downside breakdown = ≈ $1.19
---
✅ Bullish Scenario
Trigger: Daily close above the descending trendline + confirmed breakout above $2.737 with strong volume.
Additional confirmation: Successful retest of trendline / $2.737 as new support.
Targets:
Short-term: $3.09
Primary measured move: $3.51
Extended targets: $3.53 – $4.83 (if momentum continues)
Upside potential: From $2.28 → $3.51 = +53.6%
---
❌ Bearish Scenario
Trigger: Daily close below $1.964 with convincing volume.
Additional confirmation: Failed retest of $1.96 as resistance.
Targets:
Primary measured move: ≈ $1.19
Psychological area: $1.00 (potential liquidity zone)
Downside risk: From $2.28 → $1.19 = -47.8%
---
📌 Conclusion
FIL/USDT is at a major crossroad.
Holding the $1.96–$2.28 support + breakout above the trendline opens the door to $3.51 and potentially $4.83.
Losing this support would confirm a bearish breakdown towards $1.19.
Best approach: Wait for daily close + volume confirmation to avoid false breakouts/breakdowns.
⚠️ Disclaimer: This analysis is for educational purposes only, not financial advice. Always apply proper risk management.
---
> FIL/USDT is now testing a decision zone with a descending triangle pattern on the daily chart.
Bullish case: Breakout above $2.737 → targets $3.09 to $3.51
Bearish case: Breakdown below $1.964 → target $1.19
$1.96 – $2.28 remains the critical support — either the last defense before a deeper drop, or the launchpad for the next rally.
🚨 Watch for daily close & volume to confirm the move!
#FIL #FILUSDT #Filecoin #Crypto #TechnicalAnalysis #DescendingTriangle #SupportResistance #Breakout #BearishScenario #BullishScenario #CryptoTrading
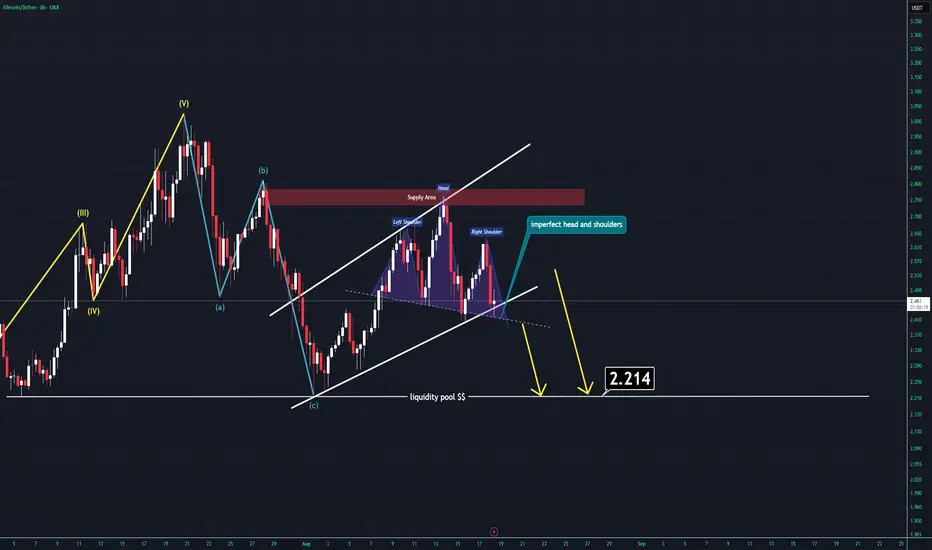
FIL ANALYSIS (8H)After hitting a major supply line, FIL has entered a corrective wave.
Similar to the other setups I shared earlier today, this one is showing very comparable price action. Currently, FIL is trading below all key moving averages (such as the 200 SMA and 50 EMA).
On top of that, an imperfect head and shoulders formation is in play. With the recent breakout, it seems likely that FIL will attempt to grab the lower liquidity pool, which sits around $2.2.
Thanks for reading.
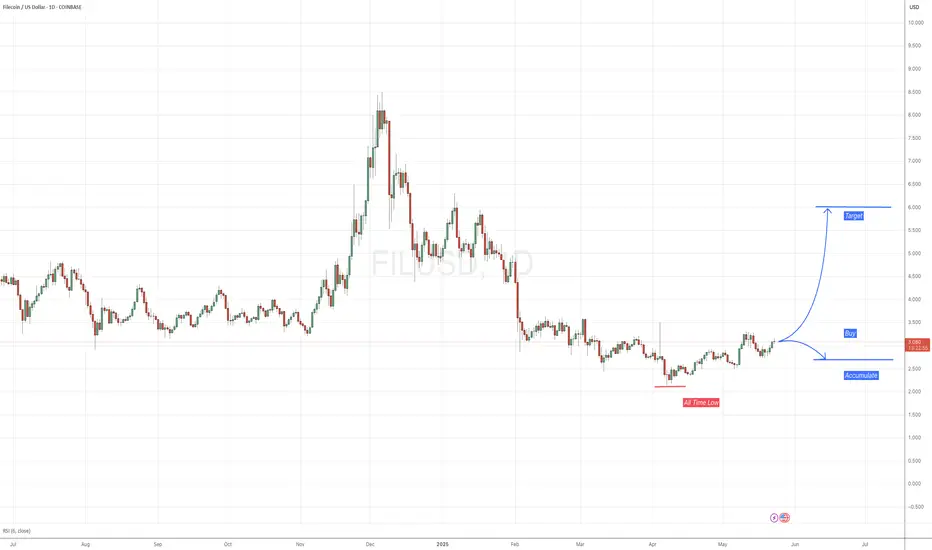
Filecoin Opportunity Buy Zone, ATL & 2025 Bull MarketThis is another all-in chart. Filecoin is looking rich. I already know that by now you understand me, you understand what I mean.
The highest volume ever continues to show up. What is happening here?
Filecoin is trading at bottom prices but volume is just so high... Who is buying this much? Why now and why at such a low price?
The all-time high buying didn't happen just recently, whale buying was also present in November 2024. Accumulation at bottom prices for sure. Smart money. Smart people. How much money are they going to extract from this bullish run? You can do it too.
EMA8 is the shortest moving average we track and FILUSDT is moving weekly above this level, just now. The next one is EMA13 and I think this one will be flipped support as well before the week ends/closes. Everything looks great.
The bottom range here was activated 10-March 2025. We are looking at true bottom prices. This is a perfect chart setup to go LONG. This would activate a very strong long-term position. With 3X, 4X or even 5X or higher, it can be life changing but, patience is key. You know how it goes... We have to wait and wait and wait but once the breakout is in and we are green with a strong position, it was worth the wait.
There is no way to trade here as there is no volatility. The only action that can be taken here is a buy. Then you can buy more. Then buy again. Accumulate. Invest. Purchase. Hold. There are no other options available. This is what makes Cryptocurrency trading easy. Buy the bottom, the market takes care of the rest.
Are there any doubts?
Crypto is going up. So many pairs are already moving strong; those trading at the bottom are set to catch up. New all-time highs all across. The best is yet to come.
Thank you for reading... It will get better, I promise.
Namaste.
FILUSDTBINANCE:FILUSDT is deep corrections from latest bull-trend.
Bets support's in 1.90 to 2.150 $ and resistance's 2.50 and 2.80 $.
Please control risk management.

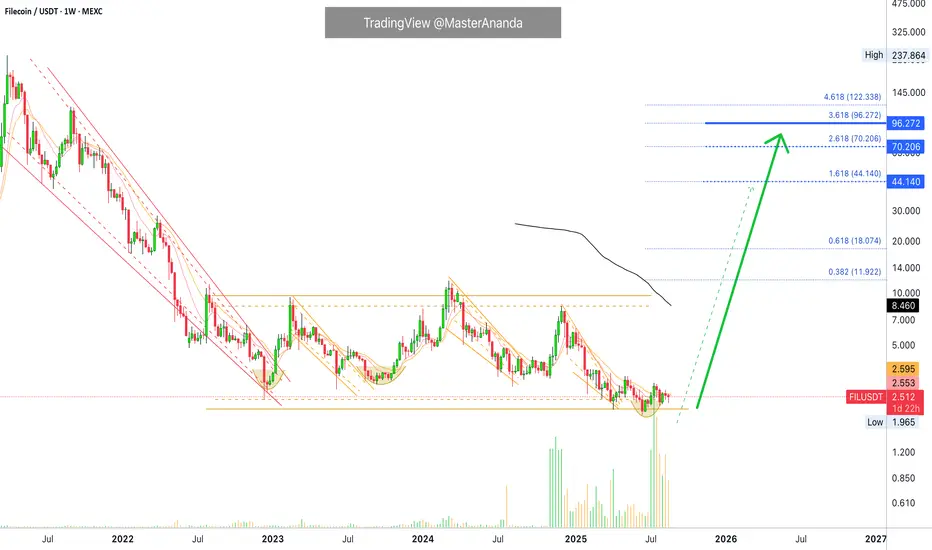
Filecoin Hits Bottom · 3 Years Long BD · Volume Signal · MACD &I think what is really nice about MEXC is that it truly reveals the bottom through volume. The changes in trading volume in this exchange are so pronounced that you can never go wrong. Look at Filecoin, extremely high volume in November 2024, right before a bullish wave. Then again, incredibly high volume last week, July 2025, right before a... Right before a major, major bullish wave, or else trading volume wouldn't be so high. It is this high because whales are buying with margin on this exchange.
Ok. A classic signal, 100% original. MA200 starts curving down strong; prices start to move up to meet this indicator, there will be a cross. So when MA200 starts diving deep down coming from a high point, the low is in, the bottom is in and the trend is about to change from bearish to bullish. Filecoin is about to start growing.
These are two signals, both very strong. Let's add another one. Bullish divergence with the MACD and RSI. Weekly, long-term. This makes these signals very, very strong.
FILUSDT weekly RSI hit bottom June 2022, in June 2025 (three years later) it produced a higher low.
FILUSDT weekly produced a major low December 2022, in June 2025 it produced a lower low. That's a strong divergence.
FILUSDT weekly MACD hit bottom February 2022. There is a extreme higher low in 2025 and also a bullish cross.
Needless to say, the bullish cross indicates the market is about to change. This matches the volume signal, the MA200 signal, marketwide action, the bullish divergence with the RSI, Ethereum and the rest.
Everything is bullish if you look deep enough. Bullish means potential for growth when prices are low. Bullish potential. That's what we are looking for. Filecoin is about to turn-up.
Namaste.
FIL Secondary trend. Channel zone. 31 03 2025Logarithm. Time frame 3 days (less is not needed).
Main trend. Time frame 1 week.
Published more than 2 years ago 22 01 2023
FIL/USD Main trend. From the maximum of $237 -99%
In the specified range, a horizontal channel with a large % step (exactly 370%) was formed earlier (2.590 - 7.157/10.7). There have already been 3 pumping waves in this channel. From the pumping highs in the main trend, the price fell by -98.98%
Secondary trend . This horizontal channel with a step of 370% and work with trend reversal formations.
Local trend , zone of formation of a descending wedge, zone of capitulation and trend reversal.
FIL/USDT Local trend. Wedge. Price clamping . 30 06 2024
Working now with the forming descending wedge and trend reversal in case of its breakthrough.
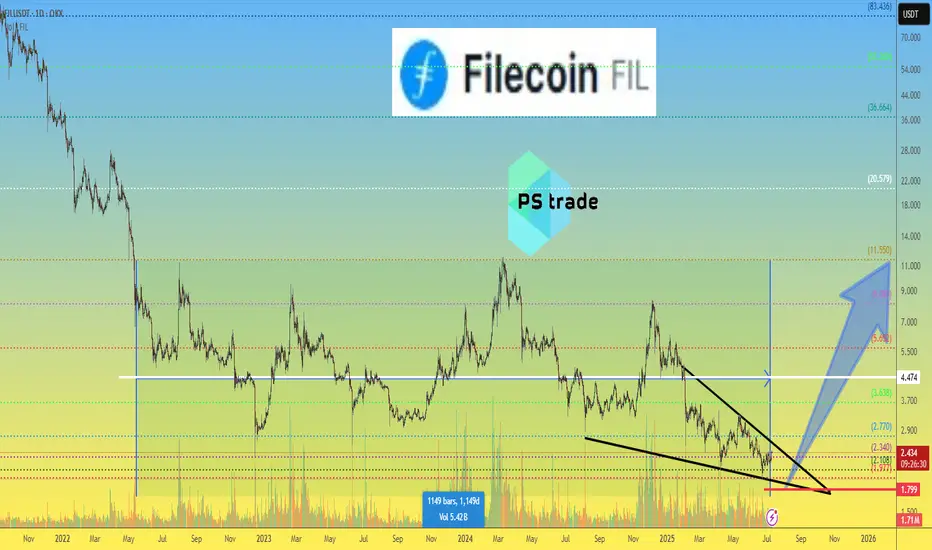
Filecoin FIL price analysis🪙 It would seem that #Filecoin is a “dinosaur” of the crypto market, having survived so many different cycles and “shocks,” whose fundamentals should only increase the annual application of the project, but no... it's not happening...
Looking at the OKX:FILUSDT chart, we see that the accumulation phase in the $2-11.50 range has been going on for over 1150 days, which means that another +/- 30-60 days of correction will not make a significant difference.
What can we say: we wish the holders patience and hope they wait for their moment of glory together with #FIL
🙂 And for those who want to test their luck and try to jump on the “last train” — place a “bucket” at $1.80 (any lower than that would be indecent)
Of course, if you believe that the price of #FILUSD will still be able to grow to at least $4.50 this year, and ideally to $11.50.
_____________________
Did you like our analysis? Leave a comment, like, and follow to get more
Bullish Sign FIL / USDTBreak and retest high and make a new higher low also there is a fake breakout on Weekly
Target : 3
Stop : 2.36
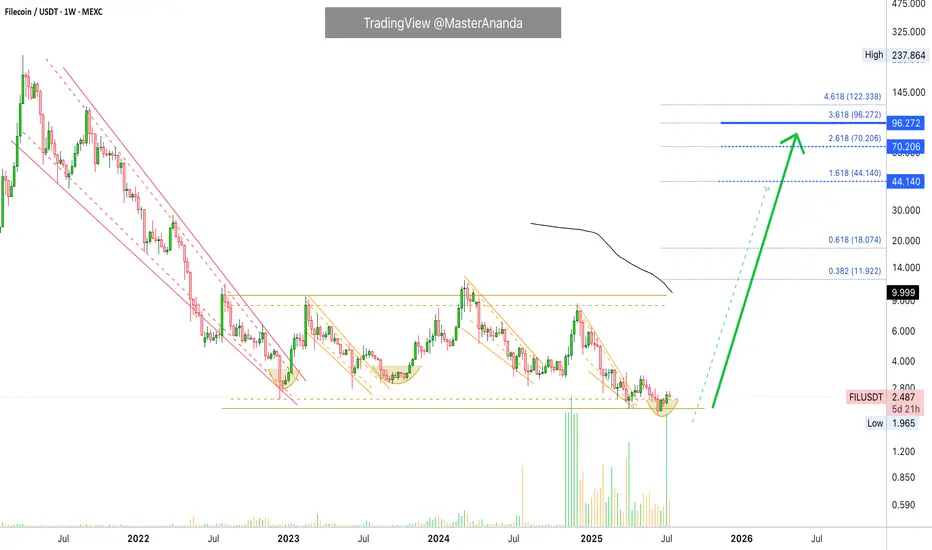
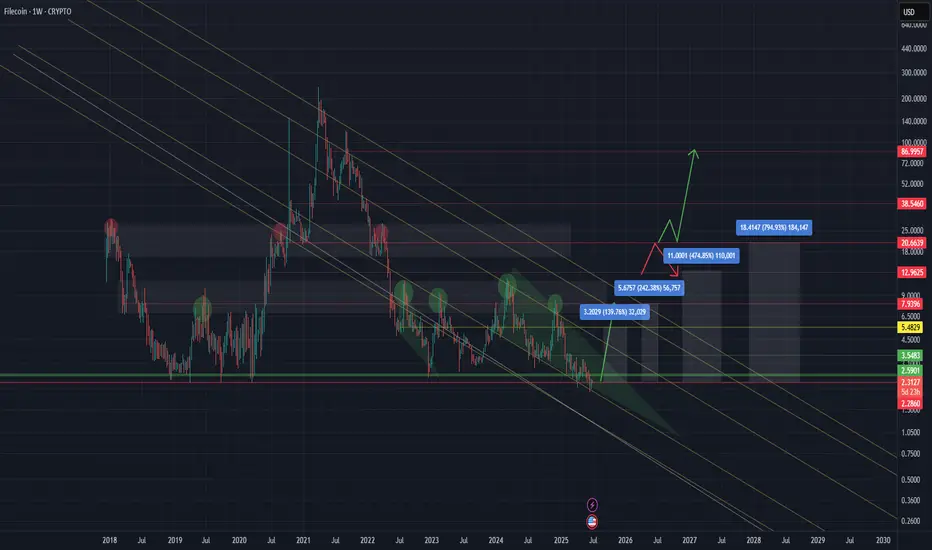
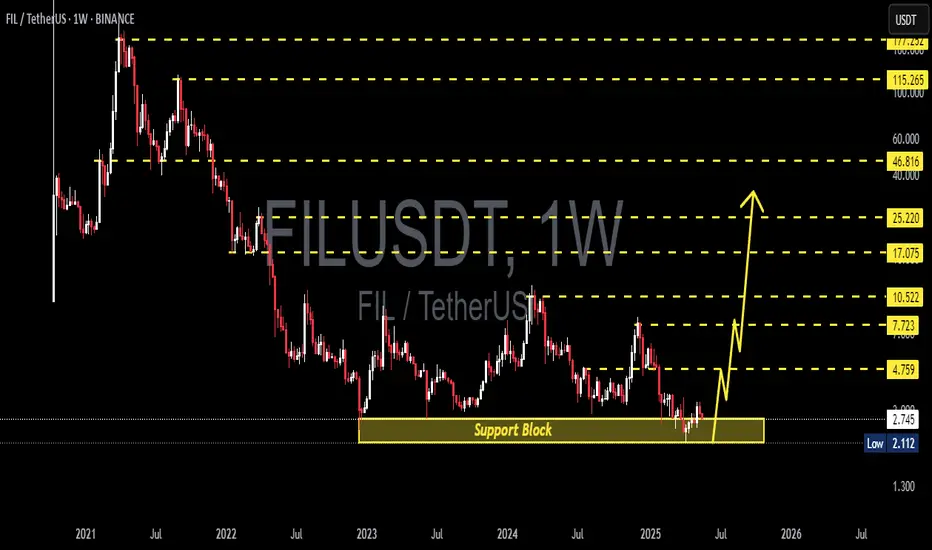
FIL/USDT 1W$5.48 is an almost guaranteed target — it has been reached every single time.
What happens next depends entirely on the strength of the trend.
If we break out above the triangle and hold above it, there’s a real shot at $20.
And if that level gets broken and confirmed — then we might even see a retest of previous ATH.
But those are already "moon targets", and by that point, it’ll be smart to secure profits and just let the rest ride — and see what happens. 🚀
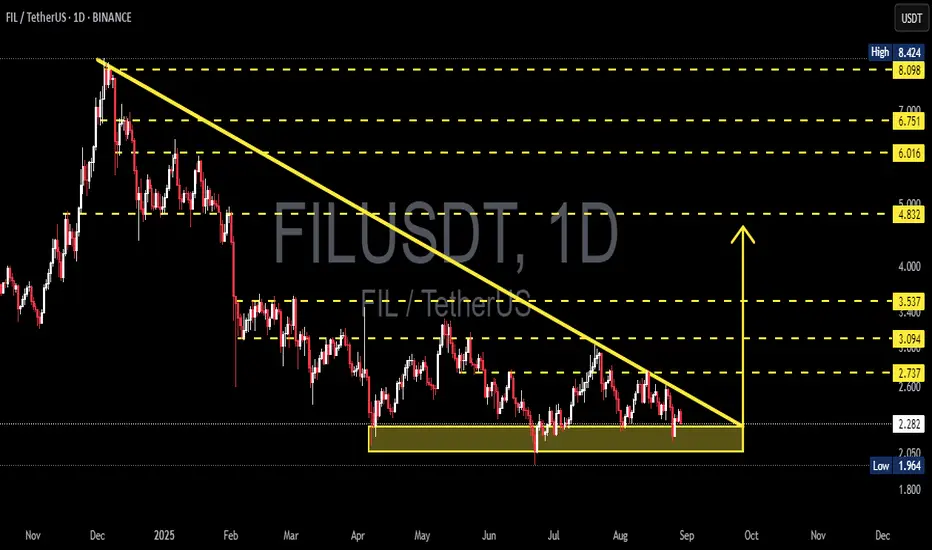
FIL/USDT – Major Trendline Breakout Imminent?The FIL/USDT chart is showcasing a significant descending trendline that has been respected since its peak in late December 2024. Price action has recently approached this trendline again, and a potential breakout scenario is forming. This setup may signal a major shift in trend after months of persistent decline.
🔍 Technical Analysis:
Trendline Resistance:
The long-term descending yellow trendline has capped every bullish rally since early 2025. A breakout above this trendline would be a major bullish technical signal.
Support Level:
Key horizontal support has been held at around $1.96, which has formed a strong base.
Potential Breakout Projection:
Upon breakout, $2.746 is the first resistance to watch.
A successful retest of this level could lead to a stair-step rally targeting:
$3.222
$3.537
$4.803
$5.863
$6.758
And potentially $8.069–$8.425 if momentum continues.
Bullish Pattern:
The projected move shows a potential impulse wave pattern following the breakout, indicating staged profit-taking zones for traders.
🧠 Strategic Consideration:
A daily candle close above the trendline with volume confirmation would be the first sign of trend reversal.
Conservative traders may wait for a retest of the trendline as support before entering.
Targets can be approached progressively based on price action near each resistance level.
⚠️ Risk Management:
Watch for fakeouts near the trendline.
A break below the key support of $1.96 would invalidate the bullish thesis.

FILUSDT 1D AnalysisFIL ~ 1D Analysis
#FIL This is the lowest support for now. Buy if you still have confidence in this coin with a short term target of at least 20%+ from this support.

Spot signalHello friends
As the price reaches the specified support level and buyers enter, you can see that higher ceilings have formed and you can take advantage of this opportunity and now buy with capital and risk management and move towards the specified goals.
*Trade safely with us*

FILECOIN - A less risky bet to make $$$FILUSD shows to be a good bet for the below reasons.
a. All time low reached on 07th Apr 2025 and will support the price.
b. Started showing Higher High and Higher Low on daily charts.
c. It is still the #1 decentralised storage network.
d. A huge potential for upside movement with current marketcap of $2B when compared to $12B at all time high.
e. Organisation adoption is significant. For example - The Internet Archive, a non-profit digital library, uses Filecoin for archival data storage (1000TiB). OpenSea, an NFT marketplace, uses it for NFT storage. Shoah project Starling Labs, an academic research lab, uses it for archival data (6000TiB)
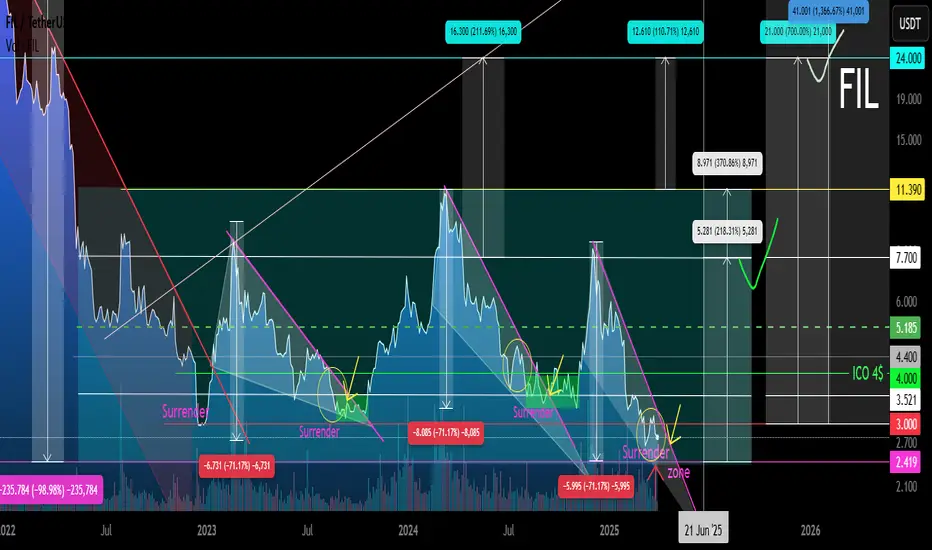
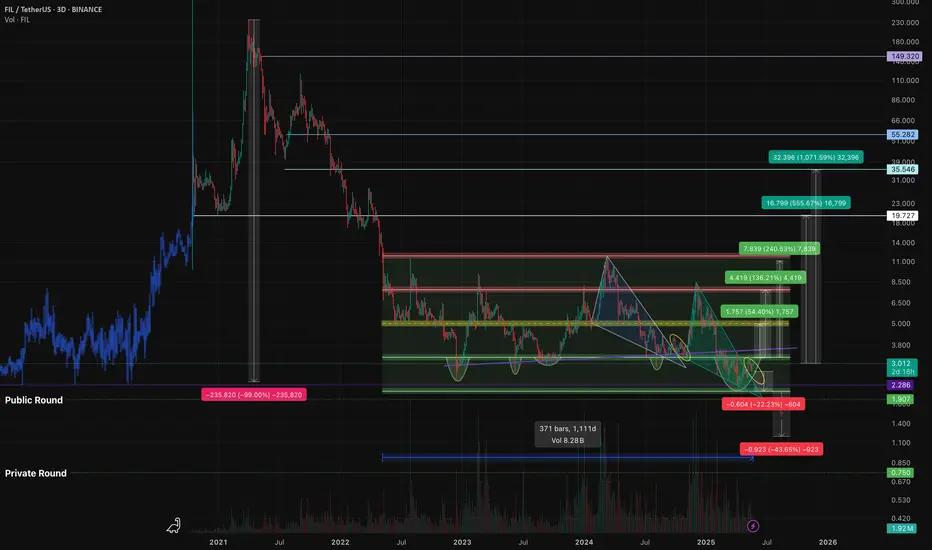
FILUSDT — the formation is repeating, the structure is familiar.Filecoin(FIL) - is a decentralized storage system with the goal of "storing humanity's most important information." During its initial coin offering (ICO) in 2017, the project raised $205 million. The launch was initially planned for mid-2019, but the mainnet launch date was postponed until block 148,888, which occurred on October 15, 2020.
📍 CoinMarketCap : #50
📍 Twitter(X) : 667.3K
🔍 What I observe:
I’ve added the full trading history to the chart for better understanding (the chart on exchanges is cut off). The coin is liquid. I also added the prices for the public and private offerings.
There’s a large horizontal channel, or more specifically, a channel within a channel, which has been active for about 1111 days.
After another drop, a descending wedge formed, and now we are witnessing a breakout of its resistance (a retest is possible).
These patterns are ones I regularly track and trade, based on personal experience accumulated over the years and my strategy.
📊 I’ve plotted the nearest resistances and target prices with movement percentage calculations.
💭 It’s quite possible that this formation in the lower part of the wedge, coinciding with the area of lows on the support of the outer channel, was used to gather liquidity and shake out weak hands.
I also want to point out the large wicks in this zone - a characteristic pattern for accumulation points and subsequent reversals.
______
📌 Not financial advice. Observing structure and recurring phases.
Operate within your strategy and with an awareness of risks.
FILUSDT 1D Analysis FIL ~ 1D Analysis
#FIL Buy gradually from here if you still have confidence in this coin with a short term target of at least 15%+ from here.

FILUSDT 1W AnalysisFIL ~ 1W Analysis
#FIL Buy gradually from here if you still have confidence in this coin with a short term target of at least 20%+ from here.
Filecoin - Still in accumulationHello everyone, as you know if you follow me, one of the coins I’ve been accumulating for years is FIL. From both a technical and fundamental analysis perspective, I believe it’s the bet with the absolute highest potential in the crypto world. Speaking of my analysis, as you can see, we’re still in an accumulation phase for about 2-3 years now, with a range between $2.3 and $7-10. In recent weeks, we’ve seen a retest of the all-time low, and right now it’s testing the lowest monthly close of the previous cycle. That said, I expect a fairly rapid rise toward $7 soon, with the possibility that it finally breaks out of the range and starts running toward the previous ATH at $230. In any case, the risk/reward is truly excellent, probably the best in the entire crypto market. Thanks to everyone for your attention, and I hope the video is helpful for your analyses.

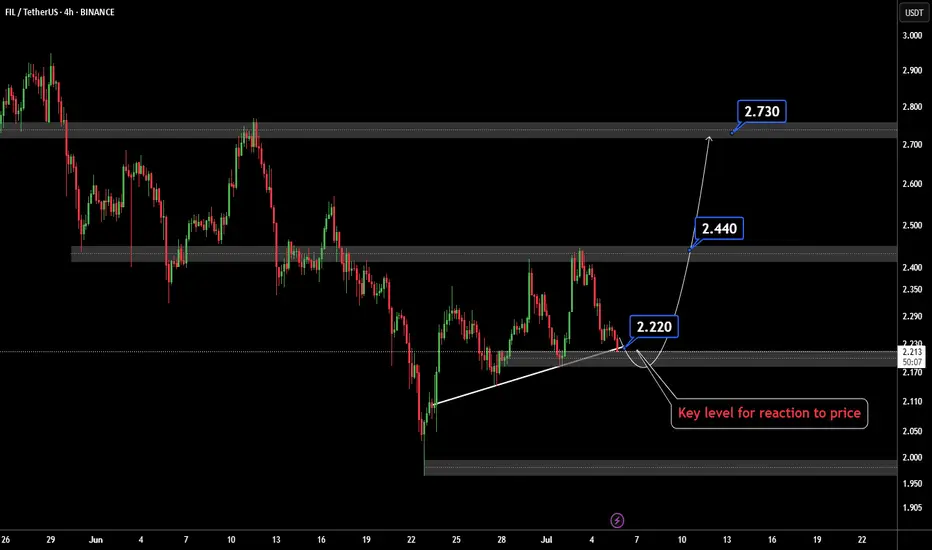
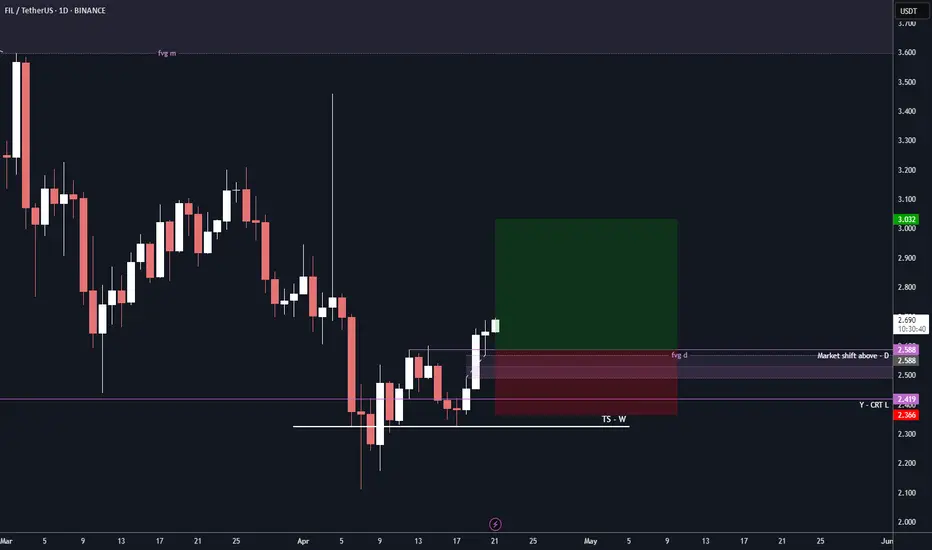
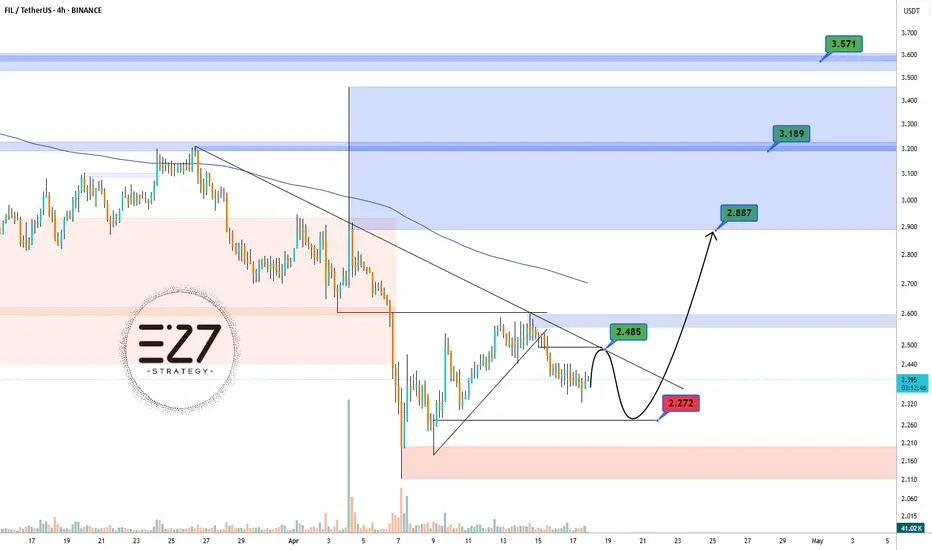
FILUSDTFIL is showing signs of a potential trend reversal 📊
Price has formed a higher low and is now approaching the key resistance at 2.485 USDT. A breakout above this level could open the way toward the next major zones around 2.887 and even 3.189 USDT 🚀
However, if rejection occurs, we might see a pullback toward the 2.272 USDT support area 🔁
Currently, momentum is leaning bullish and favoring a move higher, especially if the descending trendline gets broken with strength 💪
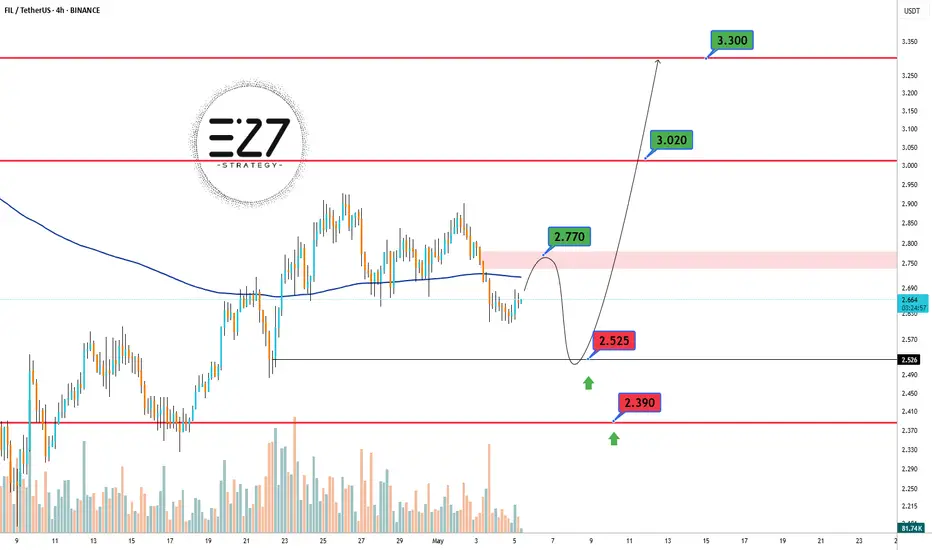
FIL bull-pollbakThe Filecoin ( BINANCE:FILUSDT ) chart, after a correction to $2.65, is attempting to pull back to the broken level around $2.77. If it fails to break this resistance, another decline towards support levels at $2.525 and then $2.39 is likely, which could act as a potential starting point for a new upward movement towards targets at $3.02 and $3.30.
🔑 Key Zones on the FIL Chart:
Primary Resistance: $2.77 (Pullback to broken level)
First Support: $2.525
Second Support: $2.39
First Bullish Target: $3.02
Second Bullish Target: $3.30
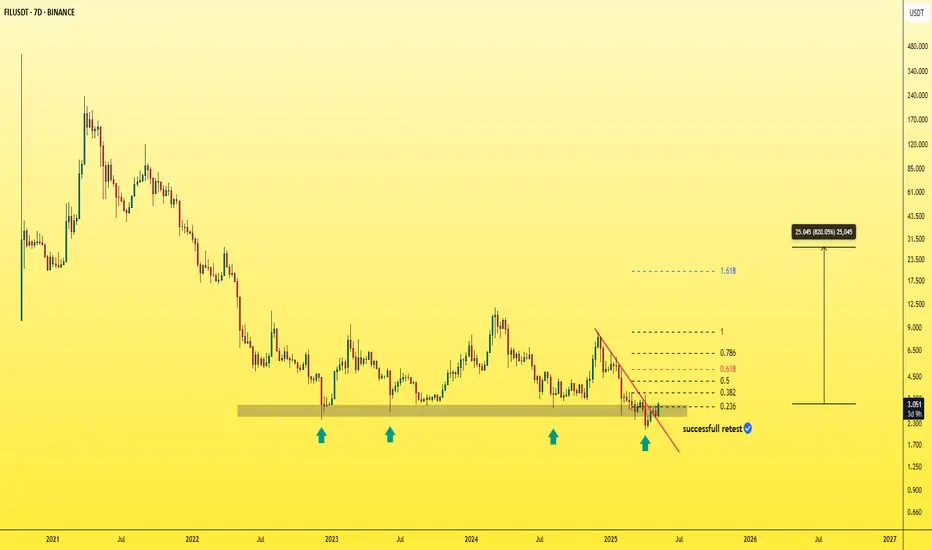
#FILUSDT - bottomed out!On the weekly timeframe, the downward trendline has been broken and successfully retested.
A strong move upward is just a matter of time…
Notice how it bounces hard every time it touches the support zone marked by the grey rectangle — this has happened three times in a row.
Also, FIL has been in an accumulation phase for around 1,092 days — that’s nearly 3 years.
$28 is a target I'm fully confident in for this coin.
Best Regards Cecilion🎯
FILUSDT Potential UpsidesHey Traders, in today's trading session we are monitoring FILUSDT for a buying opportunity around 2.60 zone, FILUSDT is trading in an uptrend and currently is in a correction phase in which it is approaching the trend at 2.60 support and resistance area.
Trade safe, Joe.
