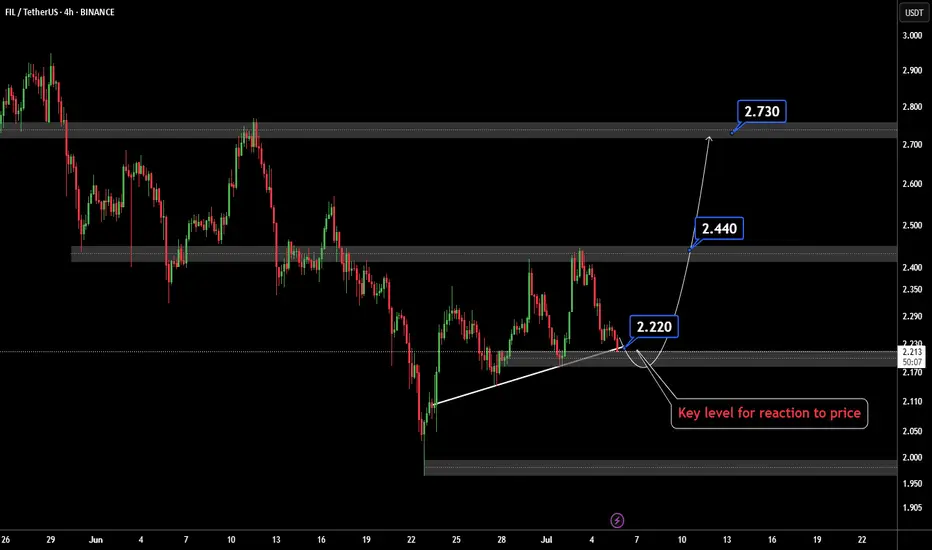
FILUSDTBINANCE:FILUSDT is deep corrections from latest bull-trend.
Bets support's in 1.90 to 2.150 $ and resistance's 2.50 and 2.80 $.
Please control risk management.
Filusdtlong

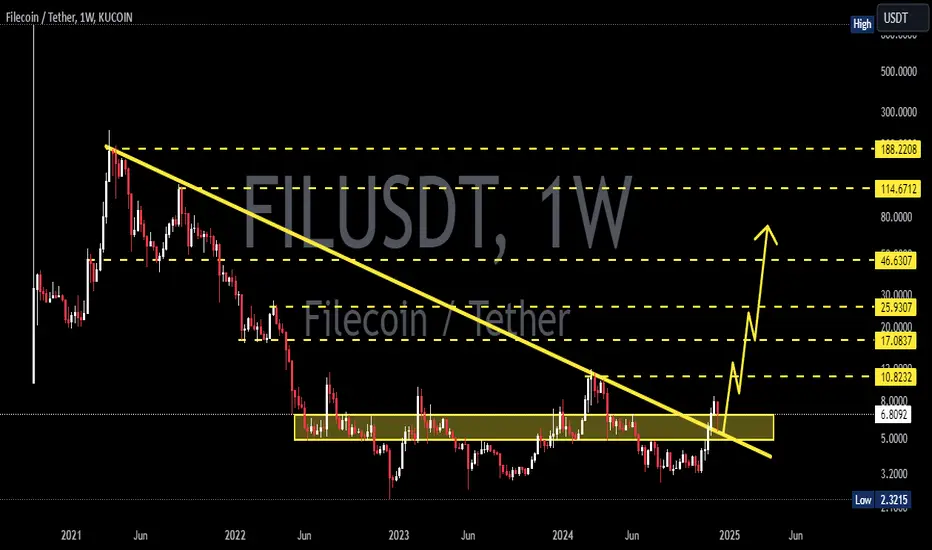
FIL/USDT – Major Trendline Breakout Imminent?The FIL/USDT chart is showcasing a significant descending trendline that has been respected since its peak in late December 2024. Price action has recently approached this trendline again, and a potential breakout scenario is forming. This setup may signal a major shift in trend after months of persistent decline.
🔍 Technical Analysis:
Trendline Resistance:
The long-term descending yellow trendline has capped every bullish rally since early 2025. A breakout above this trendline would be a major bullish technical signal.
Support Level:
Key horizontal support has been held at around $1.96, which has formed a strong base.
Potential Breakout Projection:
Upon breakout, $2.746 is the first resistance to watch.
A successful retest of this level could lead to a stair-step rally targeting:
$3.222
$3.537
$4.803
$5.863
$6.758
And potentially $8.069–$8.425 if momentum continues.
Bullish Pattern:
The projected move shows a potential impulse wave pattern following the breakout, indicating staged profit-taking zones for traders.
🧠 Strategic Consideration:
A daily candle close above the trendline with volume confirmation would be the first sign of trend reversal.
Conservative traders may wait for a retest of the trendline as support before entering.
Targets can be approached progressively based on price action near each resistance level.
⚠️ Risk Management:
Watch for fakeouts near the trendline.
A break below the key support of $1.96 would invalidate the bullish thesis.

FILUSDT 1D AnalysisFIL ~ 1D Analysis
#FIL This is the lowest support for now. Buy if you still have confidence in this coin with a short term target of at least 20%+ from this support.

Spot signalHello friends
As the price reaches the specified support level and buyers enter, you can see that higher ceilings have formed and you can take advantage of this opportunity and now buy with capital and risk management and move towards the specified goals.
*Trade safely with us*

FILUSDT 1D Analysis FIL ~ 1D Analysis
#FIL Buy gradually from here if you still have confidence in this coin with a short term target of at least 15%+ from here.

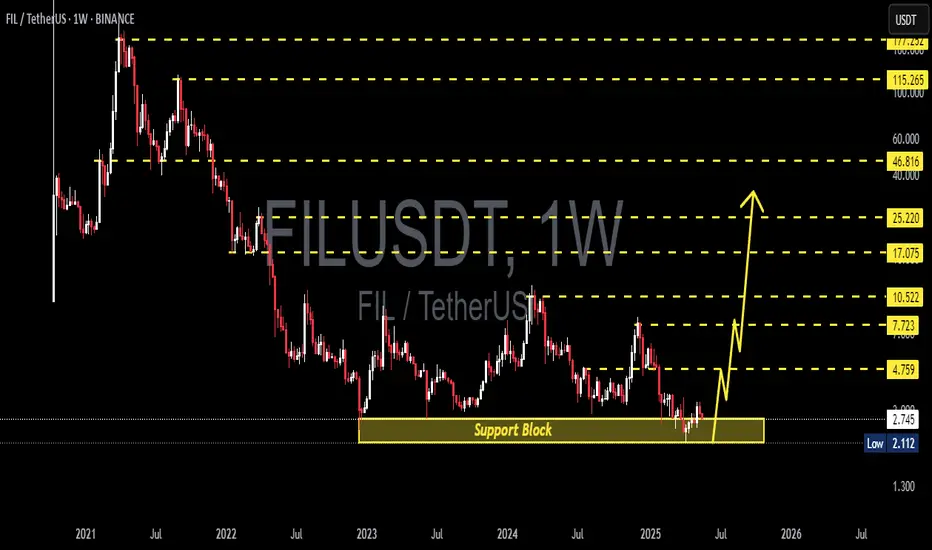
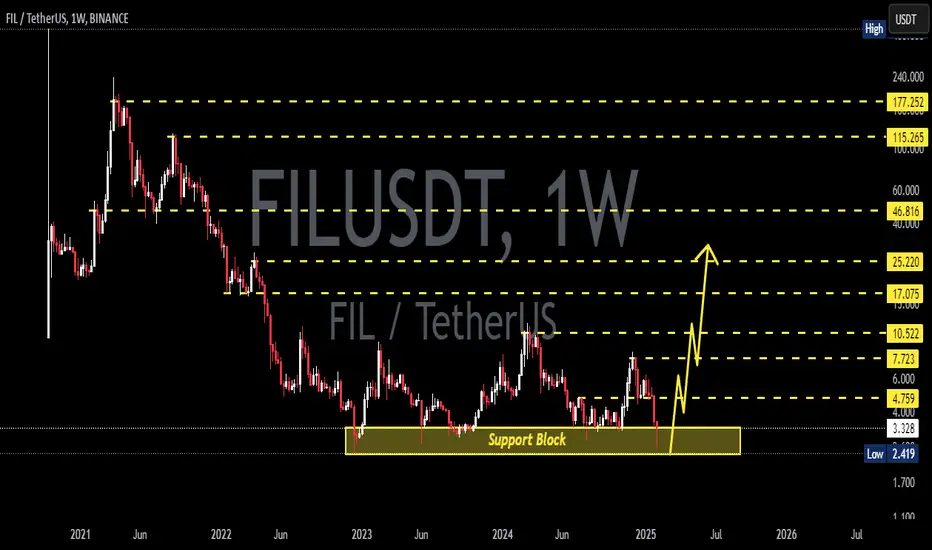
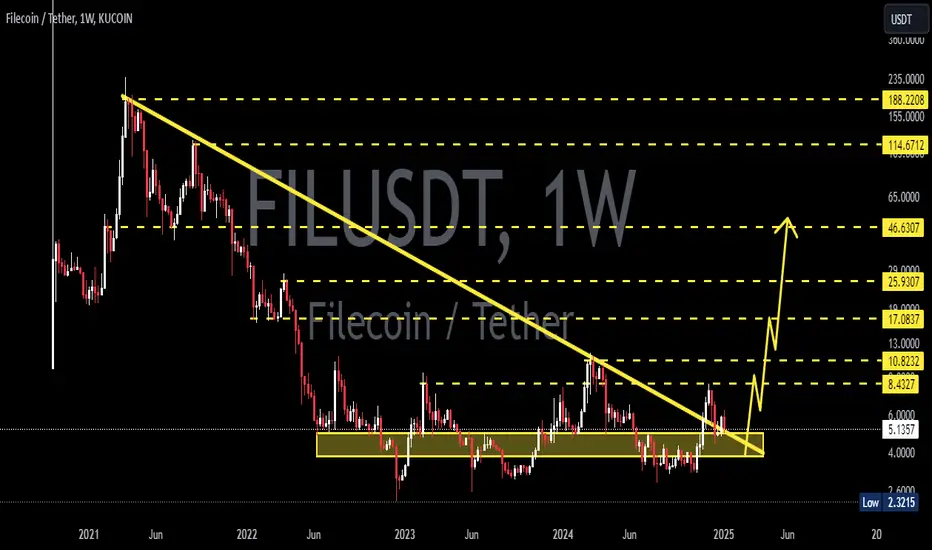
FILUSDT 1W AnalysisFIL ~ 1W Analysis
#FIL Buy gradually from here if you still have confidence in this coin with a short term target of at least 20%+ from here.
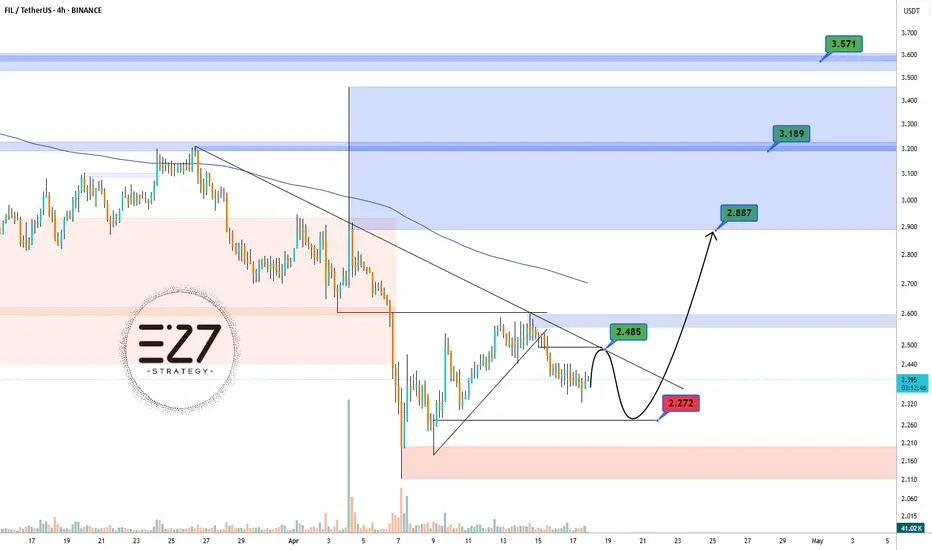
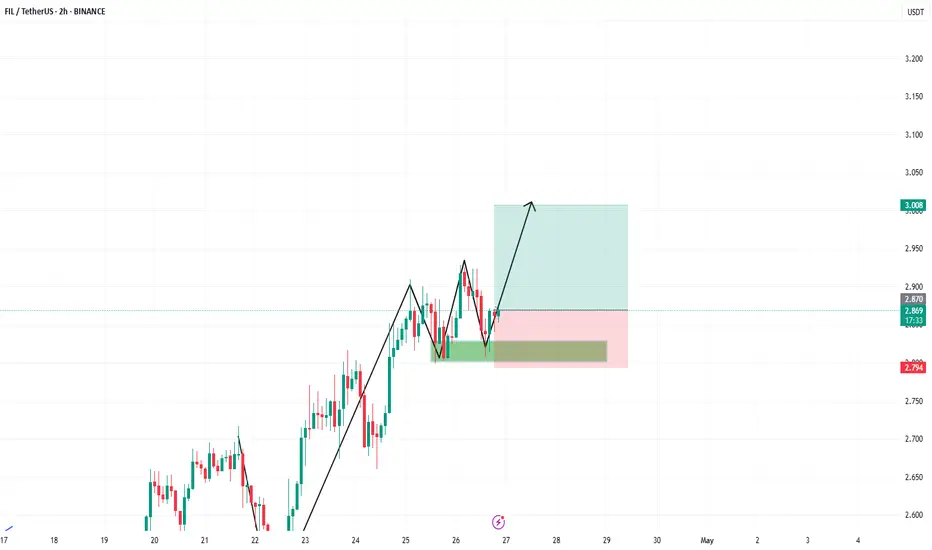
FILUSDTFIL is showing signs of a potential trend reversal 📊
Price has formed a higher low and is now approaching the key resistance at 2.485 USDT. A breakout above this level could open the way toward the next major zones around 2.887 and even 3.189 USDT 🚀
However, if rejection occurs, we might see a pullback toward the 2.272 USDT support area 🔁
Currently, momentum is leaning bullish and favoring a move higher, especially if the descending trendline gets broken with strength 💪
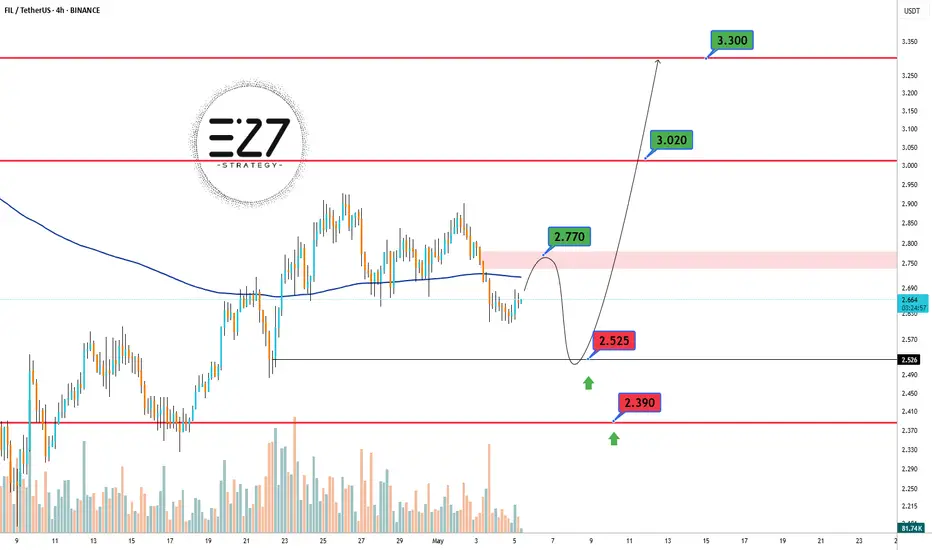
FIL bull-pollbakThe Filecoin ( BINANCE:FILUSDT ) chart, after a correction to $2.65, is attempting to pull back to the broken level around $2.77. If it fails to break this resistance, another decline towards support levels at $2.525 and then $2.39 is likely, which could act as a potential starting point for a new upward movement towards targets at $3.02 and $3.30.
🔑 Key Zones on the FIL Chart:
Primary Resistance: $2.77 (Pullback to broken level)
First Support: $2.525
Second Support: $2.39
First Bullish Target: $3.02
Second Bullish Target: $3.30
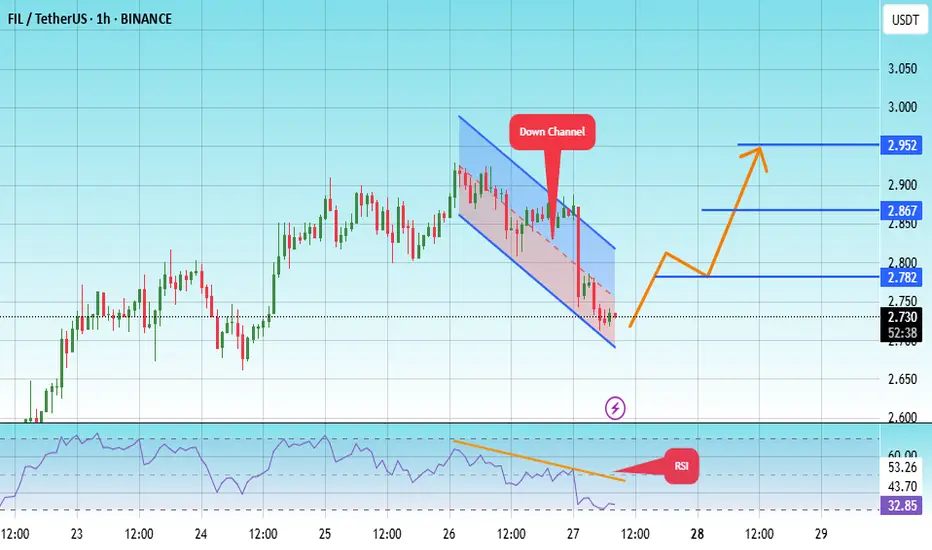
#FIL/USDT#FIL
The price is moving within a descending channel on the 1-hour frame, adhering well to it, and is heading towards a strong breakout and retest.
We are seeing a bounce from the lower boundary of the descending channel, which is support at 2.68.
We have a downtrend on the RSI indicator that is about to be broken and retested, which supports the upward trend.
We are looking for stability above the 100 moving average.
Entry price: 2.73
First target: 2.78
Second target: 2.86
Third target: 2.95
FILUSDT LONG/SHORTBy utilizing Fibonacci retracement levels, historical patterns, , we can formulate a hypothesis that the market might follow a similar trajectory if bullish sentiment prevails.
FILUSDT 1D AnalysisFIL ~ 1D Analysis
#FIL Buy after successfully penetrating this resistant line with a short -term target of at least 10%+ from here.

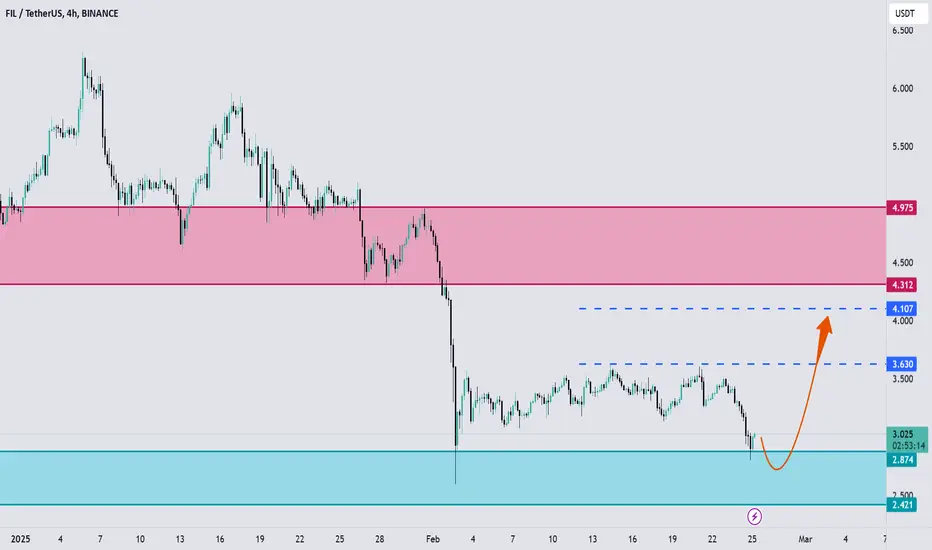
FILECOIN, Will we see 4$ again ?Hello Traders, Hope you are doing great.
After a downward movement that happened yesterday, now price is trying to find support around this level, so for upcoming days I expect an upward correction to specified blue Dashed lines.
Don't forget to use proper risk management .
Tell me What are your thoughts about FILECOIN ? UP or DOWN ? comment your opinion below this post.
FIL short-down FILUSDT Signal
🔹 Key Resistance Level: $3.35 – $3.50
🔹 Important Support Levels: $3.148 – $2.940 – $2.738
Analysis:
FIL price has been moving in an uptrend within a rising wedge pattern and has now reached the key resistance zone of $3.35 – $3.50. If this level is broken, followed by confirmation with a pullback, the uptrend is likely to continue. However, failure to break this resistance could lead to a price correction toward the mentioned support levels.
📌 Trading Strategy:
✅ Sell Entry after breaking the uptrend and confirming below $3.148
🎯 Targets: $2.940 – $2.738
🛑 Stop Loss: $3.30
⚠ Important Note: Risk management should not be ignored!

FILUSDT 1WFIL ~ 1W Analysis
#FIL This is the lowest support for now.Buy from here if you still have a Conviction on this Coin with a target of 20%+
FILUSDT 1WFIL Update ~ 1W
#FIL still in a bullish trend. If you still have Conviction on this coin,. Buy gradually on this support block. with a minimum target of 20%++
#FIL/USDT#FIL
The price is moving in a descending channel on the 1-hour frame and is expected to continue upwards
We have a trend to stabilize above the moving average 100 again
We have a descending trend on the RSI indicator that supports the rise by breaking it upwards
We have a support area at the lower limit of the channel at a price of 5.80
Entry price 6.02
First target 6.15
Second target 6.34
Third target 6.60
#FIL/USDT Ready to go higher#FIL
The price is moving in a descending channel on the 1-hour frame and sticking to it well
We have a bounce from the lower limit of the descending channel, this support is at 4.70
We have a downtrend on the RSI indicator that is about to be broken, which supports the rise
We have a trend to stabilize above the moving average 100
Entry price 4.87
First target 5.22
Second target 5.49
Third target 5.82

FILUSDT 1WFIL Update ~ 1W
#FIL still in a bullish trend. If you still have Conviction on this coin,. Buy gradually on this support block. with a minimum target of 20%++
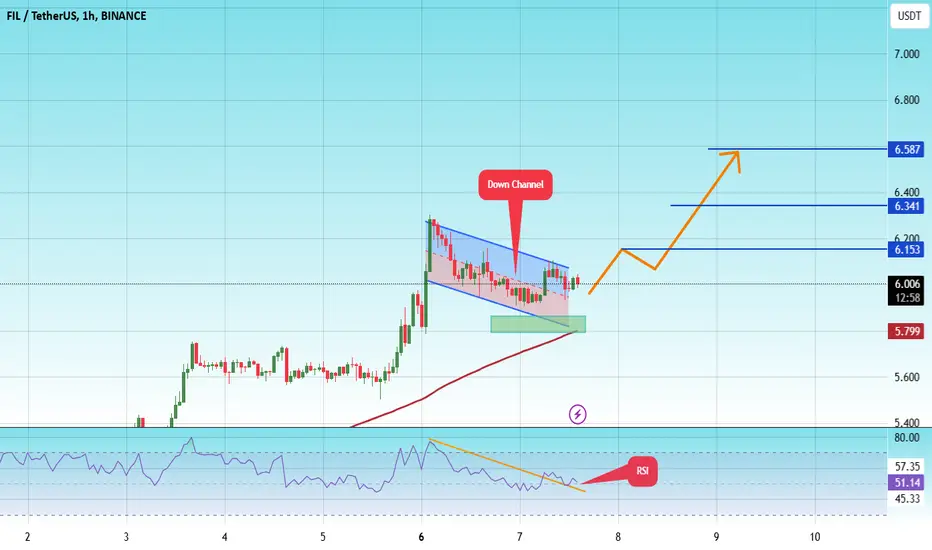
#FIL/USDT Ready to go higher#FIL
The price is moving in a descending channel on the 1-hour frame and sticking to it well
We have a bounce from the lower limit of the descending channel, this support is at 5.80
We have a downtrend on the RSI indicator that is about to be broken, which supports the rise
We have a trend to stabilize above the moving average 100
Entry price 6.81
First target 7.20
Second target 7.84
Third target 8.40
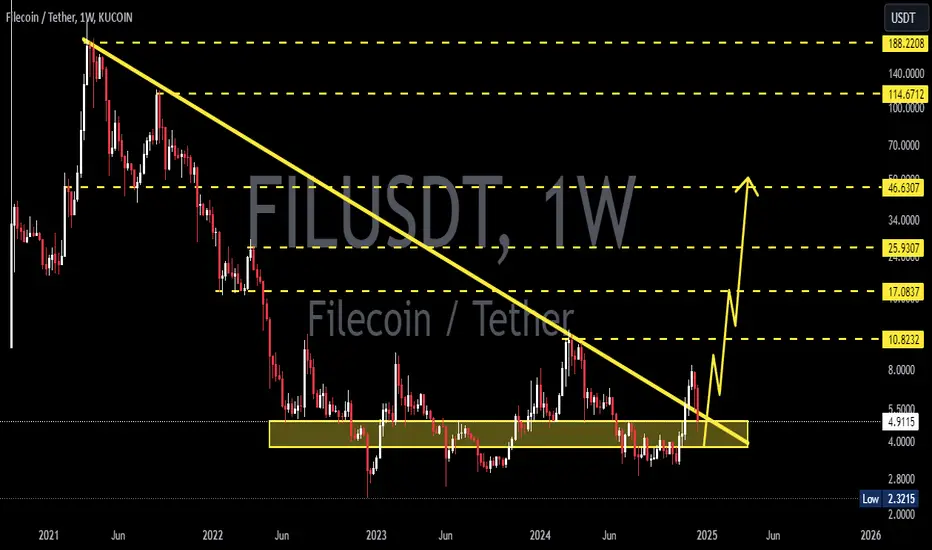
FILUSDT 1WFIL Update ~ 1W
#FIL Retesting this resistance line.. If you still have Conviction on the coin,. Buy gradually within this support block,. with a minimum target of 20%+
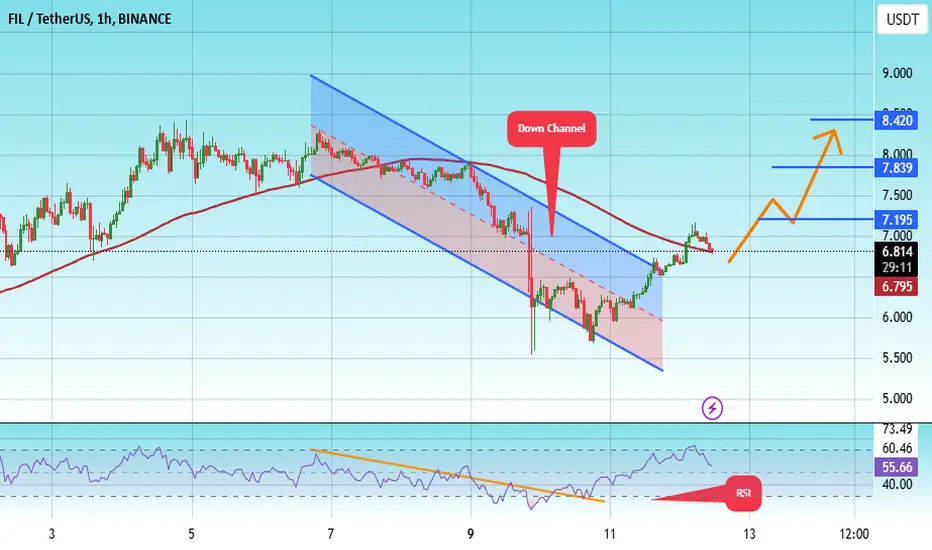
#FIL/USDT Ready to take off upwards#FIL
The price is moving in a descending channel on the 1-hour frame and sticking to it well
We have a bounce from the lower limit of the descending channel, this support is at 5.20
We have a downtrend on the RSI indicator that is about to break, which supports the rise
We have a trend to stabilize above the moving average 100
Entry price 5.50
First target 5.55
Second target 5.99
Third target 6.20

FIL / USDT: Primed for a breakout above trendline resistance FIL/USDT: Primed for a Breakout Above Trendline Resistance
FIL/USDT is setting the stage for a significant move 📈 as it approaches a key trendline resistance zone 📊. The price has been consolidating in a tight range, building momentum for a potential breakout 💥. If the breakout confirms, a bullish rally may unfold 🚀. Keep this pair on your radar and wait for confirmation before taking action.
Key Insights:
1. Trendline Resistance: FIL/USDT is nearing a well-established trendline that has acted as a barrier in the past. A breakout above this level could trigger strong bullish momentum.
2. Volume Surge: A noticeable increase in trading volume during the breakout will confirm buyer dominance 🔥.
3. Bullish Signals: Indicators like RSI and MACD are trending positively ⚡, suggesting growing bullish pressure.
Steps to Confirm the Breakout:
Look for a solid 4H or daily candle close above the trendline 📍.
A spike in volume during the breakout will indicate strong buying activity 📊.
A retest of the broken resistance as a new support zone will add reliability to the move ✅.
Watch out for fake breakouts, such as sudden reversals or long wicks above the trendline ⚠️.
Risk Management Strategies:
Use stop-loss orders to protect your capital 🔒.
Adjust position sizing to align with your risk tolerance and overall strategy 🎯.
This analysis is intended for educational purposes only and is not financial advice. Always conduct your own research (DYOR) 🔍 before making investment decisions.
