FIL/USDT — Bearish Continuation vs Potential Reversal?Currently, Filecoin (FIL) is trading at a critical decision point on the daily timeframe. The chart shows a clear descending triangle pattern, formed by a downtrend resistance line and a horizontal support zone around $1.96 – $2.28.
This pattern is typically seen as a bearish continuation, but it can also trigger a strong reversal breakout if price breaks above resistance with significant volume. In short, the market is now at a make-or-break zone — either a breakdown to new lows or a bullish breakout that could spark a strong rally.
---
🔎 Pattern Details & Key Levels
Pattern: Descending Triangle (lower highs + flat support)
Major Support Zone: $1.96 – $2.28 (strong demand zone, price has bounced multiple times)
Dynamic Resistance: descending trendline pressing since early 2025
Static Resistance Levels: $2.737 – $3.094 – $3.537 – $4.832
Psychological Levels above: $6.0 – $8.0
Measured Move Targets (triangle height):
Upside breakout = ≈ $3.51
Downside breakdown = ≈ $1.19
---
✅ Bullish Scenario
Trigger: Daily close above the descending trendline + confirmed breakout above $2.737 with strong volume.
Additional confirmation: Successful retest of trendline / $2.737 as new support.
Targets:
Short-term: $3.09
Primary measured move: $3.51
Extended targets: $3.53 – $4.83 (if momentum continues)
Upside potential: From $2.28 → $3.51 = +53.6%
---
❌ Bearish Scenario
Trigger: Daily close below $1.964 with convincing volume.
Additional confirmation: Failed retest of $1.96 as resistance.
Targets:
Primary measured move: ≈ $1.19
Psychological area: $1.00 (potential liquidity zone)
Downside risk: From $2.28 → $1.19 = -47.8%
---
📌 Conclusion
FIL/USDT is at a major crossroad.
Holding the $1.96–$2.28 support + breakout above the trendline opens the door to $3.51 and potentially $4.83.
Losing this support would confirm a bearish breakdown towards $1.19.
Best approach: Wait for daily close + volume confirmation to avoid false breakouts/breakdowns.
⚠️ Disclaimer: This analysis is for educational purposes only, not financial advice. Always apply proper risk management.
---
> FIL/USDT is now testing a decision zone with a descending triangle pattern on the daily chart.
Bullish case: Breakout above $2.737 → targets $3.09 to $3.51
Bearish case: Breakdown below $1.964 → target $1.19
$1.96 – $2.28 remains the critical support — either the last defense before a deeper drop, or the launchpad for the next rally.
🚨 Watch for daily close & volume to confirm the move!
#FIL #FILUSDT #Filecoin #Crypto #TechnicalAnalysis #DescendingTriangle #SupportResistance #Breakout #BearishScenario #BullishScenario #CryptoTrading
Filusdtsignal
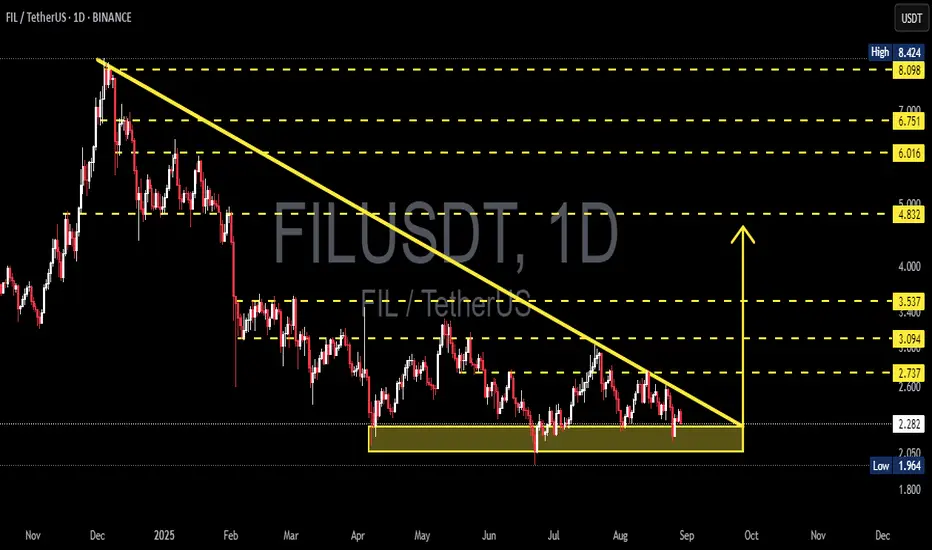
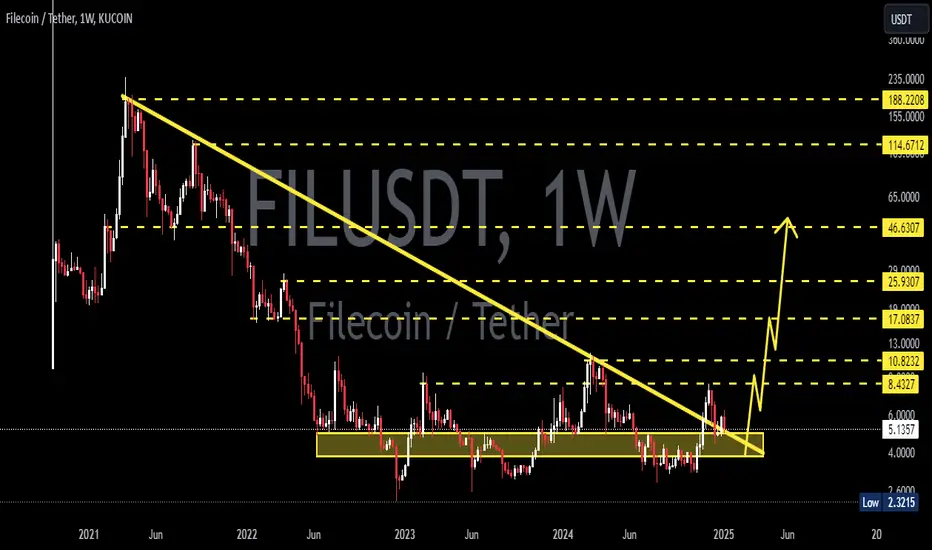
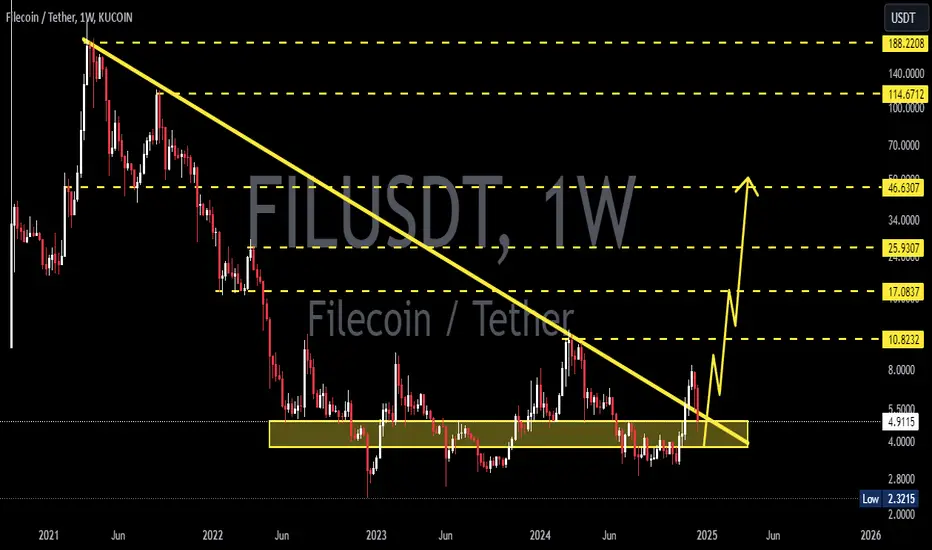
FIL/USDT – Major Trendline Breakout Imminent?The FIL/USDT chart is showcasing a significant descending trendline that has been respected since its peak in late December 2024. Price action has recently approached this trendline again, and a potential breakout scenario is forming. This setup may signal a major shift in trend after months of persistent decline.
🔍 Technical Analysis:
Trendline Resistance:
The long-term descending yellow trendline has capped every bullish rally since early 2025. A breakout above this trendline would be a major bullish technical signal.
Support Level:
Key horizontal support has been held at around $1.96, which has formed a strong base.
Potential Breakout Projection:
Upon breakout, $2.746 is the first resistance to watch.
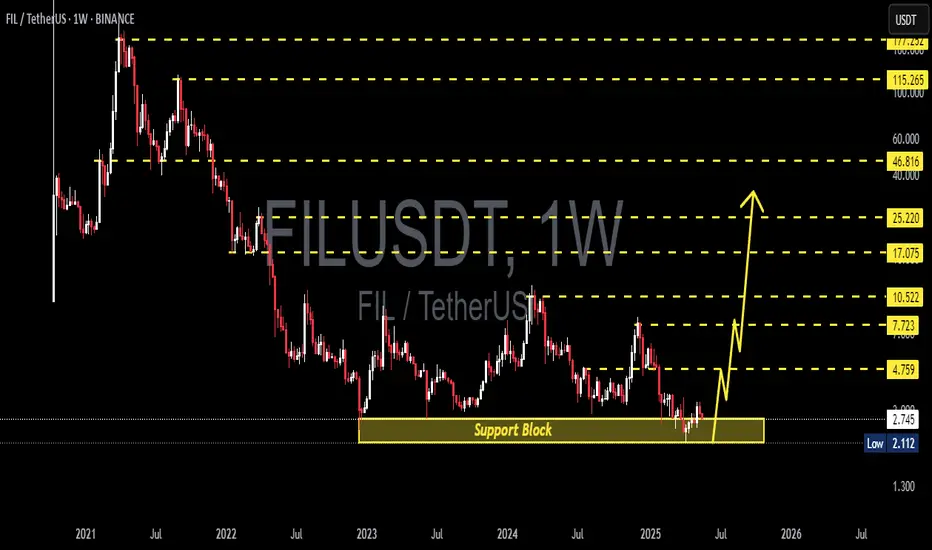
A successful retest of this level could lead to a stair-step rally targeting:
$3.222
$3.537
$4.803
$5.863
$6.758
And potentially $8.069–$8.425 if momentum continues.
Bullish Pattern:
The projected move shows a potential impulse wave pattern following the breakout, indicating staged profit-taking zones for traders.
🧠 Strategic Consideration:
A daily candle close above the trendline with volume confirmation would be the first sign of trend reversal.
Conservative traders may wait for a retest of the trendline as support before entering.
Targets can be approached progressively based on price action near each resistance level.
⚠️ Risk Management:
Watch for fakeouts near the trendline.
A break below the key support of $1.96 would invalidate the bullish thesis.

FILUSDT 1D AnalysisFIL ~ 1D Analysis
#FIL This is the lowest support for now. Buy if you still have confidence in this coin with a short term target of at least 20%+ from this support.

FILUSDT 1D Analysis FIL ~ 1D Analysis
#FIL Buy gradually from here if you still have confidence in this coin with a short term target of at least 15%+ from here.

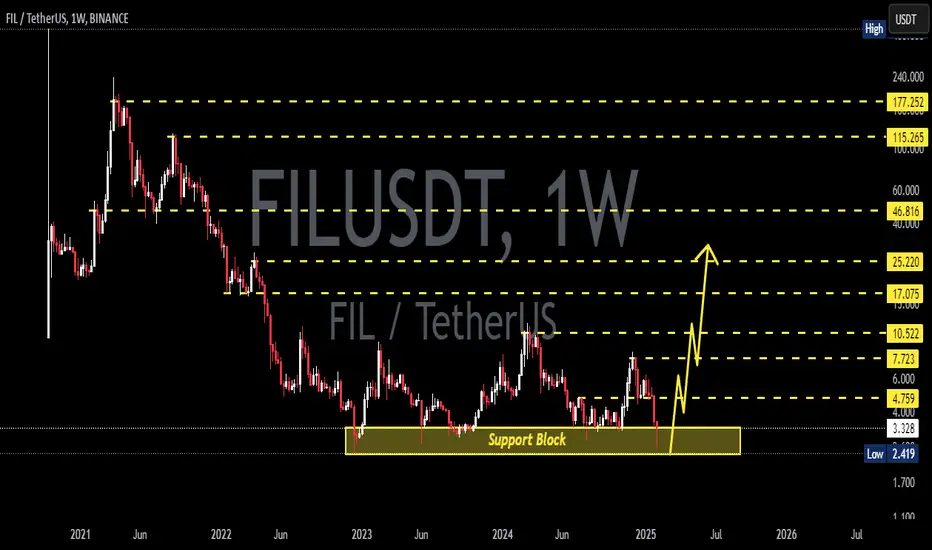
FILUSDT 1W AnalysisFIL ~ 1W Analysis
#FIL Buy gradually from here if you still have confidence in this coin with a short term target of at least 20%+ from here.
FILUSDT 1D AnalysisFIL ~ 1D Analysis
#FIL Buy after successfully penetrating this resistant line with a short -term target of at least 10%+ from here.

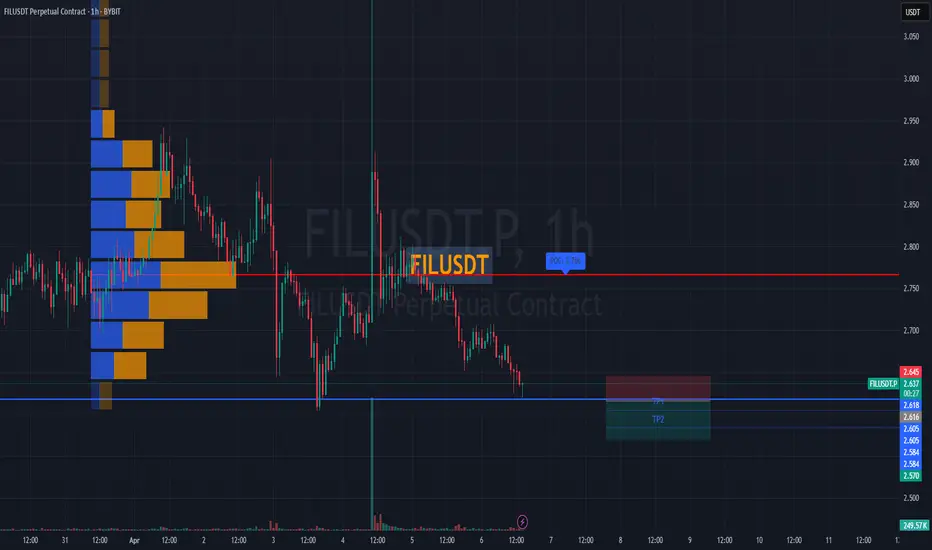
#FILUSDT remains under bearish pressure📉 SHORT BYBIT:FILUSDT.P from $2.616
🛡 Stop loss $2.645
🕒 1H Timeframe
⚡️ Overview:
➡️ The POC (Point of Control) BYBIT:FILUSDT.P is located at $2.766, far above the current price — this highlights strong historical selling pressure.
➡️ Price is forming lower highs and lower lows, confirming a bearish trend.
➡️ The breakdown below $2.616 triggered the short setup with further downside potential.
➡️ Volume spikes during red candles indicate continued seller activity.
🎯 TP Targets:
💎 TP 1: $2.605
💎 TP 2: $2.584
💎 TP 3: $2.570
📢 Watch the $2.616 zone — holding below increases downside probability.
📢 If price moves above $2.645, the setup becomes invalid.
BYBIT:FILUSDT.P remains under bearish pressure — short bias stays valid under current structure.
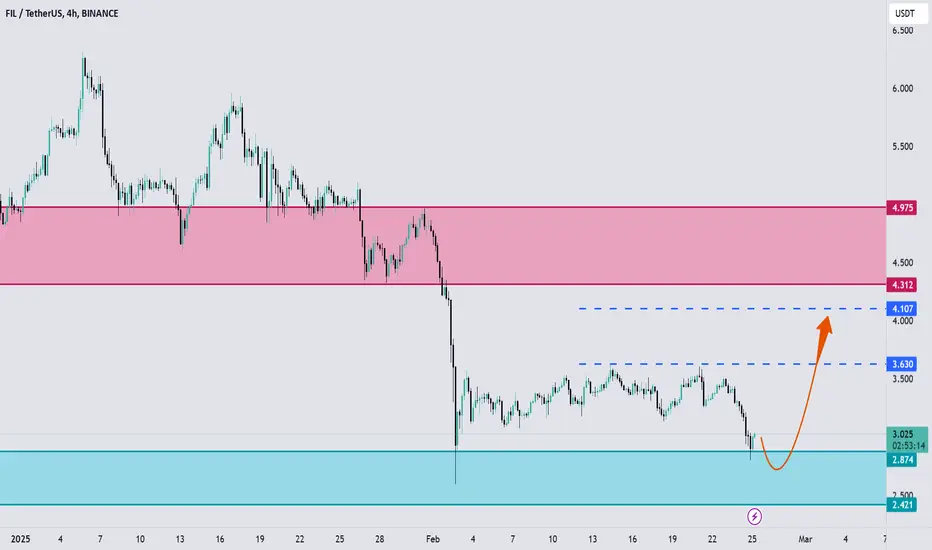
FILECOIN, Will we see 4$ again ?Hello Traders, Hope you are doing great.
After a downward movement that happened yesterday, now price is trying to find support around this level, so for upcoming days I expect an upward correction to specified blue Dashed lines.
Don't forget to use proper risk management .
Tell me What are your thoughts about FILECOIN ? UP or DOWN ? comment your opinion below this post.
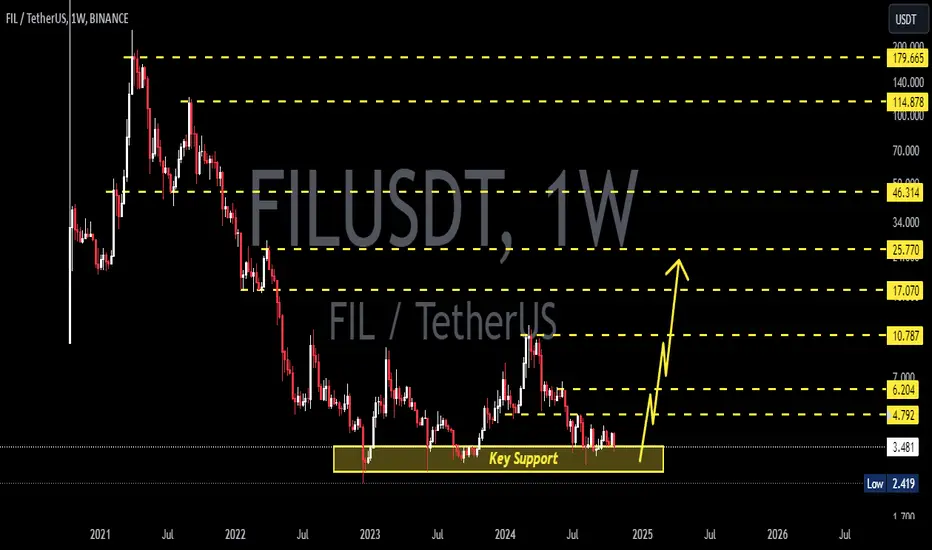
FILUSDT 1WFIL ~ 1W Analysis
#FIL This is the lowest support for now.Buy from here if you still have a Conviction on this Coin with a target of 20%+
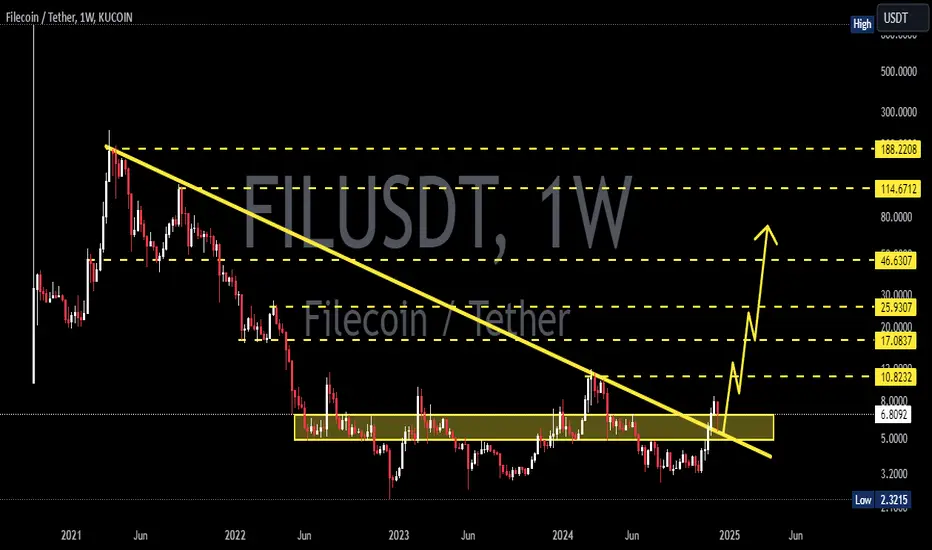
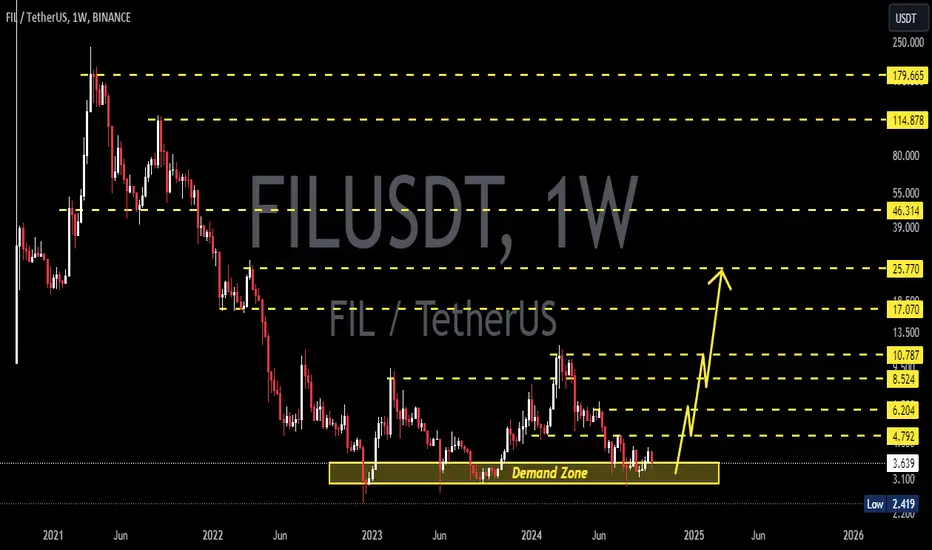
FILUSDT 1WFIL Update ~ 1W
#FIL still in a bullish trend. If you still have Conviction on this coin,. Buy gradually on this support block. with a minimum target of 20%++
FILUSDT 1WFIL Update ~ 1W
#FIL still in a bullish trend. If you still have Conviction on this coin,. Buy gradually on this support block. with a minimum target of 20%++
FILUSDT 1WFIL Update ~ 1W
#FIL Retesting this resistance line.. If you still have Conviction on the coin,. Buy gradually within this support block,. with a minimum target of 20%+
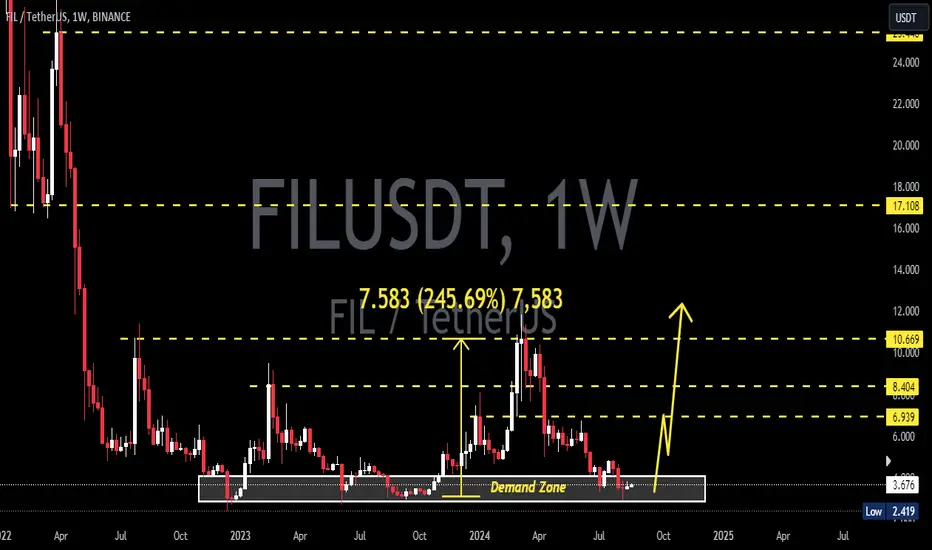
FILUSDTFIL ~ 1W
#FIL If you have Conviction on this NASDAQ:COIN , then this is the right time to start buying, you will get the bottom price for now. at least for 20%+ profits
FILUSDTFIL ~ 1W ✅
#FIL If you have Conviction on this NASDAQ:COIN , then this is the right time to start buying, you will get the bottom price for now. at least for 20%+ profits
FILUSDTFIL ~ 1W ✅
#FIL If you have Conviction on this NASDAQ:COIN , then this is the right time to start buying, you will get the bottom price for now. at least for 20%+ profits
FILUSDTFIL ~ 1W
#FIL If you have Conviction on this NASDAQ:COIN , then this is the right time to start buying, you will get the bottom price for now. at least for 20%+ profits
FILUSDT 1WFIL ~ 1W
#FIL If you have Conviction on this NASDAQ:COIN , then this is the right time to start buying, you will get the bottom price for now. at least for 20%+ profits
FILUSDT 1WFIL ~ 1W
#FIL If you have trust in this coin, now is the time to accumulate. this is a very good bottom to make a repurchase.
FILUSD 1WFIL. ~ Updated
#FIL Don't Miss COINBASE:FILUSD
Prices consolidate and buy gradually from here. Minimum target 20%+
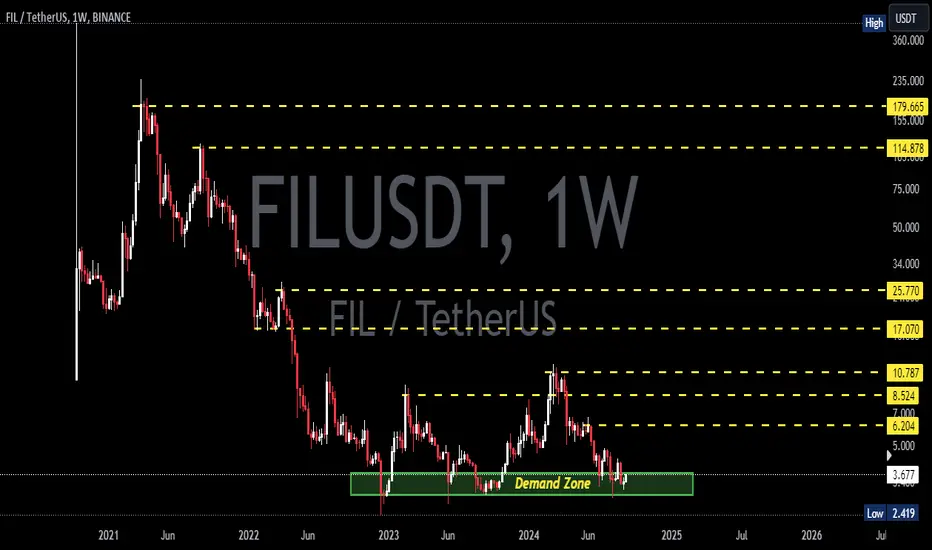
FILUSD 1WFIL ~ 1W
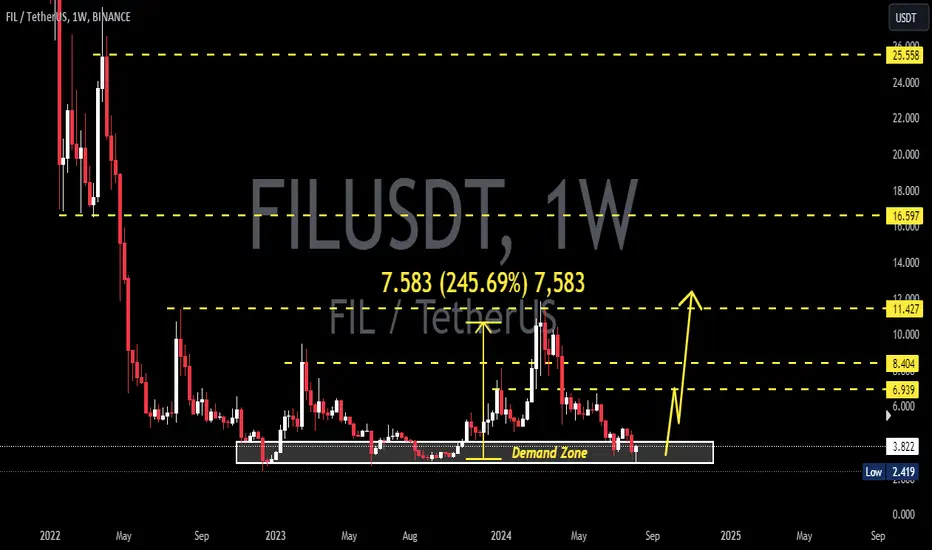
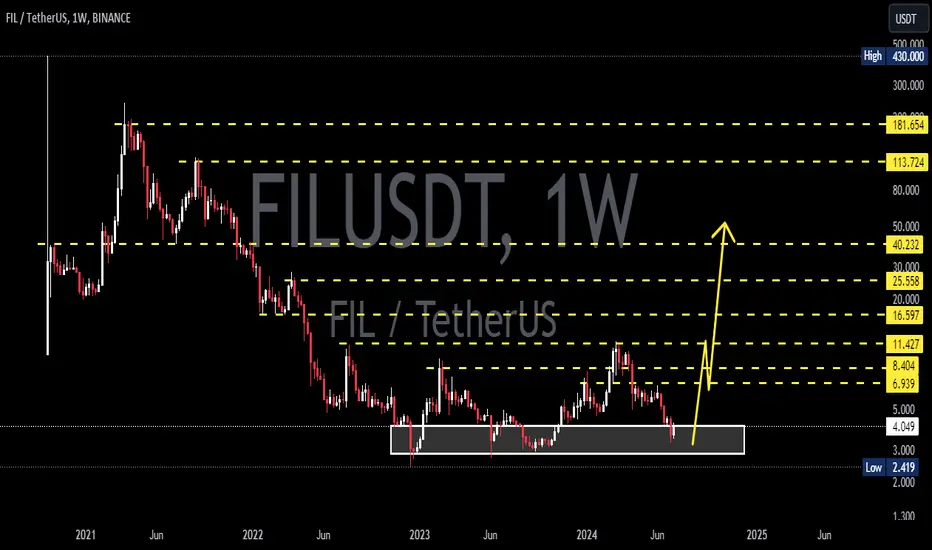
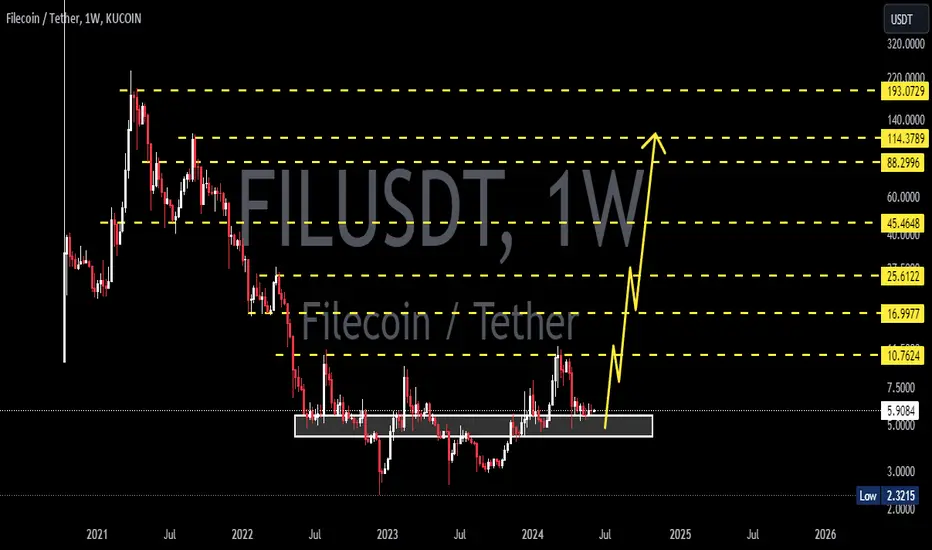
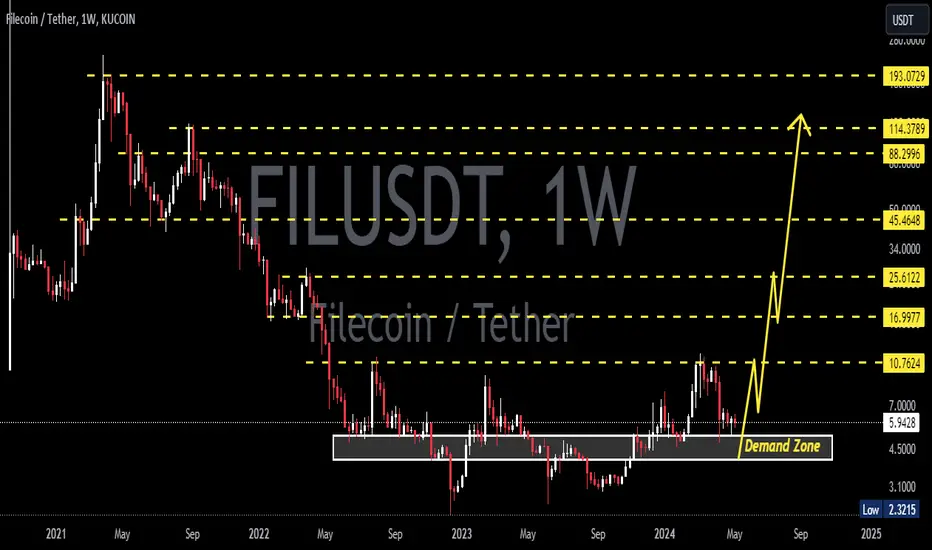
#FIL Make purchases gradually in demand zone, With a long term target of at least 20%++
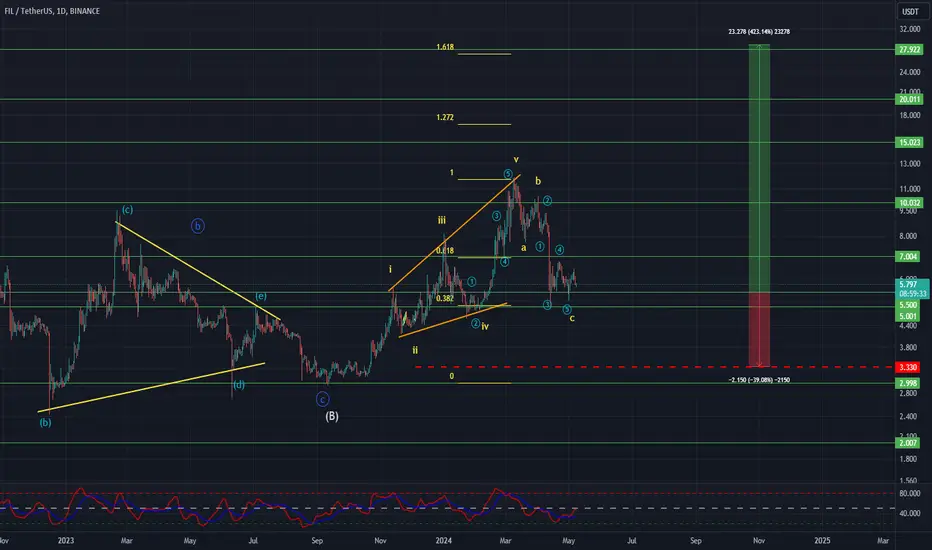
FILUSDT Elliott Waves AnalysisHello friends.
Please support my work by clicking the LIKE button👍(If you liked). Also i will appreciate for ur activity.
Everything on the chart.
Entry: Market and lower
Targets: 10 - 15 - 20 - 28
Stop: under 3.3 (depending of ur risk).
RR: 1 to 10
ALWAYS follow ur RM.
risk is justified
It's not financial advice.
DYOR!
FILUSDT: XABCD Harmonic Pattern Analysis - Bullish OpportunityOverview:
FILUSDT has recently completed the formation of an XABCD harmonic pattern, signaling a potential reversal in the price trend. This pattern has emerged at a key support area, suggesting a strong foundation for a bullish move.
Entry Point:
We recommend considering entry near 8.540. This level aligns with the completion of the harmonic pattern at point D, providing an opportune entry point for bullish positions.
Stop Loss:
To mitigate risk, a stop loss is advised near 8.1818. This level is strategically placed below the entry point to limit potential losses in the event of an adverse price movement.
Take Profit Targets:
1. TP-1: Our initial target for profit-taking is set at 8.9095. This level reflects a conservative projection of upward price movement following the completion of the harmonic pattern.
2. TP-2: The second target is positioned at 9.2655. This level represents a continuation of the bullish momentum, offering additional profit potential.
3. TP-3: A third target is identified at 9.6212. This target reflects further upside potential as the price trend gains momentum.
4. TP-4: The final target is set at 10.0000. This level signifies a significant milestone in the bullish trajectory, presenting an opportunity for substantial profit realization.
Conclusion:
Based on the XABCD harmonic pattern formation and the key support area, FILUSDT is poised for a bullish move with potential profit targets identified at various levels. Traders are advised to monitor price action closely and adhere to risk management strategies outlined in this analysis.

FIL/USDT Breakout Alert! Descending channel. Bullish Momentum !!💎 FIL has notably made its mark in the cryptocurrency market. Recently, FIL achieved a significant milestone by breaking out of a major descending channel pattern, signaling a shift to bullish momentum.
💎 This breakout suggests that FIL might enter a retesting phase, likely at the demand area or along the support trendline of the descending channel, before it can probability continue its ascent toward a strong resistance area.
💎 However, there's a possibility that FIL might approach the resistance area directly without undergoing a retesting phase. In such a scenario, FIL could face rejection at this resistance level, which might lead it back down to the demand area.
💎 The demand area becomes crucial in this context. For FIL to maintain its upward trajectory, it must bounce back from this area. Should FIL fail to hold its ground at the demand zone, particularly if it breaks below it, the asset could potentially drop further to a lower demand area, around the $4.4 mark.
