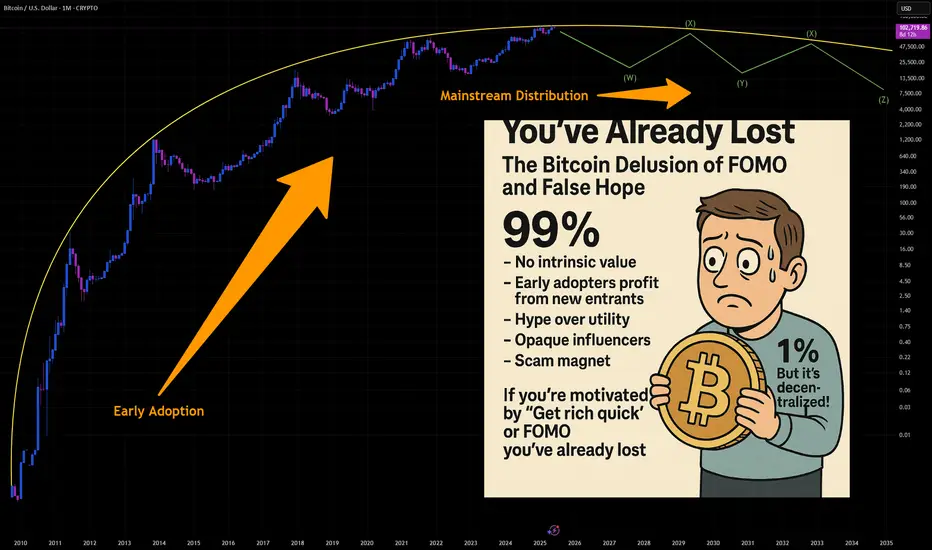
You've Already Lost: The Bitcoin Delusion of FOMO and False HopeLet’s get one thing straight: if you’re staring at Bitcoin, squinting past the red flags, and convincing yourself it’s not a Ponzi scheme because of that one shiny feature that screams “legit,” you’re not investing—you’re auditioning for the role of “next victim.” And if your motivation is the fear of missing out (FOMO) or the fantasy of getting rich quick, well... congratulations. You’ve already lost.
The 99%: Red Flags Waving Like It’s a Parade
Let’s talk about the indicators—the ones that make Bitcoin look suspiciously like a Ponzi scheme. No, it’s not technically one, but the resemblance is uncanny:
- No intrinsic value: Bitcoin isn’t backed by assets, cash flow, or a government. It’s worth what the next person is willing to pay. That’s not investing. That’s speculative hot potato.
- Early adopters profit from new entrants: The people who got in early? They’re cashing out while newcomers buy in at inflated prices. That’s the classic Ponzi dynamic: old money out, new money in.
- Hype over utility: Bitcoin’s actual use as a currency is minimal. It’s slow, expensive to transact, and volatile. But hey, who needs functionality when you’ve got memes and moon emojis?
- Opaque influencers: From anonymous creators (hello, Satoshi) to crypto bros promising Lambos, the ecosystem thrives on charisma, not accountability.
- Scam magnet: Bitcoin has been the currency of choice for over 1,700 Ponzi schemes and scams, according to a University of New Mexico study cs.unm.edu . That’s not a coincidence. That’s a pattern.
The 1%: The “But It’s Decentralized!” Defense
Ah yes, the one redeeming quality that Bitcoin evangelists cling to like a life raft: decentralization. No central authority! No government control! It’s the financial revolution!
Except… decentralization doesn’t magically make something a good investment. It just means no one’s in charge when things go wrong. And when the market crashes (again), you can’t call customer service. You can tweet into the void, though.
FOMO: The Real Engine Behind the Madness
Let’s be honest. Most people aren’t buying Bitcoin because they believe in the tech. They’re buying because they saw someone on TikTok turn $500 into a Tesla. FOMO is the fuel, and social media is the match.
Bitcoin’s meteoric rises are often driven by hype cycles, not fundamentals. Tesla buys in? Price spikes. El Salvador adopts it? Price spikes. Your cousin’s dog walker says it’s going to $1 million? Price spikes. Then it crashes. Rinse, repeat.
This isn’t investing. It’s gambling with a tech-savvy twist.
The Punchline: You’ve Already Lost
If you’re ignoring the overwhelming signs of speculative mania and clinging to the one feature that makes you feel better about your decision, you’re not ahead of the curve—you’re the mark. And if your motivation is “I don’t want to miss out,” you already have. You’ve missed out on rational thinking, due diligence, and the ability to distinguish between innovation and illusion.
Bitcoin might not be a Ponzi scheme in the legal sense. But if it walks like one, talks like one, and makes early adopters rich at the expense of latecomers… maybe it’s time to stop pretending it’s something else.
INDEX:BTCUSD NYSE:CRCL NASDAQ:HOOD TVC:DXY NASDAQ:MSTR TVC:SILVER TVC:GOLD NASDAQ:TSLA NASDAQ:COIN NASDAQ:MARA
Finance
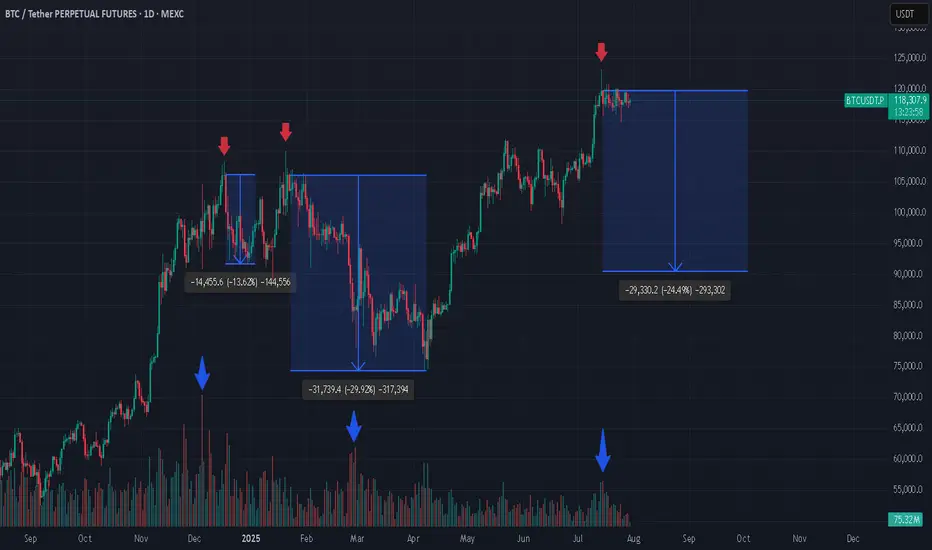
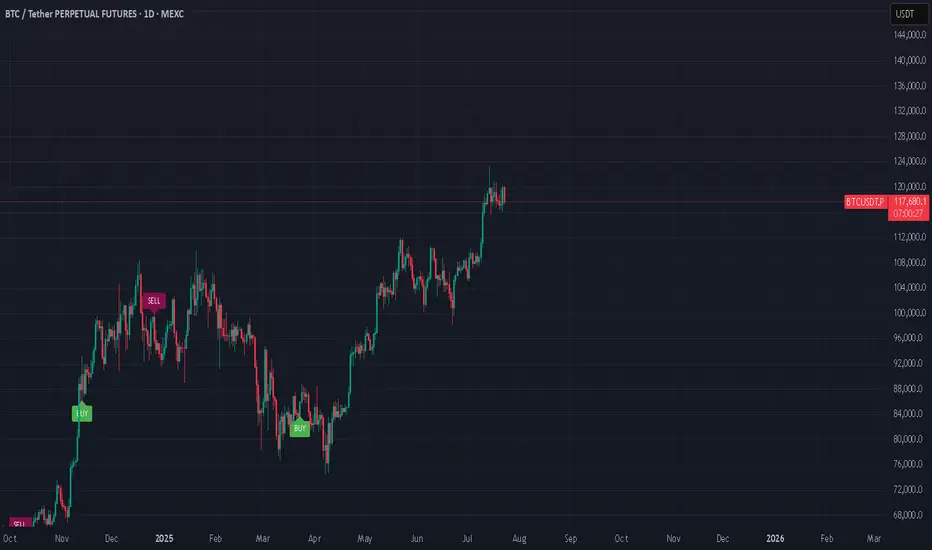
3 Bitcoin Tops, Weak Green Candles, and What’s Next? If you're closely monitoring the Bitcoin (BTC) market, patterns often begin to reveal themselves in surprising ways. In the attached chart, I’ve highlighted three major local tops that Bitcoin has made, each marked by a weak green daily candle. What’s even more striking is what comes next: a dramatic increase in trading volume, followed by steep corrections.
Spotting the Pattern: Weak Green, Heavy Volume
At each pointed top (see red arrows), BTC formed an all-time high (ATH) with a relatively weak green candle, hardly the sign of euphoric buying strength.
Look closely at the volume bars below (blue arrows). Each time, as price struggled to push higher, volume surged after the top, often a signal of major sellers stepping in or longs closing en masse.
What followed? Significant corrections: -13.6%, -29.2%, and, now it might be shaping up for another potential drop (-24.1%) if history rhymes.
Why Does This Matter?
From a technical analysis perspective, volume is the fuel behind price moves. When a new high is reached with limp buying (weak green candles) but is swiftly met with rising volume on the way down, it’s a classic sign of distribution, a strong hand selling into retail euphoria.
Is Another Drop Coming?
Given the consistency in behavior, it’s not unreasonable to ask: are we about to witness another similar correction now that BTC has again hit a top with a weak green candle and volume is ticking up? The historical evidence certainly makes it plausible.
Long-Term Perspective: Still Bullish
Despite these corrections, my long-term outlook remains bullish. Every cycle has corrections, they’re opportunities for healthy consolidation, allowing strong hands to accumulate and the market to reset for its next leg higher.
*not investment advice
#crypto #btc #bitcoin #finance #trading
Gold - Powerful RunAfter its powerful run, gold has shown signs of fatigue, stalling near technical resistance between $3,330–$3,350 per ounce in late July. Analysts warn that while the bullish trend remains intact on a structural level, daily volatility is high and some profit-taking or consolidation could continue unless new destabilizing events emerge.
Will the Rally Continue?
The Bull Case
Structural Demand: Multiple sources, including J.P. Morgan and other major forecast groups, predict gold’s structural bull case remains strong with average prices of $3,220–$3,675 per ounce likely through the end of 2025, and even $4,000 possible by 2026.
Ongoing Uncertainty: Persistent geopolitical risks, trade disputes, and fiscal pressures are expected to maintain robust safe haven flows into gold.
Central Bank and Asian Demand: Sustained buying by central banks and consumers in Asia could provide a solid floor below current levels.
The Bear Case
Interest Rate Dynamics: If central banks, especially the US Federal Reserve, hold or increase interest rates, gold could lose momentum, higher rates increase the opportunity cost of holding non yielding bullion.
Diminishing New Risks: Unless fresh economic or geopolitical shocks appear, further upside may be capped in the near term. Several experts predict gold may consolidate or trade sideways pending new catalysts.
Speculator Flows: Rapid speculative bets could lead to sharp corrections, particularly on technical breakdowns after such a strong rally.
Conclusion
The gold rally of 2025 has been driven by an unusual mix of global volatility, central bank behavior, and shifting investor psychology. While prices could pause or pull back in the coming months, the fundamental supports structural demand, central bank buying, and persistent global risks, suggest that the broader gold bull cycle is not yet over, with $3,000+ likely forming the new base for gold as we look toward 2026.
*NOT INVESTMENT ADVICE*
#gold #safehaven #uncertainty #economy #finance #trading #indicator

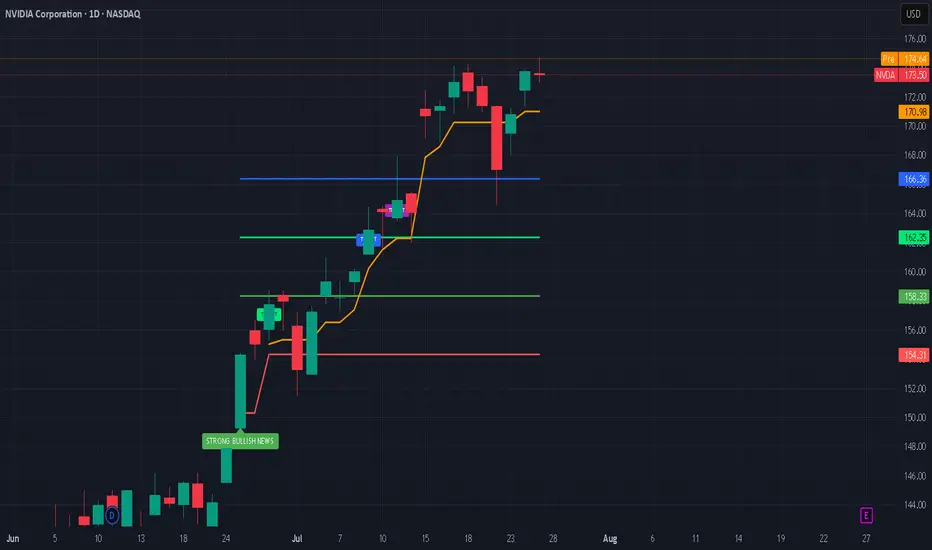
Nvidia’s Historic 2025 Stock Rally: What’s Driving It?Nvidia’s stock has once again captivated Wall Street in 2025, breaking records and fueling debates on whether its blistering momentum will continue or eventually ease. Here’s an in-depth look at why Nvidia is surging, the key drivers behind the rally, and what the long-term future could hold.
Nvidia’s Stock Rally: By the Numbers
As of July 2025, Nvidia stock has rallied more than 39% year-to-date, reaching new all-time highs above $170 and propelling the company’s market cap past $4 trillion, the largest in the world.
The stock has added nearly $2 trillion in valuation since April, outpacing tech giants like Microsoft and Apple.
Analyst price targets for the rest of 2025 vary: the average ranges from ~$174 to ~$235, with bullish forecasts up to $250 and more cautious targets down to $135.
What’s Powering the Rally?
1. Surging AI Demand:
Nvidia remains at the center of the artificial intelligence (AI) boom. Its graphics and AI accelerator chips (notably the new Blackwell AI family) are the backbone of AI infrastructure for Global Tech firms (Amazon, Meta, Microsoft, Google) and cloud service providers. This AI-centric demand has kept revenue growth robust and margins high (approaching 70%).
2. Easing China Trade Fears:
Earlier in 2025, U.S.–China export controls severely restricted Nvidia’s sales of advanced AI chips like the H20 to Chinese customers, causing a temporary selloff. However, a subsequent pause on tariffs by the U.S. and optimism about renewed China shipments reignited investor confidence, helping reverse earlier losses and extending the rally.
3. Massive Tech Investment Cycle:
The global rush to build out AI infrastructure is bringing huge investments from U.S. and international hyperscalers. Meta and Amazon alone have announced plans to pour “hundreds of billions” into AI data centers, much of it destined for Nvidia-powered hardware.
4. Strong Fundamentals and Diversification:
Nvidia sports some of the highest profit margins among mega-cap tech stocks. Its free cash flow, dominant market share, and expanding ecosystem, including platforms like Omniverse (for 3D and digital twins) and Drive (autonomous vehicles)—cement its leadership well beyond just chips.
What Could Slow Nvidia Down?
Despite the excitement, several risks linger:
Valuation Concerns: Nvidia trades at a premium (P/E above 50 for trailing earnings), raising worries of a pullback if growth slows.
Geopolitical and Regulatory Threats: Further U.S.-China tensions, new export regulations, or rising competition from rivals like AMD, Huawei, or custom silicon at cloud giants could erode growth or margins.
Cyclicality of the AI Boom: Some market watchers worry that AI infrastructure spending could prove cyclical, making Nvidia’s revenue growth more volatile in future years.
The Long-Term Outlook (2025 & Beyond)
Bullish Case: Most analysts expect continued dominance for Nvidia as AI, autonomous vehicles, robotics, and edge computing keep growing exponentially. Price targets range as high as $250 for 2025, climbing to $1,000+ by 2030 if AI adoption continues its rapid expansion.
Base Case: Moderate growth continues into 2026–2027, with a price target cluster around $180–$235 (2025) and $200–$428 (2027), assuming AI demand moderates, margins remain stable, and Nvidia fends off competitive threats.
Bearish Case: If U.S.-China relations sour and hyperscaler spending slows, the stock could retest support levels ($135–$150). However, few analysts expect a sustained collapse unless there is a fundamental change in AI or chip technology trends.
#nvda #stockmarket #finance #revenue #profit #financials #economy #technology #ai #chips
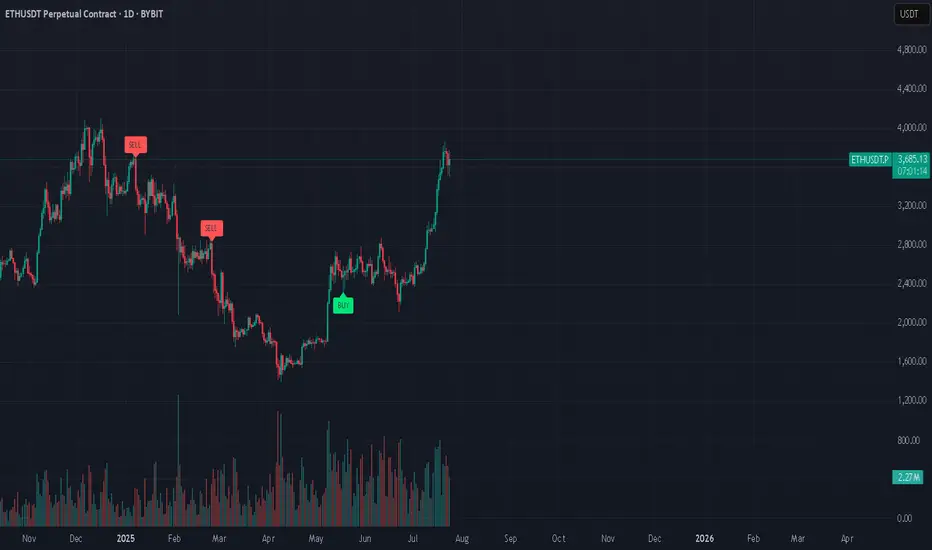
Huge Bear Trap next in line??Ethereum Exit Queue: 518,180 ETH
Half a million ETH is currently queued for unstaking on Ethereum...
Keep in mind, August 1st, Trump's Reciprocal Tariffs get in effect
Everyone's talking about BTC's new ATH, ETH's rally, XRP new ATH, but no one is talking about August 1st...
Manipulation is taking place. Stay safe, because a huge bear trap might be next in line (BTC back to 90K)
*NOT INVESTMENT ADVICE*
#crypto #ethereum #eth #btc #bitcoin #trading #xrp #trump #tariff #finance #economy
Tariffs incoming...July 23: Markets are booming.
August 1st: Tariffs.
I'm just saying, it might be a nice discount...
#market #finance #tariff #trump #crypto #forex #stocks #economy #trading
Mid-Session Market ReviewMid-Session Market Review
S&P 500: After some initial volatility from the 8:30 news, the market accepted above the prior day’s levels but has since pulled back within range, consolidating just below the highs.
NASDAQ: The NASDAQ remains above all of yesterday’s levels and is currently balancing between the high of the day and the 23,100 level, showing a rotational pattern.
Russell 2000: This market is rotational within the prior day’s range and has accepted below the CVA and PVA. Potential trade opportunities might come with a pullback to the 2,245 area.
Gold: Gold has accepted below the prior value area and is still rotational within the CVA. Trade opportunities could present themselves near the prior day’s low.
Crude Oil: The market is quite choppy, hovering around the prior day’s low and value area low. Caution is advised, with potential long opportunities on a pullback, as long as conditions align.
Euro Dollar: The Euro is dropping significantly, moving below all key levels without much respect for them. This could provide short opportunities if there’s a pullback.
Yen: Similar to the Euro, the Yen is also pushing below previous levels. It’s getting choppy near the CVA low, so caution is needed until it shows more respect for those levels.
Natural Gas: The market is rotational within the prior day’s range and respecting the CVA high. Long opportunities might be possible if conditions are right.
Aussie Dollar: It’s showing some respect for the CVA low and is still rotational. There could be a potential long setup forming, depending on how it plays out.
British Pound: The Pound has accepted below all key levels, and a pullback to the CVA low might provide short opportunities, though caution is needed around the VWAP.

L&T Finance – Cup & Handle Breakout After 8 Years!L&T Finance has finally broken out of a classic Cup and Handle pattern, reclaiming its 2017 all-time high after nearly 8 years of consolidation. Strong volume confirmation adds weight to this long-term bullish breakout. A must-watch for positional traders and investors looking for momentum in the NBFC space!

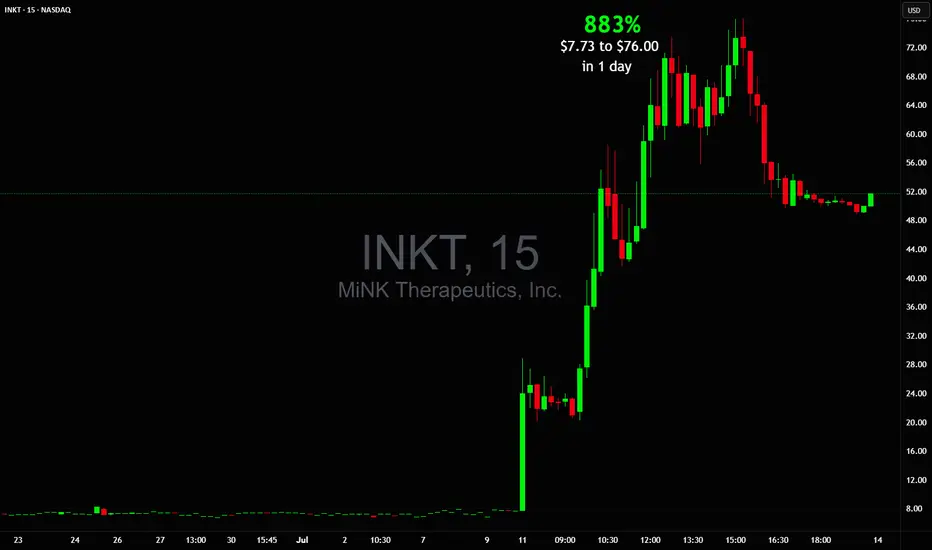
$7.73 to $76.00 in 1 day! Another 800% runner $INKTAGAIN? Another 800% runner in a day? 🚀 Such massive moves became a daily thing these days? 😲 NASDAQ:INKT
Can't wait to see new one in the morning!
RVYL updated outlook...ULTRA BULLISH month ahead!Both weekly & monthly timeframes indicating bullish inverted hammer. This is a bullish reversal signal based on technicals alone.
Near term buy-side technical target is just above the wick on daily candle from 6/2.
Take note of June's price action remaining predominantly within the consolidation range of the daily candle body from 6/5. The current retracement to gap fill levels on 4 hr tf is seen as an immense discount buy opportunity.
Rate cut narrative is also strongly bullish for small caps in general. Rates are to stock prices as gravity is to physics. Lower rates relieve downward pressure on stock prices, as future earnings projections are more optimistic amidst less growth-restrictive conditions.
Long term buy-side target into 2027-2028 remains 8$ range. Near term, we have at least a couple multi-bagger setups left for 2025.

Compounders: 5 Simple Rules to Build Long-Term WealthImagine this:
…it’s 18 years ago. The very first iPhone has just hit the market.
Meanwhile, Nokia’s legendary “Snake” game, once the height of mobile fun, was starting to feel… dated.
⚡ And you can sense it: something big is coming. You don’t know exactly what, but something is about to shake the system.
So, you invest €1,000 into Apple stock. No fancy moves, no day trading. You don’t check the price every morning, you don’t sell at the first dip. You just hold and go about your life, using their products as always.
----------------------------------
Fast forward to today: the iPhone has evolved quite a bit, and so has your bank account, “a bit”.
That modest €1,000 investment would now be worth roughly €70,000. For context, if you had simply invested in the S&P 500 instead, your total profit would be €3,300.
This is what happens when you hold a real compounder. Apple: +6,942%. S&P 500: +334%. Time doesn’t just pass, it compounds!
Big difference, right?
And the craziest part? You didn’t need a crystal ball. Looking back, everything makes perfect sense.
The real question is:
Can you spot the next one before it becomes obvious?
---------------------------------------
📈 Compounders: The slow, steady, and surprisingly effective path to wealth
A compounder is a company that steadily grows your investment over time, powered by a strong business model and consistent value creation.
These stocks don’t need to chase headlines. They don’t create drama, and they certainly don’t swing wildly every week on the stock exchange. They simply keep building value.
Strong financials, good products, and a clear direction—like a snowball quietly rolling downhill, gathering momentum with every meter.
As Warren Buffett once said:
That’s exactly what compounders allow you to do. While you rest, they keep working.
It’s definitely not a get-rich-quick strategy. It’s more like a slow, somewhat boring, and failry a “safer” route. But in return, it might just give you something far more valuable than fast gains: financial peace of mind, and perhaps even financial freedom.
🔍 So how do you spot one?
Now, let’s be clear: compounders are not bulletproof. Market crashes, disruptive competitors, and economic shocks can still shake them.But when the foundation is solid, these companies tend to stand strong, even in a storm.
Here are five key traits that define a true compounder. From consistent growth to an unshakable competitive edge.
---------------------------------------
📈 1. Steady Growth
What you want to see is a steady upward trend in both revenue and earnings per share (EPS). Not a rollercoaster. A clean, reliable trend.
A strong compounder doesn’t explode one year and crash the next. It grows year after year. It grows calmly, consistently, and predictably…
Microsoft EPS Q Source: TradingView
That’s usually a sign of solid management and sticky customer demand.
Let’s look at a key metric here:
EPS CAGR (5-year) – the compound annual growth rate of earnings per share.
5% = solid → reliable and steady progress
10% = good → suggests a strong business model and real market demand
15%+ = great → this is where the snowball effect really kicks in, fast and orderly
📌 The higher the CAGR, the faster your investment compounds. But it’s not just about speed, it’s about repeatability. If that growth is not random but repeatable and sustainable, you don’t just have a growth stock → you’ve got a true compounder.
⚠️ Always consider the sector: A 15% CAGR might be normal in tech, but in a consumer brand or industrial company, that’s an exceptionally strong result.
---------------------------------------
💡 2. Efficient Capital Allocation
A good compounder doesn’t just grow a lot—it grows wisely.
That means every dollar the company reinvests into its business generates more than a dollar in return.
Think of it like a business where every $1 invested turns into $1.20 or more in profit. The more efficiently it can put capital to work, the faster it compounds over time.
🎯 ROIC (Return on Invested Capital) tells you how effectively a company is using all its invested capital—including both equity and debt.
ROIC shows how much profit the company earns after taxes and costs for every dollar it has invested, regardless of where that money came from.It’s broader than ROE, which only considers shareholder equity.
>10% = solid
>15% = good
>20% = great
🎯 ROE (Return on Equity) measures how well the company generates returns specifically on shareholder money:
>15% = solid
>20% = good
>25% = great
📌 In most cases, ROIC is more important than ROE , since it doesn’t get distorted by how much debt the company is using. But when both numbers are high, you’ve got something that creates a lot of value - a true compounding engine.
Just imagine you give a chef $10 to make a dish. If they can turn that into a $15 meal, their ROIC is 50%. That’s the kind of capital efficiency we want to see in companies too, where every dollar invested pulls serious weight.
---------------------------------------
💰 3. High Profit Margins
Selling stuff isn’t hard. Any company can sell something, even at a loss.
A true compounder doesn’t just generate revenue, it earns real profit from it.
That’s where operating margins come into play. They show how much money is actually left over after covering everything: salaries, logistics, rent, office coffee, stolen toilet paper, and all the other lovely overhead costs.
⚙️ Operating Margin – the percentage of revenue that turns into operating profit:
10% = solid → stable profitability, usually driven by volume or efficiency
20%+ = great → often signals strong pricing power, lean cost structure, or a dominant brand
📌 Why does this matter?
Because the more profit a company retains after expenses, the more it can:
- reinvest in new products or markets
- pay dividends to shareholders
- or buy back shares (which automatically increases your ownership per share)
All of these create real, recurring value for you as an investor—not just once, but year after year.
⚠️ One important note: What qualifies as a “high” margin depends on the industry. A software company might easily run at 30% margins, while a retail chain or car manufacturer might be thrilled with 5%.
So don’t judge the number in isolation. Always consider the type of business—in some sectors, profits come from volume, not margin.
---------------------------------------
🧱 4. Debt Matters
Even if a company is growing fast and making money, it still doesn’t qualify as a true compounder if it’s drowning in debt.
A real compounder moves forward mostly(!) under its own power, not thanks to borrowed money.
Financially strong companies have a healthy buffer, so they’re not in trouble the moment the economy slows down or credit tightens.
📉 Debt-to-Equity (D/E) – how much of the company is financed with debt versus equity:
Under 1 = solid → reasonable leverage
Under 0.5 = great → very strong and conservative balance sheet
📈 Interest Coverage Ratio – how easily the company can pay its interest expenses:
5× = solid
10×+ = great → very safe, meaning debt costs won’t threaten profitability
📌 The lower the debt and the higher the buffer, the lower the risk.A company with a strong balance sheet doesn’t need to refinance debt in a panic or rely on costly tricks to survive downturns.
Think of it like the foundation of a house. Without it, even the most beautiful structure can collapse.
⚠️ Some industries (like real estate or utilities) naturally operate with higher debt levels. But even in those cases, you want to see a business that controls its debt, rather than living “one day at a time.”
---------------------------------------
🏰 5. Durable Competitive Advantage (a.k.a. Moat)
Back in the Middle Ages, a moat was a water-filled trench that protected a castle.Today, in investing, a “moat” is what protects great businesses from competition.
It’s a business that others can’t easily reach or replicate.
💪 When a company has a wide moat, it can:
- Defend its market share even when others try to attack
- Command higher prices—because customers stay loyal
- And if a competitor starts gaining ground, it often has enough capital to... just buy them out
Here are some classic moat types with examples:
- Brand Loyalty – People pay more for something familiarExample: Coca-Cola. There are hundreds of alternatives, but the taste, logo, and brand feel... irreplaceable.
- Network Effects – Every new user strengthens the product or platformExample: Visa, Mastercard. The more they’re used, the harder it is for any new player to break in.
- Technological Edge – The company is simply too far aheadExample: Nvidia, ASML. You can throw money at the problem, but patents and experience aren’t things you copy overnight.
- Ecosystem Lock-in / Habitual Consumption – Customers get “stuck,” and switching feels like a hassleExample: Apple. Once you have the iPhone, AirPods, and MacBook… switching to Android just sounds like a lot of work.Or take Procter & Gamble. If your baby’s used to Pampers, you’re not going back to cloth diapers anytime soon. (To be fair—Huggies might actually be better 😄 That’s Kimberly-Clark, ticker KMB.)
📌 A strong moat allows a company to maintain both profitability and growth for the next 10+ years—because no one else can get close enough to steal it.It’s not fighting tooth and nail for every dollar. It rules its niche quietly and efficiently.
---------------------------------------
Now that we’ve covered what makes a business a compounder, the next question naturally follows:
“Okay, but if it’s such a great company... is it still a great price?”
That’s where valuation comes in.P/E ratio: how to know whether you’re paying a fair price or just a premium for the brand.
---------------------------------------
👉 In my April article, I clearly broke down P/E along with eight other key fundamental metrics: straightforward, real-world explanations designed to help you actually use them…
---------------------------------------
💵 P/E (Price-to-Earnings Ratio)
The P/E ratio tells you how much you’re paying for every $1 of a company’s earnings.
Think of it like this: are you buying solid value for $20… or paying $70 just because the brand sounds familiar?
Now, for compounders, a high P/E (say, 25–40) can actually be fine, IF(!) the company is growing fast and has a strong moat.
Here’s a quick cheat sheet:
* Under 15 → generally cheap (might be a bargain… or a trap)
* 15–25 → fair price for a traditional business
* 25–35 → reasonable if the company is growing consistently
* 35–45 → starting to look expensive, must be justified by fundamentals
* 45+ → expensive, and the market expects big things. One slip-up and the stock could drop fast.
⚠️ A P/E over 40–45 means the market expects strong, sustainable growth.If that growth doesn’t show up, the stock won’t just stumble—it could crash.
But here’s the key: P/E doesn’t work well in isolation. Context is everything.
Before judging the number, always ask:
- What sector is this company in?
- What’s the sector average?
- How fast is the company growing?
- Are the profits stable and sustainable?
---------------------------------------
Real-World Examples:
✅ Visa – P/E around 37The average for financial stocks? Usually 10–15.But Visa grows quickly, is highly profitable, and has an ironclad moat.Is it expensive? Yes. But in this case, justifiably so.
✅ Microsoft – P/E around 35Tech-sector average tends to sit between 25–35.Microsoft has consistent growth, high margins, and clear market leadership.A P/E of 35 is absolutely reasonable—as long as the growth story continues.
🤔 But what if Microsoft trades at P/E 50+?
Then you have to ask:Is earnings growth truly supporting that price?Or are you just paying for the brand... and a bit of FOMO?
-----------------
Leave a comment:
What’s the highest P/E you’ve ever paid, and was it worth it?
-----------------
📘 Compounder Cheat Sheet
Don’t just stare at absolute numbers. Always compare within the sector, consider the company’s growth pace and business model. Ask yourself:
“How much am I paying today for what this company will earn tomorrow?”
---------------------------------------
🧩 Summary
Compounders are like good wine, they get better with time.
Find companies that grow steadily, generate profits, keep debt low, and dominate their niche. Hold tight. Stay patient. Let the snowball roll.
Thanks for reading!
If this article was helpful or resonated with you, feel free to like, comment, or share it with a friend! It motivates me more than you’d think. 🙏
And if you’re new here:
🍷 Like good wine, this channel only gets better with time. Follow and let the ideas compound slowly, steadily, and deliciously.
Cheers
Vaido

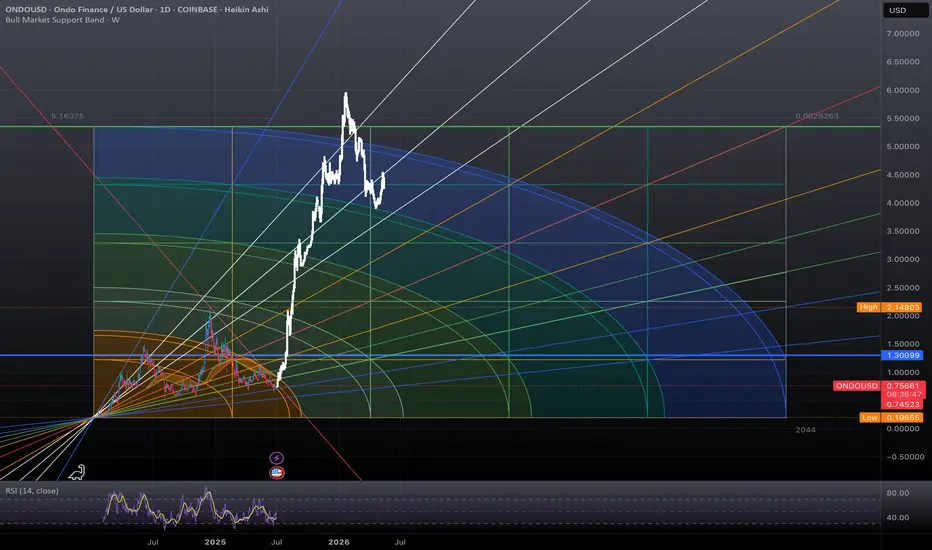
#Ondo Finance this is a possible scenario of how #ondo could play out this cycle if all goes well…. Not financial advice DCA safely
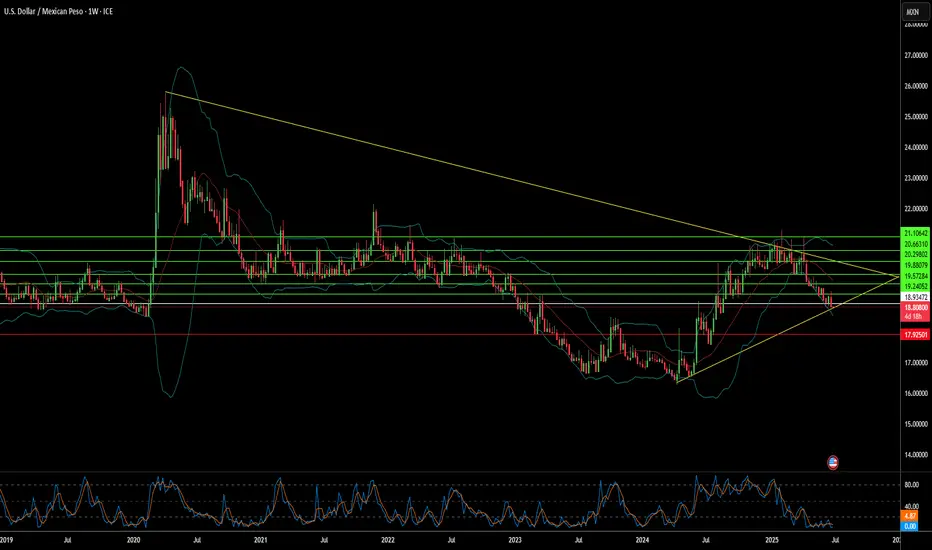
Is Mexico's Peso at the Crossroads?The recent imposition of U.S. sanctions on three Mexican financial institutions - CIBanco, Intercam Banco, and Vector Casa de Bolsa - has ignited a crucial debate over the Mexican peso's stability and the intricate dynamics of U.S.-Mexico relations. Washington accuses these entities of laundering millions for drug cartels and facilitating fentanyl precursor payments, marking the first actions under new anti-fentanyl legislation. While these institutions collectively hold a relatively small portion of Mexico's total banking assets (less than 3%), the move carries significant symbolic weight and prompts a re-evaluation of the peso's outlook. The Mexican government, under President Claudia Sheinbaum, swiftly rejected the allegations, demanding concrete evidence and initiating its investigations, including the temporary regulatory intervention of CIBanco and Intercam to safeguard depositors.
Economically, the peso faces a nuanced landscape. Before the sanctions, the Mexican peso (MXN) demonstrated remarkable resilience, appreciating significantly against the dollar, bolstered by Mexico's comparatively higher interest rates and robust trade flows with the U.S. However, the recent divergence in monetary policy, with **Banxico** easing rates while the U.S. Federal Reserve maintains a hawkish stance, now presents a potential headwind for the peso. While analysts generally suggest limited systemic risk to Mexico's broader financial system from these targeted sanctions, the action introduces an element of uncertainty. It raises concerns about potential capital flight, increased compliance costs for other Mexican financial institutions, and a possible erosion of investor confidence, factors that could exert downward pressure on the peso.
Geopolitically, these sanctions underscore the escalating U.S. campaign against fentanyl trafficking, now intricately linked with broader trade and security tensions. President Donald Trump's past threats of punitive tariffs on Mexican imports - aimed at curbing drug flows - highlight the volatile nature of this bilateral relationship. The sanctions serve as a potent political message from Washington, signaling its resolve to combat the fentanyl crisis on all fronts, including financial pipelines. This diplomatic friction, coupled with the ongoing complexities of migration and security cooperation, creates a challenging backdrop for the USD/MXN exchange rate. While the U.S. and Mexico maintain a strong intergovernmental relationship, these pressures test the limits of their collaboration and could influence the peso's trajectory in the medium term.
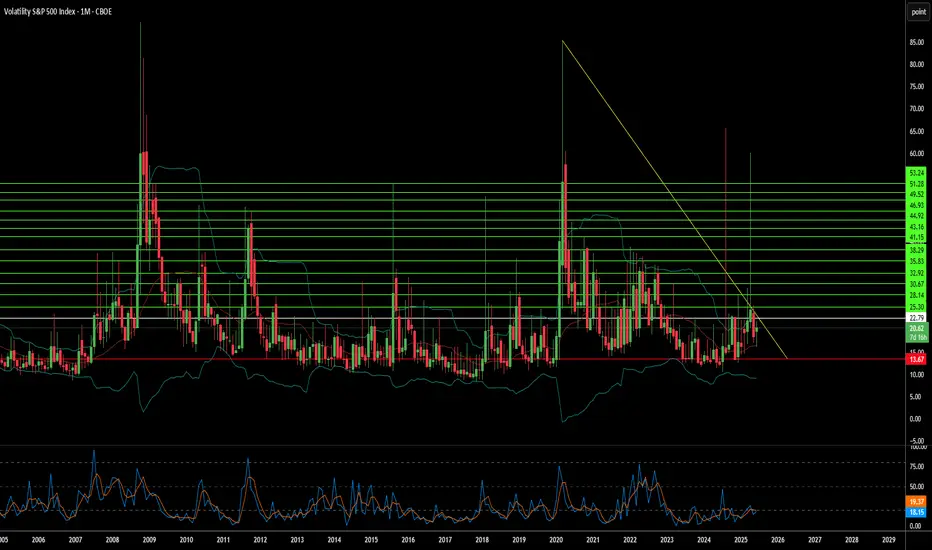
Can Geopolitics Redefine Market Risk?The Cboe Volatility Index (VIX), which analysts widely dub the "fear gauge," currently commands significant attention in global financial markets. Its recent surge reflects profound uncertainty, particularly from escalating geopolitical tensions in the Middle East. While the VIX quantifies market expectations for future volatility, its current elevation signals more than mere sentiment. It represents a sophisticated repricing of systemic risk, capturing the implied probability of significant market dislocations. Investors find it an indispensable tool for navigating turbulent periods.
The dramatic escalation of the Iran-Israel proxy conflict into a confrontation, involving the United States, directly fuels this heightened volatility. Israeli airstrikes on Iranian military and nuclear facilities on June 13, 2025, prompted swift Iranian retaliation. Subsequently, on June 22, the U.S. launched "Operation Midnight Hammer," conducting precision strikes on key Iranian nuclear sites. Iran's Foreign Minister immediately declared diplomacy over, holding the U.S. responsible for "dangerous consequences" and vowing further "punishment operations," including a potential closure of the Strait of Hormuz.
This direct U.S. military intervention, particularly targeting nuclear facilities with specialized munitions, fundamentally alters the conflict's risk profile. It moves beyond proxy warfare into a confrontation with potentially existential implications for Iran. The explicit threat to close the Strait of Hormuz, a critical global chokepoint for oil supplies, creates immense uncertainty for energy markets and the broader global economy. While historical VIX spikes from geopolitical events often prove transient, the current situation's unique characteristics introduce a higher degree of systemic risk and unpredictability. The Cboe VVIX Index, measuring the VIX's expected volatility, has also risen to the higher end of its range, signaling deep market uncertainty about the future trajectory of risk itself.
The current environment necessitates a shift from static portfolio management to a dynamic, adaptive approach. Investors must re-evaluate portfolio construction, considering long exposure to volatility through VIX instruments as a hedging mechanism, and increasing allocations to traditional safe havens like U.S. Treasuries and gold. The elevated VVIX implies that even the predictability of market volatility is compromised, demanding a multi-layered risk management strategy. This specific confluence of events might signify a departure from historical patterns of short-lived geopolitical market impacts, suggesting geopolitical risk could become a more ingrained and persistent factor in asset pricing. Vigilance and agile strategies are paramount for navigating this unpredictable landscape.
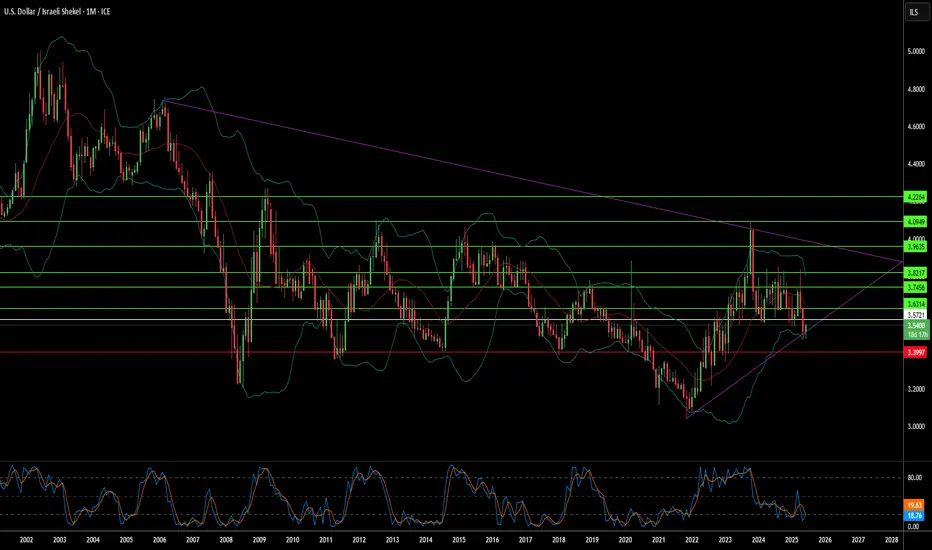
Uncertainty: The Dollar's Unexpected Ally?The recent strengthening of the US dollar (USD) against the Israeli shekel (ILS) serves as a potent illustration of the dollar's enduring role as a safe-haven currency amid heightened geopolitical uncertainty. This trend is particularly pronounced in the context of escalating tensions involving Iran, Israel, and the United States. Investors consistently gravitate towards the perceived stability of the dollar during periods of global unrest, leading to its appreciation against more volatile and susceptible currencies, such as the shekel.
A significant driver of this dollar demand stems from the precarious security landscape in the Middle East. Reports detailing Israel's potential operation into Iran, coupled with the United States' proactive measures like authorizing voluntary departures of military dependents and preparing for a partial evacuation of its Baghdad embassy, signal Washington's anticipation of potential Iranian retaliation. Assertive declarations from Iranian officials, explicitly threatening US military bases and claiming intelligence on Israeli nuclear facilities, further amplify regional risks, compelling investors to seek the dollar's perceived safety.
Compounding this geopolitical volatility is the stalled US-Iran nuclear diplomacy. Hurdles persist not only over core issues, such as uranium enrichment and sanctions relief, but also over the basic scheduling of talks, with both sides expressing diminishing confidence in a resolution. The recent International Atomic Energy Agency (IAEA) Board of Governors meeting, where the US and European allies introduced a non-compliance resolution against Iran, adds another layer of diplomatic tension, threatening increased sanctions or nuclear expansion and reinforcing the perception of a volatile environment that inherently strengthens the dollar.
These escalating tensions have tangible economic repercussions, further fueling investor flight to safety. The immediate aftermath has seen a significant increase in oil prices due to anticipated supply disruptions and a notable depreciation of the Iranian rial against the dollar. Warnings from maritime authorities regarding increased military activity in critical waterways also reflect broad market apprehension. During such periods of instability, capital naturally flows into assets perceived as low-risk, making the US dollar, backed by the world's largest economy and its status as a global reserve currency, the primary beneficiary. This flight-to-safety dynamic during major regional conflicts involving key global players consistently bolsters the dollar's value.
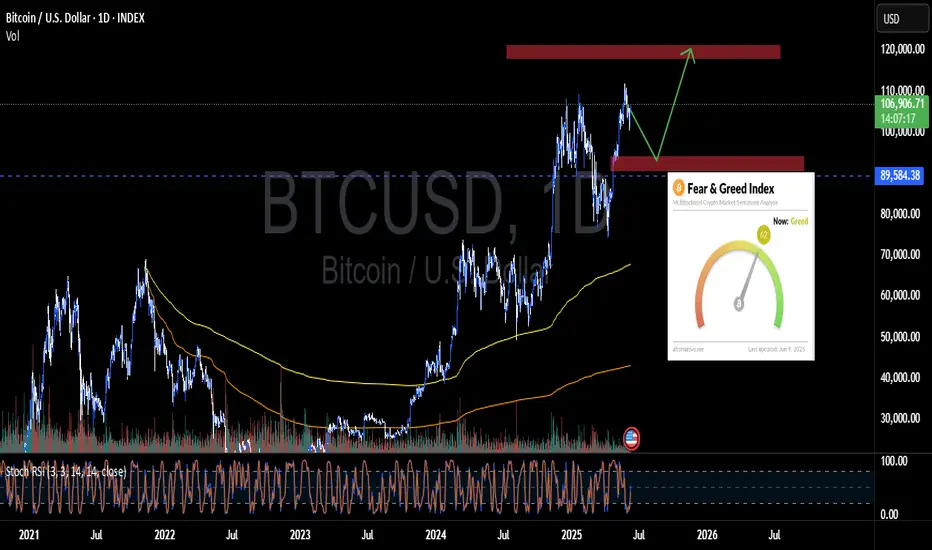
Bitcoin Weekly Outlook – June 9, 2025Bitcoin ( BINANCE:BTCUSDT ) continues to maintain its bullish structure, now trading around $106.6K. While price action looks strong, the market is approaching a key resistance zone between $110K–$120K, with technical signals hinting at a possible short-term rejection before further upside.
🔍 Technical Overview
Current Price: $106,654
Resistance Zone: $110K – $120K
Support Zone for Pullback: $98K – $100K
200 EMA & 100 EMA: Still trending up and providing strong base support
The chart suggests a potential "rejection-retest-rally" structure forming, where BTC may temporarily pull back before making a fresh push toward new highs.
📊 Momentum & Indicators
Stochastic RSI on the daily timeframe recently bottomed and is starting to curl back up — a potential bullish shift in momentum
Volume remains stable — no signs of aggressive distribution or FOMO activity yet
💬 Sentiment & Structure
The current structure remains healthy, with HH-HL (higher high - higher low) formation intact. Market sentiment is optimistic but not yet euphoric, which is ideal for continued accumulation.
Short-term traders may look for a pullback opportunity near the $98K–$100K zone before re-entering.
🎯 Mid-Term Outlook
If BTC holds the $98K–$100K range during a pullback, it could act as a springboard toward the $120K target in the coming weeks.
✅ Summary
🔵 Bullish trend intact
📉 Possible short-term pullback before breakout
📈 Mid-term target remains: $120K
🚫 Avoid chasing breakouts — position wisely at key supports
Let the price come to you. Patience pays more than FOMO.
RVYL indicating massive >600% profit potential near term!?!?massive short cover rally about to occur on this ticker... looking for progression above entire prior sell/consolidation structure on daily & wkly timeframes.
near term buy-side targets at 3.3-3.80$ levels.
long term, buy side target is at 8$
extra-ordinarily bullish on this one

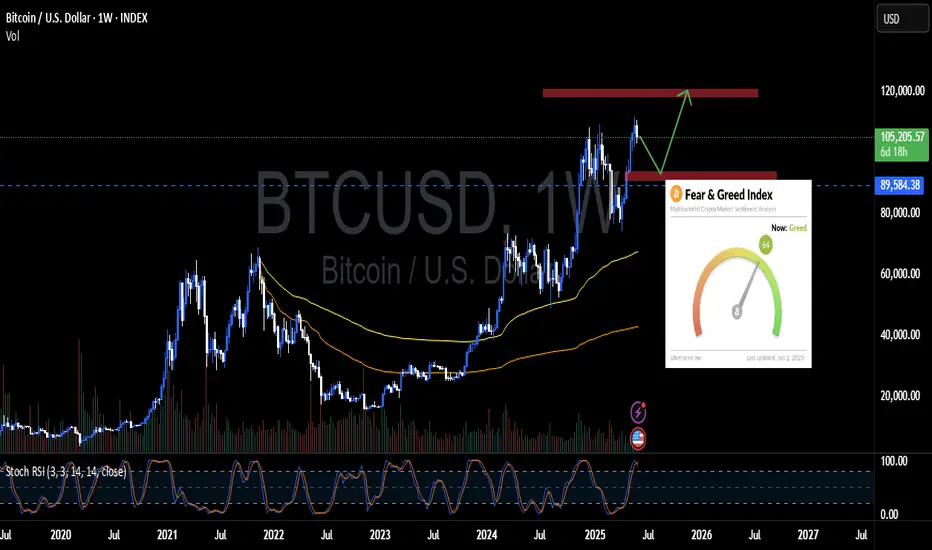
Bitcoin Weekly Outlook – June 2, 2025
Bitcoin ( BINANCE:BTCUSDT ) is holding strong above the psychological $100K mark, maintaining its bullish market structure on the weekly timeframe. However, technical indicators are flashing early signs of a possible short-term correction before another leg up.
🔍 Technical Analysis:
Current price: $105.1K
Key support zone: $89K (strong demand area + weekly structure retest)
Resistance to watch: $120K (major weekly supply zone + psychological level)
Stochastic RSI is currently overbought at 94+, which historically tends to trigger a healthy retracement before further upside continuation.
📊 Market Structure:
BTC remains well above the 200-week EMA, keeping bullish momentum intact
Higher Highs and Higher Lows are still in play
Volume is steady, showing no major distribution at the moment
📈 Sentiment Check:
Fear & Greed Index: 64 (Greed)
→ Suggests bullish sentiment is high
→ Greed often precedes short-term pullbacks or consolidation
🧭 Outlook:
A short-term correction toward the $89K–$92K zone is likely, as part of a healthy market cycle.
If support holds, BTC could rally back up with a mid-term target around $120K.
✅ Summary:
🔵 Bullish structure still intact
⚠️ Overbought signal = possible retracement
🎯 Mid-term target: $120K
🧘♂️ Don’t chase — wait for price to breathe, not break
Let the market come to you. Trade smart, not just hopeful.
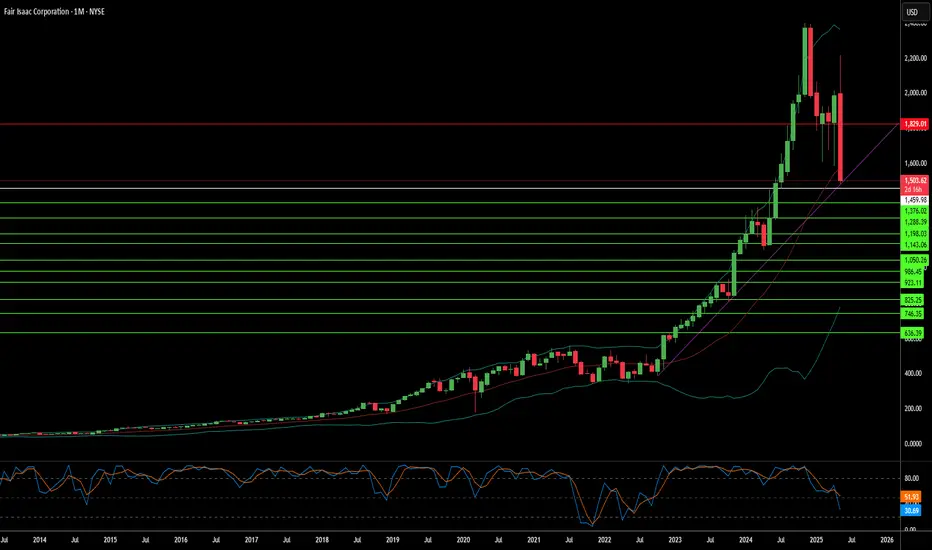
FICO's Monopoly: Cracks in the Credit Kingdom?For decades, Fair Isaac Corporation (FICO) has maintained an unparalleled grip on the American credit system. Its FICO score became the de facto standard for assessing creditworthiness, underpinning virtually every mortgage, loan, and credit card. This dominance was cemented by a highly profitable business model: the three major credit bureaus—Equifax, Experian, and TransUnion—each paid FICO for independent licenses, generating a significant percentage of revenue per inquiry and establishing a seemingly unassailable monopoly.
However, this long-standing reign now faces an unprecedented challenge. The Federal Housing Finance Agency (FHFA) Director, Bill Pulte, recently signaled a potential shift to a "2-out-of-3" model for credit bureaus. This seemingly technical adjustment carries profound implications, as it could render one of FICO's three bureau licenses redundant, potentially evaporating up to 33% of its highly profitable revenue. Director Pulte has also publicly criticized FICO's recent 41% increase in wholesale mortgage score fees, contributing to significant declines in FICO's stock price and drawing broader regulatory scrutiny over its perceived anti-competitive practices.
This regulatory pressure extends beyond FICO's immediate revenue, hinting at a broader dismantling of the traditional credit monopoly. The FHFA's actions could pave the way for alternative credit scoring models, like VantageScore, and encourage innovation from fintech companies and other data sources. This increased competition threatens to reshape the landscape of credit assessment, potentially leading to a more diversified and competitive market where FICO's once-unchallenged position is significantly diluted.
Despite these formidable headwinds, FICO retains considerable financial strength, boasting impressive profit margins and robust revenue growth, particularly within its Scores segment. The company's Software segment, offering a decision intelligence platform, also presents a significant growth opportunity, with projected increases in annual recurring revenue. While FICO navigates this pivotal period of regulatory scrutiny and emerging competition, its ability to adapt and leverage its diversified business will be crucial in determining its future role in the evolving American credit market.
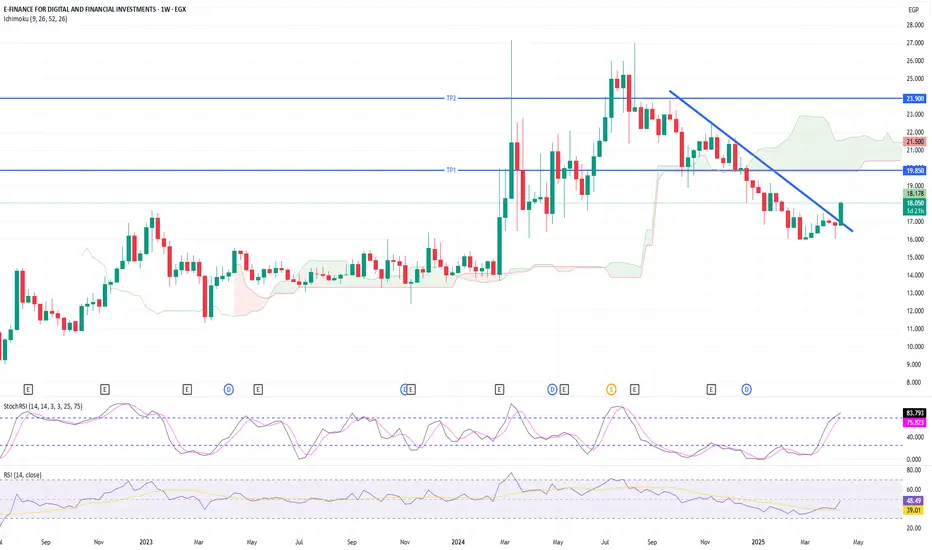
E-Finance Breakout: Trendline Breach Signals Fresh Upside PotentE-Finance (EGX) has just broken out of a descending trendline on the weekly chart, supported by momentum indicators turning bullish. The Ichimoku cloud shows that the price is attempting to re-enter bullish territory. With the MACD turning positive and the Squeeze Momentum shifting green, this breakout may be the start of a medium-term rally.
📌 Trade Plan
📥 Entry Zone: Between 17.50 – 18.25 EGP (current price or on a slight dip)
🎯 Take Profit Targets:
TP1: 19.85 EGP (upper Ichimoku cloud resistance)
TP2: 24.00 EGP (previous support-turned-resistance zone)
🛑 Stop Loss: Below 16.50 EGP (under recent swing low & trendline)
⏱️ Time Horizon: Medium-term (4–8 weeks)
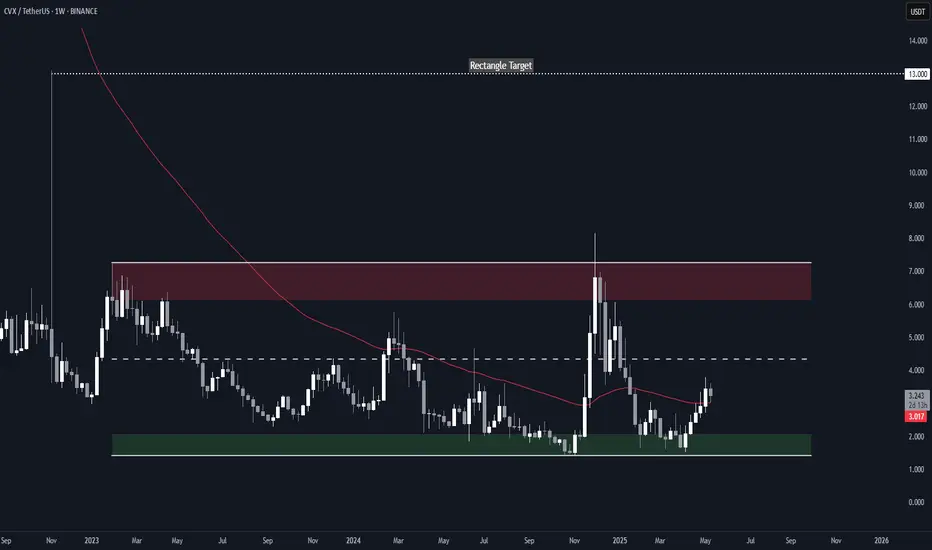
Convex Finance (CVX) Rectangle (1W)BINANCE:CVXUSDT has been trading in a rectangle with well-defined boundaries since January 2023, and it has recently reclaimed the 1-year EMA, potentially shifting the bias to bullish.
Key Levels to Watch
• $1.5-$2.0: Main demand zone and invalidation point for any bullish TA if broken
• $3.0: 1-year EMA, successfully reclaimed and retested as support
• $4.4: Rectangle midline, previously relevant as a S/R
• $6.1-$7.2: Main supply zone and upper boundary of the rectangle
• $13.0: Previous swing high and rectangle breakout target, which would be confirmed by a weekly close above $7.2 with good volume
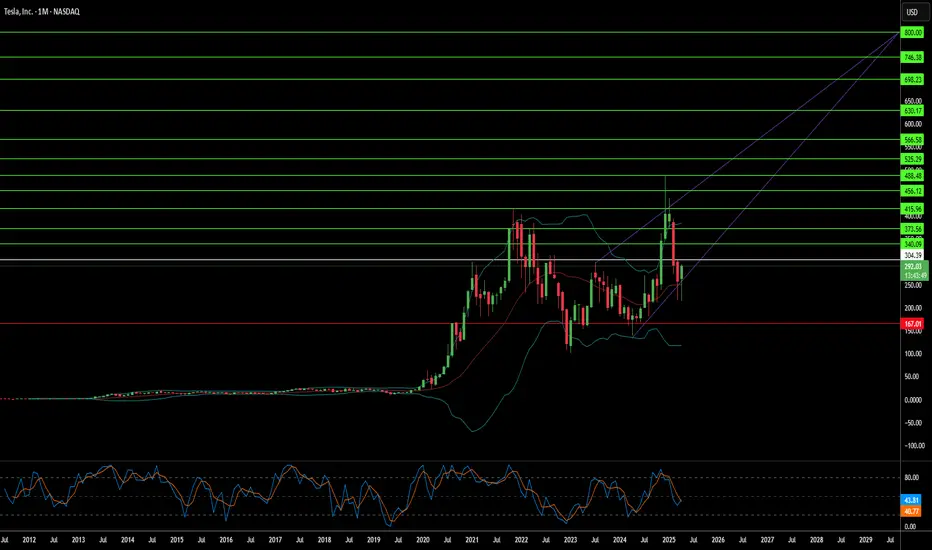
Is a Tesla Stock Rebound Imminent?Tesla's stock has recently faced volatility, partly due to first-quarter 2025 delivery figures that did not meet some market expectations. Despite this, several significant factors suggest a potential for upward movement in the share price. As the stock hovers around $292 in late April 2025, market observers are closely watching for catalysts that could shift sentiment and drive value appreciation for the electric vehicle and energy company.
Key indicators pointing towards a potential rebound include notable insider activity and the highly anticipated launch of a dedicated robotaxi service. A Tesla board member and Airbnb co-founder recently purchased over $1 million in TSLA stock, marking the first insider buy of this magnitude in approximately five years. This action signals strong internal confidence. Furthermore, the planned June launch of a robotaxi service in Austin, Texas, using autonomous Model Y vehicles, is viewed as a transformative step that could open substantial new revenue streams and redefine Tesla's market position.
Adding to the bullish sentiment is unusual activity in the options market, where a significant investor placed a large bet on a substantial price increase in the near term through out-of-the-money call options. While recent delivery misses and concerns regarding external factors have contributed to past stock pressure, the combination of insider conviction, a looming disruptive service launch, and aggressive bullish options trading suggests that the market may be poised for a significant reaction to upcoming positive developments. Investors are keenly focused on the successful execution of the robotaxi strategy as a critical determinant of future stock performance.
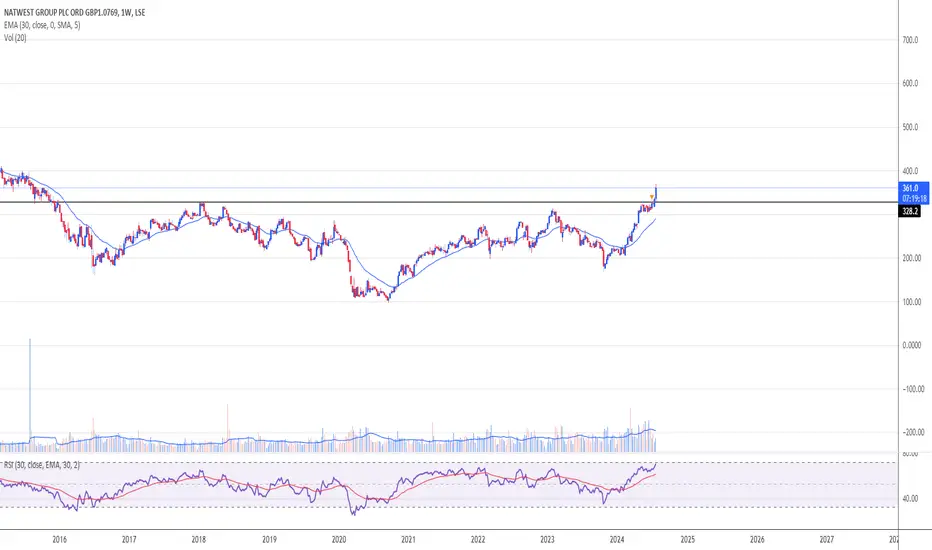
Nat West breakoutClear breakout from 327, which was established resistance since 2016. Inverse Head and Shoulders pattern completed.
Volumes have been ramping up since Feb this year and the shares are not oversold on the weekly RSI yet.
Market likes their results today too.
In my opinion, heading for 400p.
Do your own research and this is NOT a solicitation to hold, buy or sell.