BITCOIN | Full of Bearish Pressure!Hi,
Over a year, we can say that the price of Bitcoin is in the bearish market. Do you want it or not but we have several confirmations from the price action which confirms that it is true.
Bearish confirmations from the Daily timeframe:
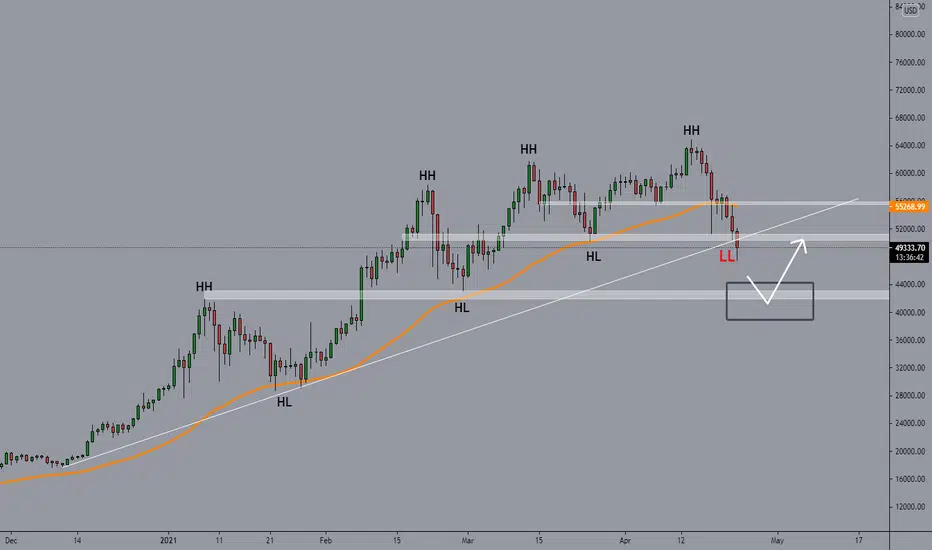
1. The correction from the top is more than 26% (standard bearish market definition is 20% correction from the top)
2. Almost all the bullish trendlines are broken, the drawn white trendline needs a Daily candle close below of it and it will be confirmed - basically the key criterion.
3. We have a first lower low (LL) since Sept. of 2020
4. We have Daily candle closes below 50EMA. Haven't seen it since Oct. of 2020
These are major criteria that allow me to think that the bearish market has started. I don't know how long it will last but still, I want to point out some areas which can play important role in the further price action.
The first important area comes around 40k, if the price falls lower than the current price then I think this price zone will stop it and even can produce reversals (if the price reaches there I will make an update).
It depends on how today's candle will close. If it closes below the trendline the 50k retest and we are going approach 40k.
I'll start to write a long post but I started to think that the whole concept of this will be ruined after today's candle closes above 50k and above the trendline.
So, take this post as an alert and you have been worn ;)
Stay healthy,
Vaido
Finance
EURNZD H4 - Long SetupEURNZD H4
This is exactly what we wanted to see when we marked this up yesterday, a bit of a correction from resistance to then break on the second attempt.
This just means we shouldn't expect such a big correction after we (hopefully if) break resistance price of 1.68.
Looking to break 1.68 resistance, retest as support and trade long up to 1.69700 ish. Massive 1:7 on that basis.

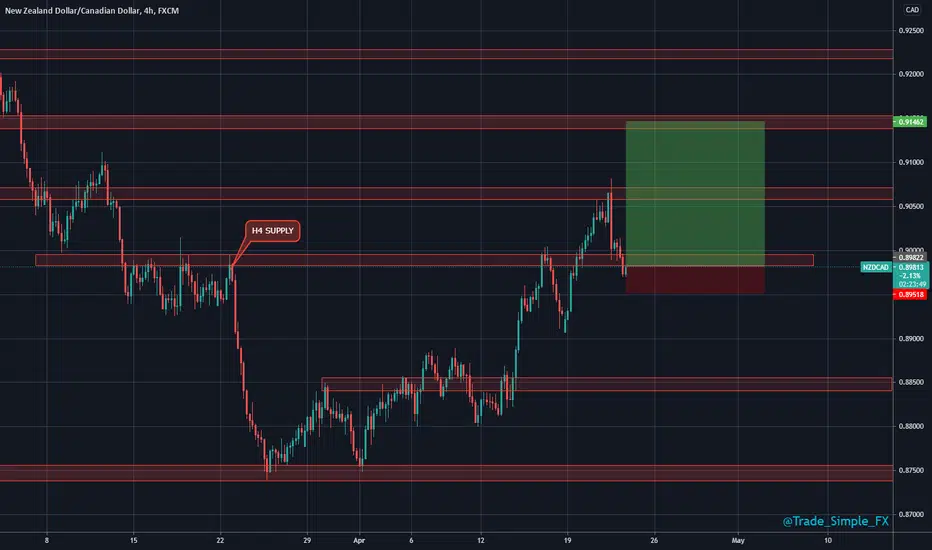
NZDCAD H4 - LONG SETUPNZDCAD H4
Little bit dangerous here as it looks like we have marginally cracked beneath support and we are trading sub 0.90.
However, we are still evidently up-trending, fib pullbacks tie in nicely with our 618 support zone. And no doubt looking to the left we still have an element of support. Currently jumped in this with a small 0.3% risk, 1:5R.
Should be able to jump out if I get in trouble.
#GBPUSD 21 04 2021#GBPUSD 21 04 2021
At the end of February, the price reversed from the strong resistance zone 1.416 where the lines of June 2018 and March 2013 intersect. After that, the price began to fall and formed a downward channel. Falling in this channel, the price came to the support line 1.375. This line was formed in April 2020 and is quite strong despite breakouts. Its strength was enough for the price to start a strong growth after touching it. As a result, the price was able to break through the border of the 1.389 channel. However, it is already clear that she turned around and return to the channel. I expect that the breakout will be false, the price will break the 1.388 support line again, fall and come to the 1.377 support line. This will be our goal.

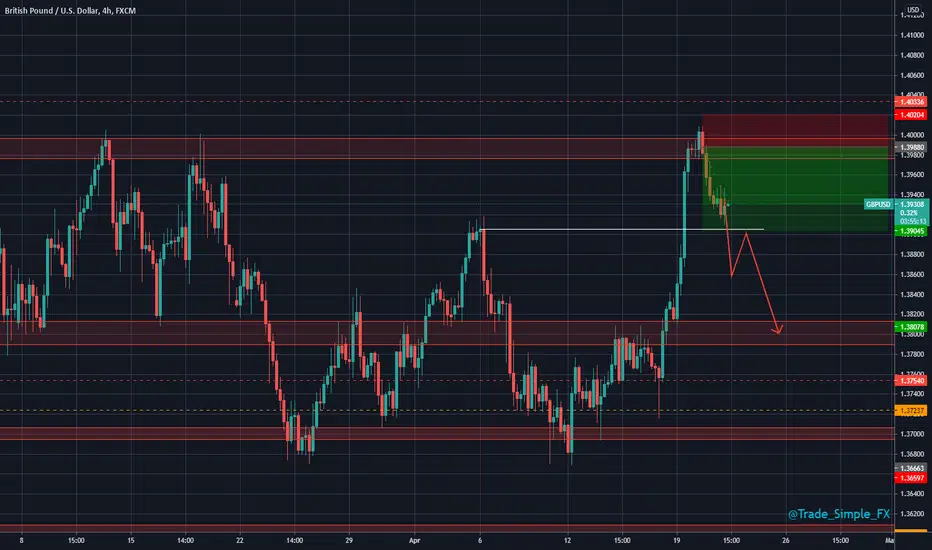
GBPUSD H4 - Short SetupGBPUSD H4
Sold off perfectly from our 1.40 handle, real sticking point resistance price. Sold off with ease down to 1.39, 100 pips without a H4 pullback. Now starting to see a bit of a correction.
Need to break 1.39 support and then we could set our eyes on potential moves down to 1.38.
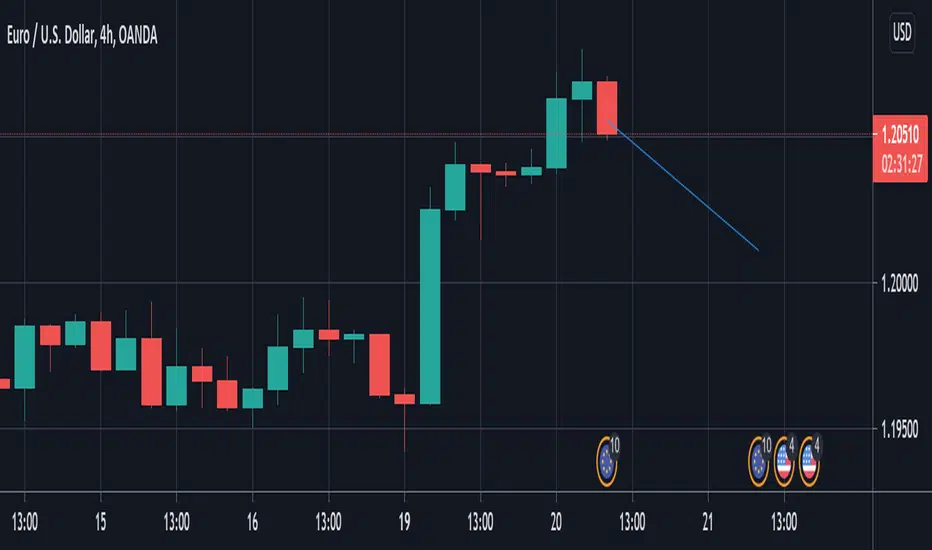
#EURUSD 20 04 2021#EURUSD 20 04 2021
The price continues to stand at the resistance line in the area of 1.207 and therefore I extend my previous forecasts - I continue to expect a fall from the resistance. Let me remind you that since March last year, the price has been moving in an upward trend. In January of this year, it fell from the upper bound of the trend - 1.237 to its lower bound 1.171. The touch happened in April. After that, the price began to grow, broke through the support of August 2020 - 1.195 and touched the resistance line of October 2019 - 1.207. we expect the price to fall from this point and come to the 1.184 support line.
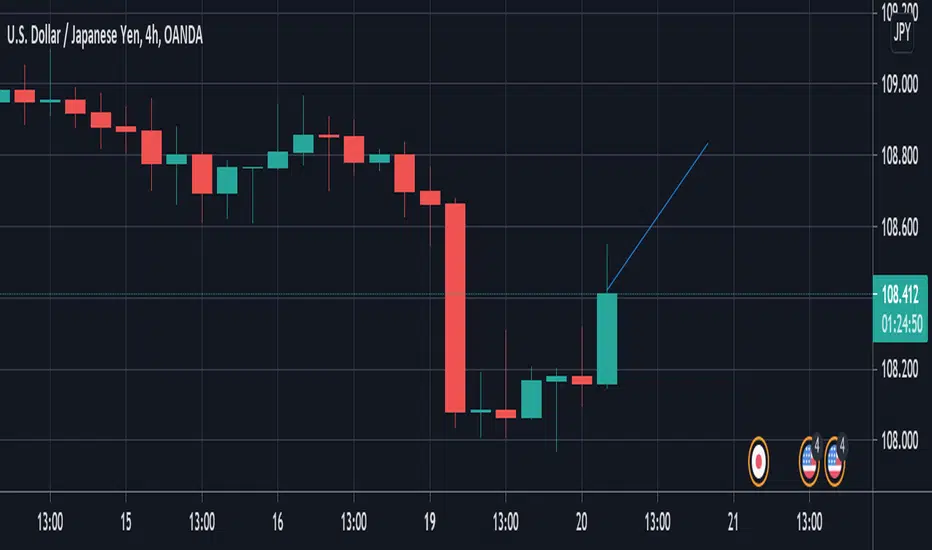
#USDJPY 20 04 2021#USDJPY 20 04 2021
The price is at the support line, getting ready to make a correction to the fall and rise to the reversal. Let me remind you that during the growth in a downtrend, at the beginning of this year the price bounced off the support line 102.58. After that, it rose strongly and stopped only at the resistance zone of 110.69. At the point where the lines of 2015 and 2013 intersect. After touching this zone, the price dropped, but stopped at the 2017 support line 108.33. There is also a strong level of support. I continue to expect the price to bounce off this support and rise again to resistance. Thus, my final target is the resistance line 110.43.
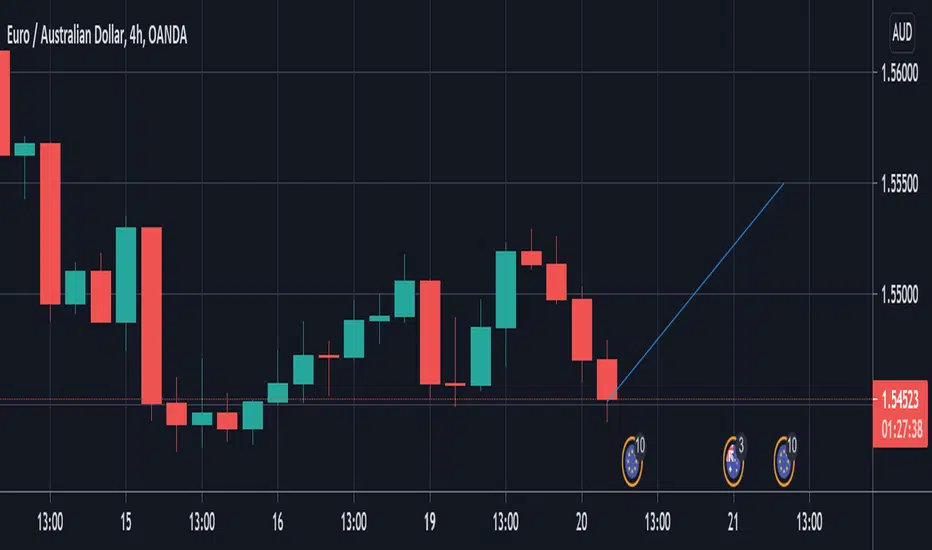
#EURAUD 20 04 2021#EURAUD 20 04 2021
In October 2020, the price touched the resistance line at 1.677. This is a very strong line - the border of the main trend formed in July 2013. After touching the resistance level , the price fell and formed a downtrend. In March of this year, the price touched the support zone 1.527, started to rise and broke through the trend line 1.543. After that, the price continued to rise and worked out several corrections within the resistance line 1.568. The price touched this line again last week and is now falling. I expect it to go down to the 1.531 support zone, where the July 2013, March and August 2012 support lines intersect. Then it will rebound and return to the resistance line 1.570. This will be our goal of support level
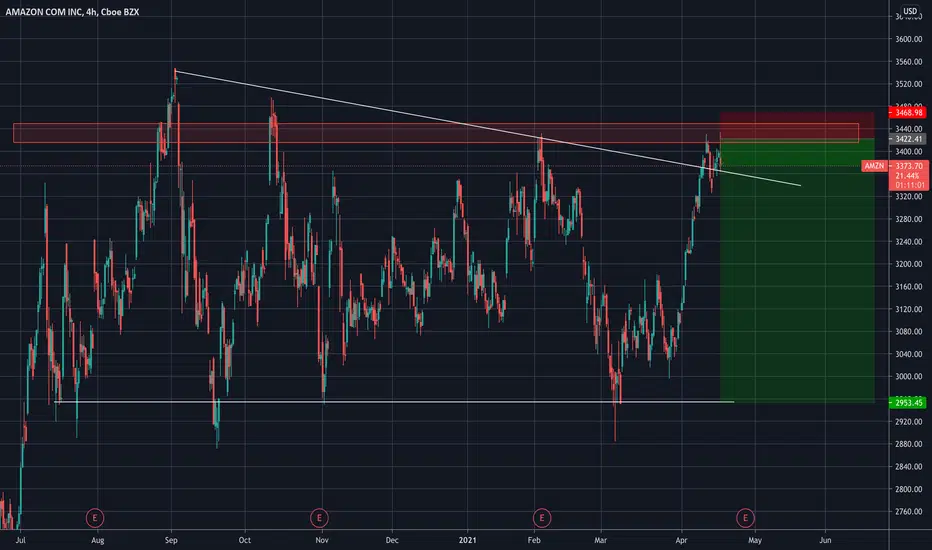
AMZN H4 - Long SetupMissed the top entry as I've been too focussed on crypto markets today, however this circa 300 day trading range seems like it wants to see another range fill.
3425 down to 2950 could be witnessed again with a huge 1:11R potential if we push 3400 again, I'll look to grab an entry. ALERT SET!
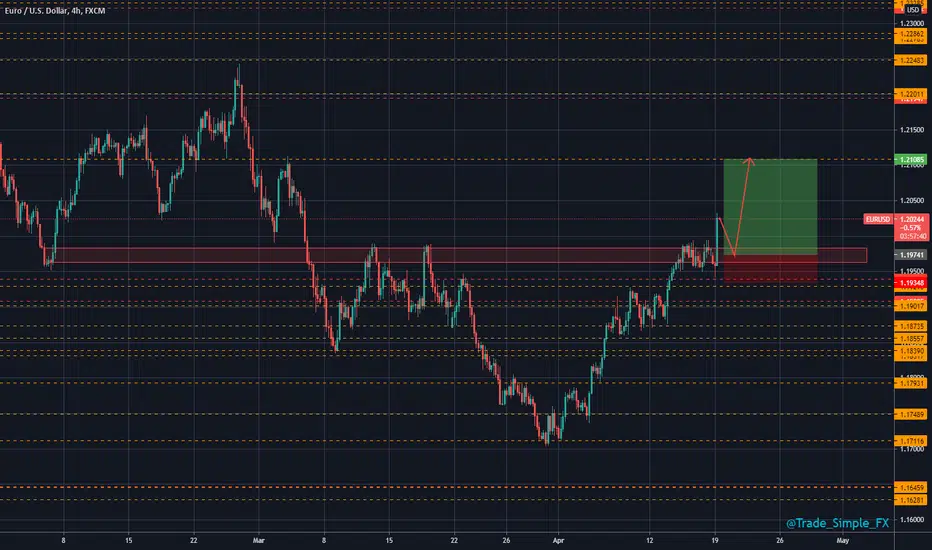
EURUSD H4 - Long SetupEURUSD H4
A strong H4 break here on EU, waiting for a correction back down towards our hopefully newly found support zone, we can simply look to scout out long entries from here up to breakout high initially and then towards our 1.21 region, area of resistance and weekly key level.
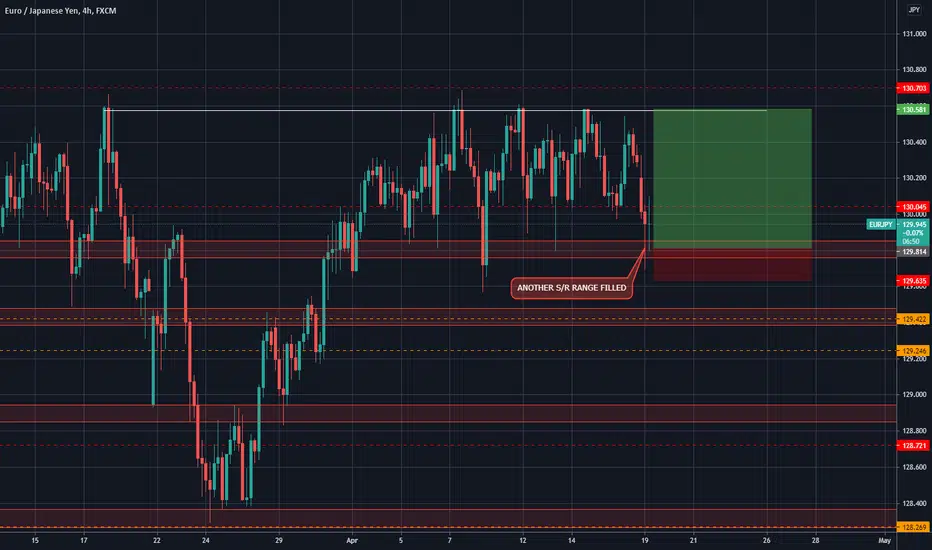
EURJPY H4 - Long Trade SetupEURJPY H4
Based on last weeks resistance we saw a downside gap here on EJ followed by bearish continuations pulling us all the way down to our 129.800 support price.
Since, we have seen some sizeable wicks, interested to see where this H4 closes in 10 minutes. Possible second opportunity from support back up to resistance.
#EURUSD 19 04 2021#EURUSD 19 04 2021
Since March 2020, the price has been moving in a global upward channel. And during this movement at the beginning of this year, it touched the resistance line 1.237 - the upper border of the channel. Then the fall began. And now we see that falling in the channel the price has come to the lower border of the main uptrend in the support zone of 1.170. In addition to the channel line, there is also a support line for October 2019 and March 2020. From this zone, the price showed excellent growth and in three weeks rose to the resistance line 1.198. Now I expect the price to fall from this line and consolidate in the 1.179 support zone. After which he will receive a strong support, he will begin to grow. The price will break the line 1.193, fix at the local price level 1.196 and rise to the resistance line 1.216. This will be our goal

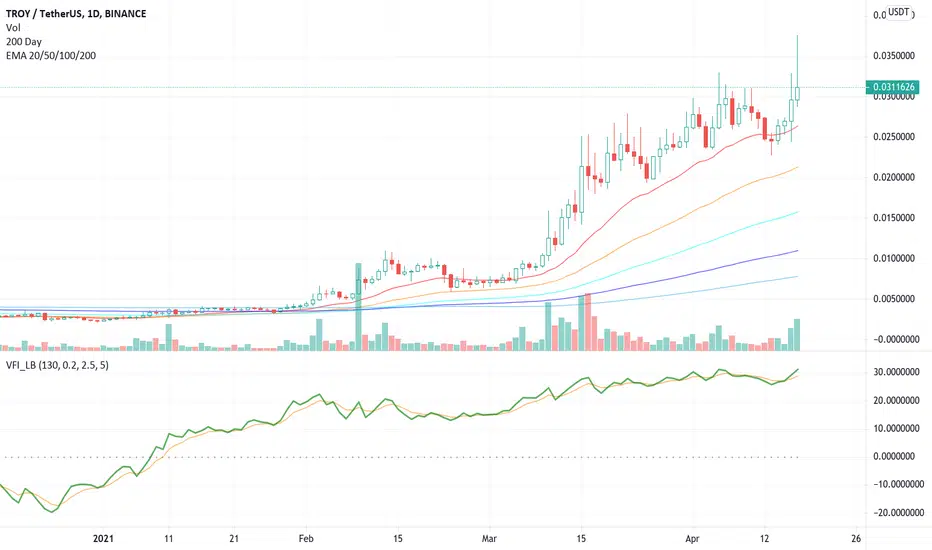
Troy continues to climb perfectly before swap. ($TROY)Helen of Troy! Zoom out to the big picture and buy the dip. Troy is setting up as a massive win for all those seeking new value from DOGE and XRP gains. Swap and airdrop coming shortly.
DeFi play TROY is a Smart Hybrid Asset Management System offering yield farming, fixed savings, a liquidity aggregator (for Binance, Huobi, OKex, Uniswap, Curve, Balancer), provider of arbitrage opportunities, etc.
What is Troy Trade?
Troy Trade is a global prime broker specialized in crypto trading and asset management. It provides crypto brokerage services for institutional clients and professional traders with products such as spot & margin trading, derivatives, data, custody, lending, and staking in one account.
Master-level Trading Platform: One account with a single interface enables access to the aggregated liquidity of crypto exchanges. Some key functions include smart order routing, flexible account management, settlement service, and automatic risk control.
Data Analytics: Empower customer’s decision making with a data matrix framework. Data categories include blockchain data, trading data, market data, social data, and media data optimized by AI and quantitative models.
Brokerage Service: Competitive fee rate and order execution speed. Real-time fund transfer and settlement service. Provide margin trading and OTC services with advanced convenience.
Full-stack Quantitative Solutions: Infrastructure powered by co-location service to better the performance of high-frequency trading algorithms. Offer exposure to quantitative solutions with straight-through processing, precise tick historical data, and strategy assessment systems.
What is the TROY Token?
Functions as the medium of exchange in this organic network
Provides workload reward of Relayer network to encourage timely and accurate updating, broadcasting, and synchronizing orders
Serves as relay medium for the exchange of unconventional token trading pairs in-ring matching
Acts as the trading fee unit when users call up the trading and settlement functions
Means of access to features in Troy and burnt as gas fees
Incentives for brokers and to reward brokers contributing to maintaining a global ecosystem
FInancial advice disclaimer in signature. DYOR.
Good luck.
EURUSD 15 04 2021#EURUSD 15 04 2021
The price is now at the 1.196 support line, which has been on the chart since August 2020. The price came to this point by pushing off from the 1.171 support line - this line was formed in March 2020 and is the border of the global ascending channel. Since the price has such strong global support, and no less strong local support, I expect that now the price will continue to rise and touch the resistance zone 1.208, where the two strong lines of October 2019 and February 2020 intersect. After that, the estimate will turn around and return to support 1.184. This will be our goal.

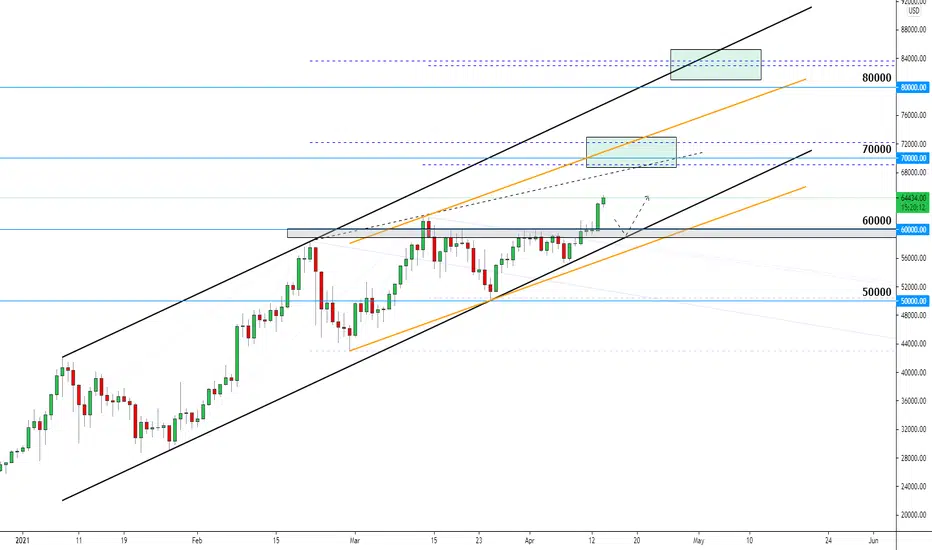
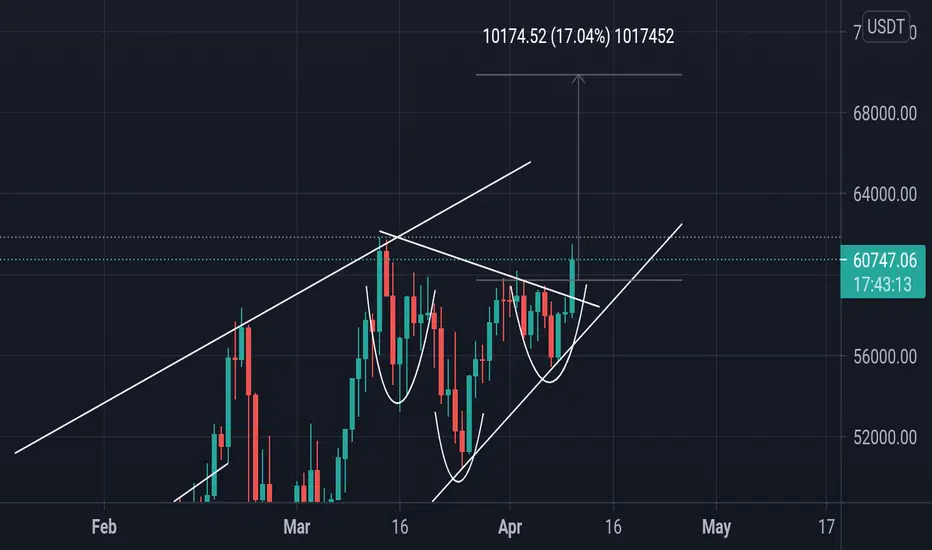
BITCOIN | Possible Targets & How To Identify Them!?Hi,
I get a lot of questions, and even I have seen a lot of bets, where the price of Bitcoin goes? So, let's do it the same! Leave a comment and tell us your thoughts about where it goes, is it 70k or 80k or 120k, name it, and say why you think so - is it just a guess or you have some technical criteria to look for. The most accurate call will win free technical analysis of your favorite altcoins ;) The game ends after we have seen at least a 17-20% correction.
The target areas.
To predict and narrow the price levels above the ATH is quite tough, luckily I have some tools which have helped me to do that. Obviously, they aren't so precise to start to short from there but they can be a good partial take profit areas.
Tools that might help you to find take profit places:
1. Channels - the upper trendline of the channel can be very precise resistance level from time to time.
2. Channel projections - quite often the price moves in channels, as you see on the image, black lines form a perfect channel. Channel projection assuming that it starts to form a channel. You need two dots to draw the trendline below the candles and one dot above the candles to copy/paste the lower trendline to the high-dot. Channel projection is the orange lines in the chart. Short-term very good to predict bounces.
3. Equal waves of AB=CD, will not explain it but perfect if the AB=CD matching perfectly with channel projection.
4. Fibonacci Extensions are also quite good to predict take profit areas.
5. Round numbers, psychological numbers.
So, using these tools I found some areas to keep an eye on. The first target area will stay around 70k. There is a minor trendline, channel projection, 2x equal waves of AB=CD, Fibo Extensions and 70k will act as a round number. At the moment, they all act as resistance levels and matching quite perfectly with each other around 70.
Always look for several criteria to narrow the target area. If you can draw multiple criteria into one place it will give much more power to the potential target/resistance area
As said previously, it is only the target area - full target, partial target, or whatever. Never try to short from these levels. You can start to think about shorting only then when the price has stopped around your identified area, has stayed there to consolidate and lower timeframes offer some price action to keep an eye on. To try to short immediately after the price has reached the area, you will burn your fingers, hands, body and etc. entirely, especially in these market conditions.
The pre-mentioned target area is currently the strongest and nearest but I have put another one a bit higher. It is not the case atm but still, a good example of the channel and AB=CD crossing area. It says slightly above 80k.
Can you jump into the possible another leg upwards? Yes, around 60k will be technically a good place for a retest.
On the weekend I shared in the other site quite a step-by-step break and a retest, which took a bit more time than expected but worked out perfectly - break above 60k and retest afterward, and here we are.
Hopefully, you found something helpful for your further analysis, especially for identifying take-profit places.
Stay healthy,
Vaido

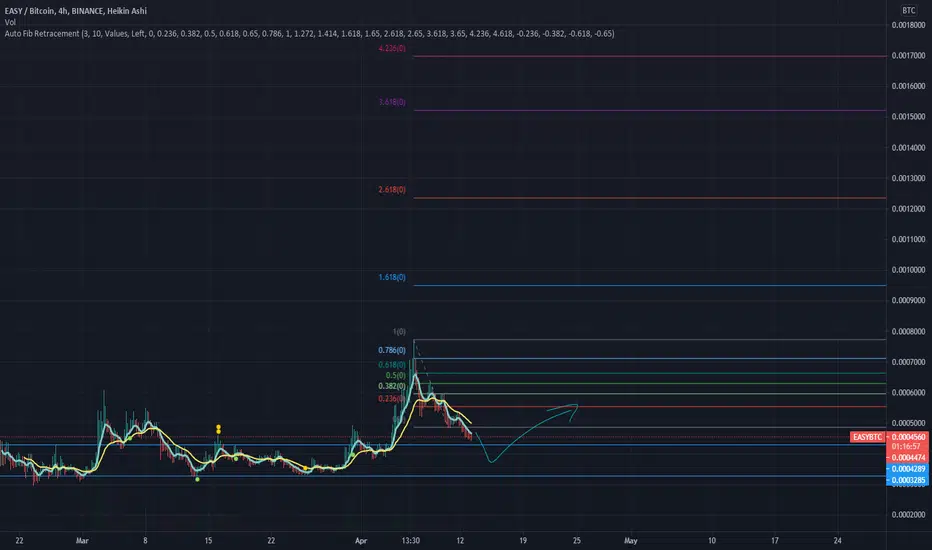
EASY BTCwait for trend reversal BINANCE:EASYBTC
buy when it starts going up
potential BUY ZONE
S/R Flip
DXY H4 - Long SetupDXY H4
Effectively looking for an upside break of the area we have marked.
With regards to fibs and market corrections, this would be a good price, or at least our maximum correction potential before seeing bullish intervention again.
We will have to see what unfolds, but so far USD zones seem to be okay for the moment, which is positive.

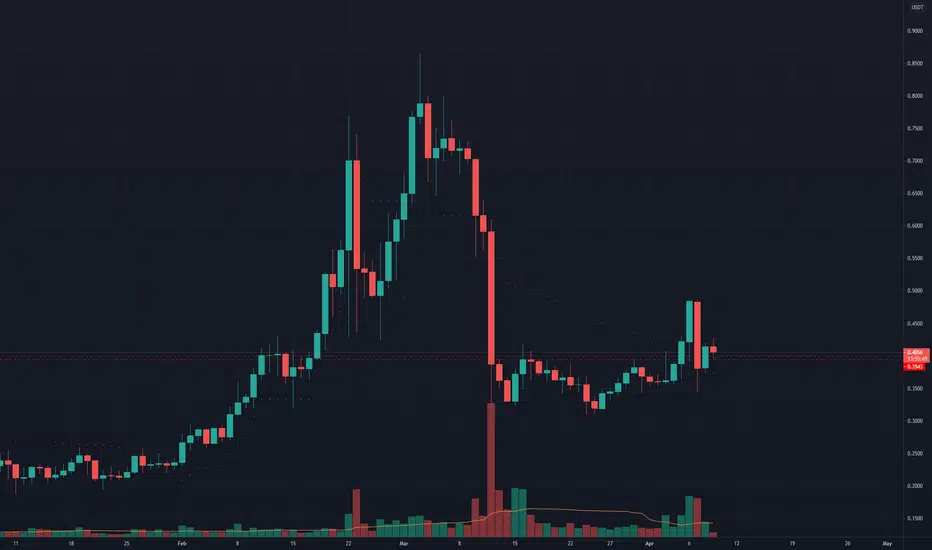
XEMUSDT Support level Approved? Long trend expected?BINANCE:XEMUSDT
XEMUSDT is about to approve Support/resistance level. Should we expect a long trend if approved?
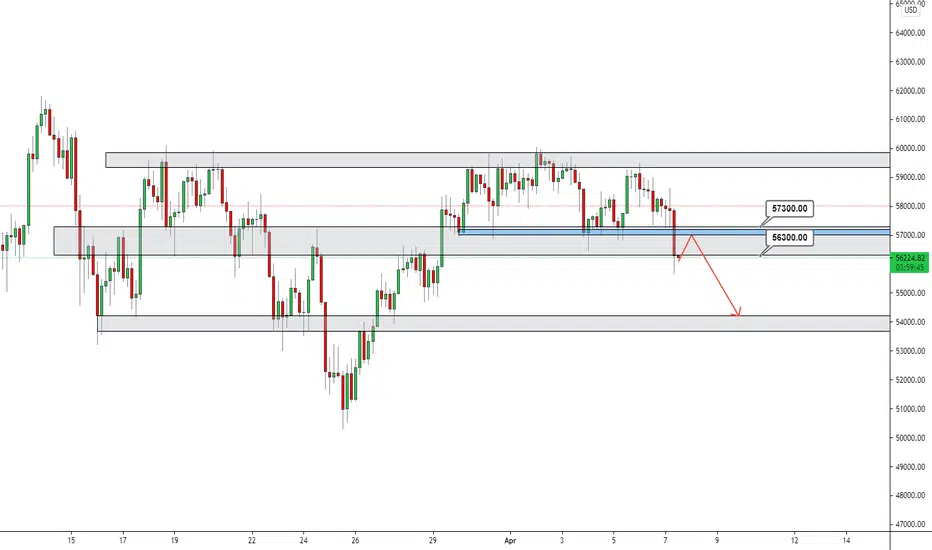
BITCOIN | Confirmed Break, Wait For a Retest & GOHi,
We have quite a clean break of an important price zone. Got a confirmation after the 4H candle close and the price of Bitcoin should continue downwards.
Question is, do the price of BTC come for a retest or not. I want to see the retest inside the gray area, probably starting to build my positions there and the ideal retest area is marked with blue.
Stay healthy,
Vaido
DOT/USDT LOOKING FOR ANOTHER LEG UP Hey hey my friends! 👋
DOT here for a new price discovery phase about to happen 🚀