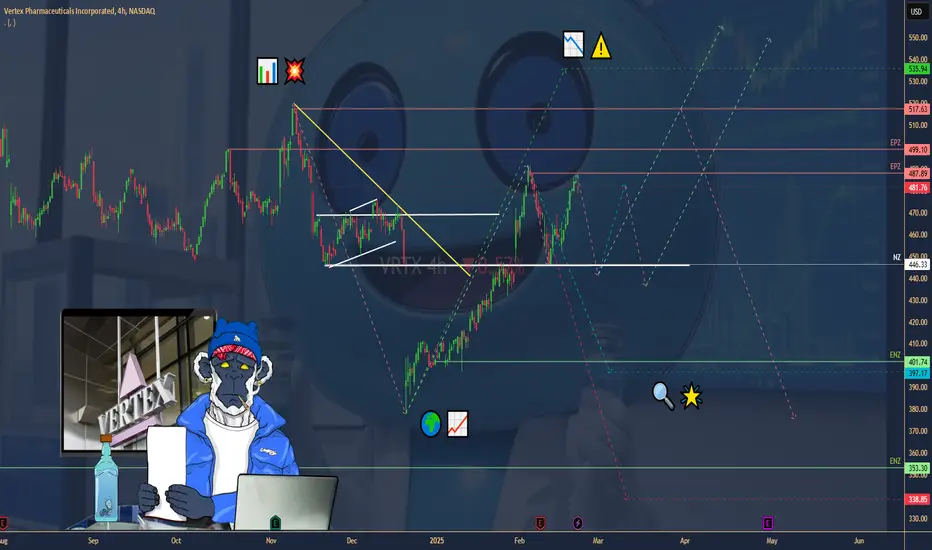
VERTEX ($VRTX) SHINES IN Q4—PAIN & CF FUEL GROWTHVERTEX ( NASDAQ:VRTX ) SHINES IN Q4—PAIN & CF FUEL GROWTH
(1/9)
Good evening, Tradingview! Vertex ( NASDAQ:VRTX ) is buzzing—Q4 revenue up 16%, new drugs hit the scene 📈🔥. $ 2.91B and a bold 2025 forecast—let’s unpack this biotech beast! 🚀
(2/9) – REVENUE RUSH
• Q4 Haul: $ 2.91B—16% jump from last year 💥
• Full ‘24: $ 11.02B, up 12%—Trikafta’s king 📊
• ‘25 Outlook: $11.75-$ 12B—6-9% growth
NYSE:CF keeps humming—newbies add zest!
(3/9) – BIG WINS
• Journavx: Non-opioid painkiller greenlit Jan ‘25 🌍
• Alyftrek: CF drug for 6+—ships now 🚗
• Cash: $11.2B—loaded for action 🌟
NASDAQ:VRTX storms pain—CF stays golden!
(4/9) – SECTOR CHECK
• Valuation: 11x sales—above 9x avg 📈
• Vs. Peers: Gilead’s 4x, Regeneron’s 8x—premium?
• Growth: 12% beats biotech’s 5-7% 🌍
NASDAQ:VRTX flexes—value or stretch?
(5/9) – RISKS ON TAP
• Payers: Journavx needs coverage—hiccups? ⚠️
• Trikafta: 93% of sales—big lean 🏛️
• Comp: Pain rivals, CF safe—for now 📉
Hot streak—can it dodge the bumps?
(6/9) – SWOT: STRENGTHS
• CF King: Trikafta, Alyftrek lock it in 🌟
• Pain Play: Journavx eyes $ 4B peak 🔍
• Cash: $11.2B—war chest ready 🚦
NASDAQ:VRTX ’s got muscle and moolah!
(7/9) – SWOT: WEAKNESSES & OPPORTUNITIES
• Weaknesses: Trikafta reliance—eggs in one basket 💸
• Opportunities: Casgevy rolls, pain grows 🌍
Can NASDAQ:VRTX zap past the risks?
(8/9) – NASDAQ:VRTX ’s Q4 surge—what’s your vibe?
1️⃣ Bullish—Pain pays off big.
2️⃣ Neutral—Solid, but risks linger.
3️⃣ Bearish—Growth hits a wall.
Vote below! 🗳️👇
(9/9) – FINAL TAKEAWAY
NASDAQ:VRTX ’s $2.91B Q4 and Journavx/Alyftrek wins spark buzz—$11.2B cash backs it 🌍🪙. Trikafta rules, risks hover—champ or chaser?
Finance
CELSIUS ($CELH) ZAPS UP 33%—Q4 & ALANI NU IGNITE BUZZCELSIUS ( NASDAQ:CELH ) ZAPS UP 33%—Q4 & ALANI NU IGNITE BUZZ
(1/9)
Good evening, Tradingview! Celsius Holdings ( NASDAQ:CELH ) just surged 33%—Q4 earnings and a $1.65B Alani Nu buyout lit the fuse 📈🔥. Energy drink market’s buzzing—let’s unpack this jolt! 🚀
(2/9) – EARNINGS SNAP
• Q4 Revenue: $332M, topped $329M expected 💥
• Margin: Jumped to 50.2%—beats 47.1% hopes 📊
• EPS: $0.14, above $0.11—solid grit
Growth slowed, but NASDAQ:CELH flexed resilience!
(3/9) – ALANI NU DEAL
• Price: $1.65B—$1.275B cash, $500M stock 🌍
• Alani’s Pull: $595M ‘24 sales, 78% growth 🚗
• Combo: 16% energy drink share—$ 2B ‘25 goal 🌟
NASDAQ:CELH snags a rival—big playtime!
(4/9) – MARKET VIBE
• Surge: 33% to $33-$35—shorts burned 📈
• Vs. Peers: 6x sales, below 9x avg—value?
• X Hype: “Top gainer”—bulls cheer 🌍
NASDAQ:CELH heats up—bargain or buzz?
(5/9) – RISKS IN SIGHT
• Overlap: Alani vs. CELH—cannibal clash? ⚠️
• Slowdown: North Am. down 6%—Pepsi hiccups 🏛️
• Comp: Rivals eye shelf space—tight race 📉
Hot move, but bumps lurk ahead!
(6/9) – SWOT: STRENGTHS
• Deal: $1.65B Alani—growth rocket 🌟
• Margin: 50.2%—profit punch 🔍
• Global: 39% intl. leap—worldwide zip 🚦
NASDAQ:CELH ’s firing on all cylinders!
(7/9) – SWOT: WEAKNESSES & OPPORTUNITIES
• Weaknesses: Q4 dip, overlap risks 💸
• Opportunities: $ 2B sales, $50M synergies 🌍
Can NASDAQ:CELH juice up the doubters?
(8/9) – NASDAQ:CELH ’s 33% zap—what’s your vibe?
1️⃣ Bullish—$40+ in sight.
2️⃣ Neutral—Growth’s cool, risks hover.
3️⃣ Bearish—Hype fades fast.
Vote below! 🗳️👇
(9/9) – FINAL TAKEAWAY
NASDAQ:CELH ’s Q4 and Alani Nu deal spark a 33% leap—$332M, $1.65B buy 🌍🪙. Resilience shines, but overlap looms—champ or chase?

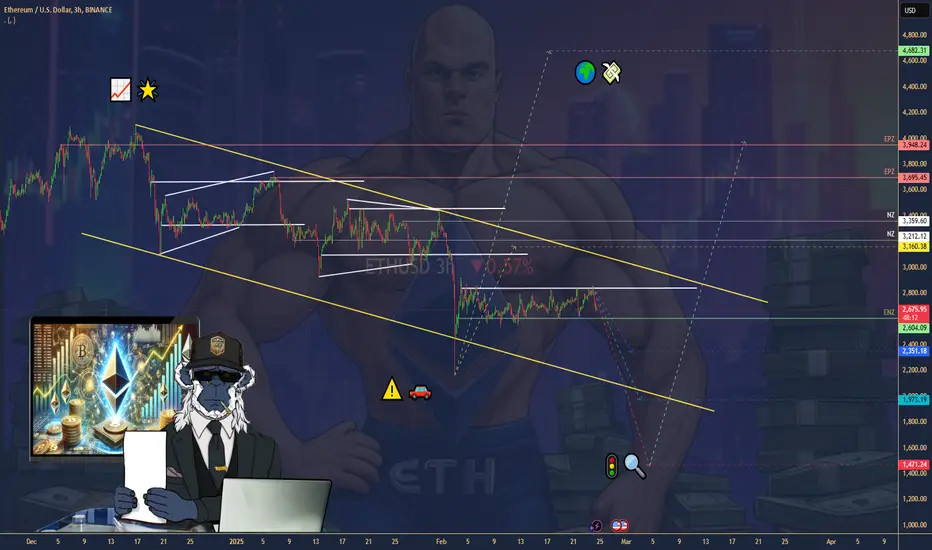
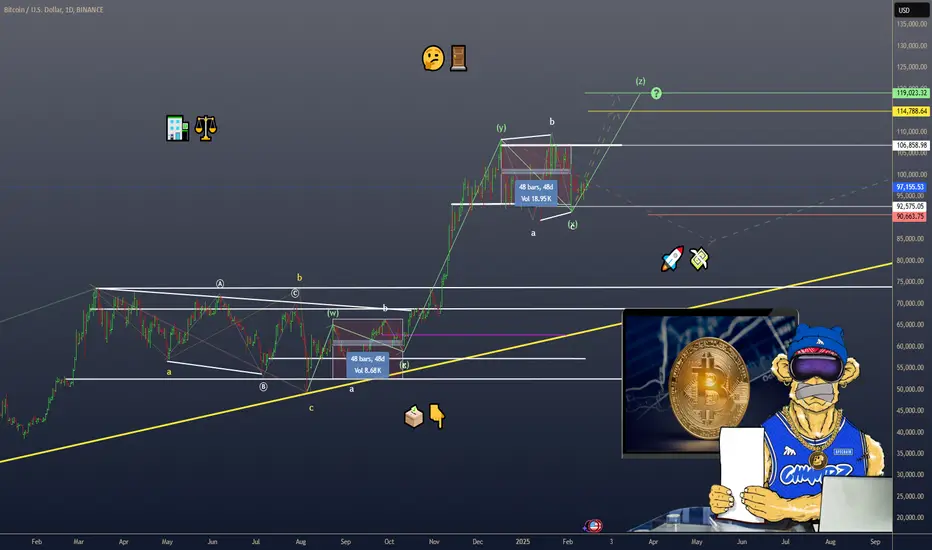
ETHEREUM’S 2025—$ETH POWERS UP WITH ETFs & DEFIETHEREUM’S 2025— CRYPTOCAP:ETH POWERS UP WITH ETFs & DEFI
(1/9)
Good morning, Tradingview! Ethereum’s flexing muscle—ETFs and DeFi keep CRYPTOCAP:ETH humming 📈🔥. Institutional cash and altcoin grit shine—let’s unpack this crypto king! 🚀
(2/9) – ETF BUZZ
• Inflows: $SEED_TVCODER77_ETHBTCDATA:3B+ into ETH ETFs since July ‘24 💥
• Feb Surge: $500M+ in a week—BlackRock leads 📊
• Outlook: $10-15B by year-end?
Big players bet big— CRYPTOCAP:ETH ’s got juice!
(3/9) – DEFI DOMINANCE
• TVL: $120B locked in Feb ‘25—up from $78B 🌍
• Share: 60%+ of DeFi’s action 🚗
• Goal: $200B by Dec? Steno says maybe 🌟
Ethereum’s the DeFi backbone—unshaken!
(4/9) – ALTCOIN EDGE
• Altcoin Cap: $1.6T— CRYPTOCAP:ETH holds 10-12% 📈
• ETH/BTC: Climbing to 0.06—alt season whispers
• Vs. BTC: 57% dominance— CRYPTOCAP:ETH stands tall
Resilient king—altcoins rally behind! 🌍
(5/9) – RISKS ON RADAR
• Regs: Rules could snag ETF, DeFi growth ⚠️
• Rivals: Solana bites at CRYPTOCAP:ETH ’s heels 🏛️
• Price Dip: $2,632—off Jan highs 📉
Solid, but not bulletproof—watch out!
(6/9) – SWOT: STRENGTHS
• ETFs: $ 3B+ inflows—cash keeps flowing 🌟
• DeFi: $120B TVL—ecosystem champ 🔍
• Stake: 54M+ ETH locked—rock steady 🚦
CRYPTOCAP:ETH ’s the muscle in crypto town!
(7/9) – SWOT: WEAKNESSES & OPPORTUNITIES
• Weaknesses: $ 2,632 lags inflows—sentiment lags 💸
• Opportunities: $ 200B TVL, Pectra lifts 🌍
Can CRYPTOCAP:ETH zap to new heights?
(8/9) – CRYPTOCAP:ETH ’s ETF & DeFi run—what’s your vibe?
1️⃣ Bullish—King keeps ruling.
2️⃣ Neutral—Growth’s cool, risks hover.
3️⃣ Bearish—Rivals steal the crown.
Vote below! 🗳️👇
(9/9) – FINAL TAKEAWAY
CRYPTOCAP:ETH ’s humming—$ 3B ETFs, $120B DeFi, altcoin grit 🌍. $ 200B TVL in sight, but rivals lurk. Champ or challenger?
$US30 DOW JONES—STEADY AMID THE STORMDOW JONES—STEADY AMID THE STORM
(1/9)
Good morning, Tradingview! The Dow Jones is the cool-headed cousin—less wild than Nasdaq’s growth party 📈🔥. Blue-chip stability shines, even as inflation bites—let’s unpack it! 🚀
(2/9) – WHY SO CALM?
• Makeup: 30 big, steady names—Walmart, Goldman 💥
• Price-Weighted: High flyers lead, not tech zingers 📊
• Edge: Less sway from growth stock swings
Dow’s the tortoise—slow and steady wins?
(3/9) – RECENT VIBES
• Feb 22: 1.7% dip—support at 43,400 holds 🌍
• VIX: Stays chill—Nasdaq would’ve freaked 🚗
• CPI Hit: 400-point drop, 300 back—meh 🌟
Stability’s the Dow’s secret sauce!
(4/9) – SECTOR SNAP
• Vs. Nasdaq: Tech’s jittery—Dow’s diversified 📈
• Volatility: ~15-20% vs. Nasdaq’s 25-30%
• Champs: Blue-chips buffer the chaos
Steadier ship—less Nasdaq nuttiness! 🌍
(5/9) – INFLATION RIPPLES
• CPI Spike: 3% YoY—400-point jolt ⚠️
• Fed: No rush to cut—rates sting 🏛️
• X Buzz: Tariffs, inflation spook recovery 📉
Even the Dow feels the heat—but shrugs!
(6/9) – SWOT: STRENGTHS
• Stability: Blue-chip backbone holds firm 🌟
• Dividends: Cash flows steady the ship 🔍
• Mix: Less tech tantrums—broad base 🚦
Dow’s the rock in choppy waters!
(7/9) – SWOT: WEAKNESSES & OPPORTUNITIES
• Weaknesses: Inflation nicks costs—ouch 💸
• Opportunities: Safety shines if tech flops 🌍
Can Dow dodge the inflation blues?
(8/9) – Dow’s steady play—what’s your vibe?
1️⃣ Bullish—Stability’s golden.
2️⃣ Neutral—Holds, but inflation looms.
3️⃣ Bearish—Growth wins anyway.
Vote below! 🗳️👇
(9/9) – FINAL TAKEAWAY
Dow’s less jittery—blue-chips cushion the storm 🌍🪙. Inflation’s a nag, but stability rules. Rock or relic?

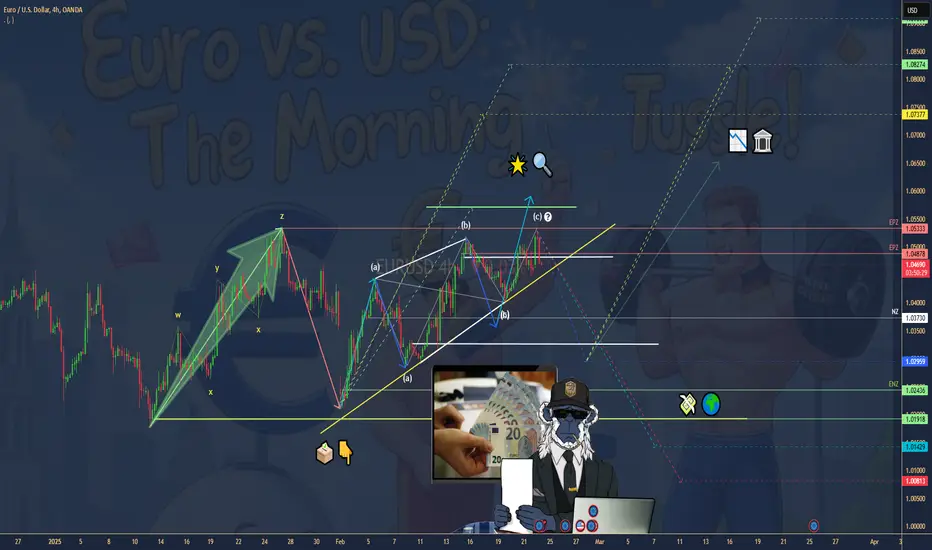
EURO LIFTS POST-GERMAN VOTE—BUT USD BITES BACKEURO LIFTS POST-GERMAN VOTE—BUT USD BITES BACK FX:EURUSD
(1/9)
Good morning, Tradingview Fam! Germany’s election—Merz and CDU on top—gave the euro a quick jolt, up 0.44% to $1.0507 📈🔥. Markets dig the stability vibe, but it’s fading fast—let’s unpack this tussle! 🚀
(2/9) – ELECTION SPARK
• Euro Bump: Hit $1.0530 overnight—election cheer 💥
• Markets: DAX futures up 1.2%, EUROSTOXX 50 +0.66% 📊
• Fade: Now at $1.0480—USD’s flexing back
Brief lift—stability’s sweet, but not sticky!
(3/9) – TECH TELLTALE
• Resistance: $1.0500-1.0510 wall holds firm 🌍
• Support: $1.0470 pivot, then $1.0440 if it slips 🚗
• Charts: Double top whispers at $1.0530 🌟
Traders on X see a retreat—bearish juice brewing?
(4/9) – USD PUSHBACK
• Jobless Claims: Weak last week, USD softened a tad 📉
• Fed: No rush to cut—rates steady, Nvidia looms
• Muscle: Dollar’s clawing back—ballast holds
AMEX:USD ’s got grit—euro’s nudge ain’t enough! 🌍
(5/9) – RISKS IN PLAY
• Volatility: PMI data, Nvidia earnings stir the pot ⚠️
• Sentiment: X split—liquidity grab or bear turn? 🏛️
• Levels: Below $1.0470 opens $1.0390 risk 📉
Quick sprint—can euro keep the pace?
(6/9) – SWOT: STRENGTHS
• Election Lift: CDU win sparks euro hope 🌟
• Markets: European futures pop—optimism flows 🔍
• Cash: $1.0530 peak shows buyer guts 🚦
Euro’s got some spark—briefly lit!
(7/9) – SWOT: WEAKNESSES & OPPORTUNITIES
• Weaknesses: $1.0510 cap, USD fights back 💸
• Opportunities: PMI beats could push $1.0600 🌍
Will euro dodge the dollar’s jab?
(8/9) – Euro’s election bump—what’s your call?
1️⃣ Bullish—Stability wins out.
2️⃣ Neutral—Blip, not a trend.
3️⃣ Bearish—USD takes the ring.
Vote below! 🗳️👇
(9/9) – FINAL TAKEAWAY
Euro spiked to $1.0507 on Germany’s vote—CDU’s steady hand 🌍🪙. Now $1.0480—USD’s got claws. Resistance bites, downside looms—blip or bust?
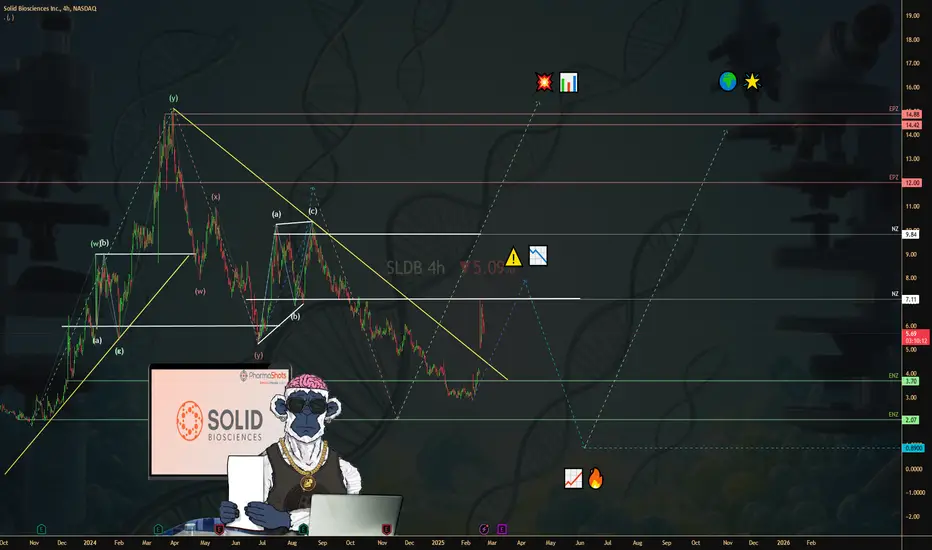
SOLID BIOSCIENCES—$SLDB CASHES UP FOR GENE THERAPY PUSHSOLID BIOSCIENCES— NASDAQ:SLDB CASHES UP FOR GENE THERAPY PUSH
(1/9)
Good afternoon, Tradingview! Solid Biosciences is stacking cash—no revenue yet, but a $200M raise has tongues wagging 📈🔥. NASDAQ:SLDB ’s betting big on gene therapy—here’s the scoop! 🚀
(2/9) – CASH, NOT SALES
• Revenue: Zilch—clinical-stage vibes 💥
• Q3 ‘24 Loss: $0.61/share, missed $0.58 est. 📊
• Cash Boost: $200M offering just landed
No sales, but NASDAQ:SLDB ’s war chest is growing!
(3/9) – BIG MOVE
• Feb 18 Raise: $200M via 35.7M shares, warrants 🌍
• Cash Pile: Was $171M, now nearing $350M 🚗
• Goal: Fuel SGT-003 trials into ‘27 🌟
NASDAQ:SLDB ’s loading up for the long haul!
(4/9) – SECTOR CHECK
• Market Cap: $500M post-raise 📈
• Vs. Peers: Sarepta’s 13B dwarfs it—revenue rules
• Edge: Low EV ($150M), big therapy dreams
Undervalued biotech bet or long shot? 🌍
(5/9) – RISKS ON DECK
• Trials: SGT-003 flops could sink it ⚠️
• Sentiment: 30% drop from Jan peak—jitters 🏛️
• Burn: $20-25M/quarter—clock’s ticking 📉
High stakes, high risks—can it deliver?
(6/9) – SWOT: STRENGTHS
• Cash: $200M raise powers trials 🌟
• SGT-003: Early data dazzles, Fast Track nod 🔍
• DMD Focus: Huge need, blockbuster shot 🚦
NASDAQ:SLDB ’s got fuel and firepower!
(7/9) – SWOT: WEAKNESSES & OPPORTUNITIES
• Weaknesses: No revenue, all-in on one play 💸
• Opportunities: $2-4B cap if trials pop 🌍
Can NASDAQ:SLDB turn cash into a cure?
(8/9) – NASDAQ:SLDB ’s $200M haul—your take?
1️⃣ Bullish—Gene therapy gold ahead.
2️⃣ Neutral—Wait for trial proof.
3️⃣ Bearish—Risks outweigh the buzz.
Vote below! 🗳️👇
(9/9) – FINAL TAKEAWAY
NASDAQ:SLDB ’s revenue-free, but $200M keeps SGT-003 alive—stock’s buzzing 🌍🪙. Low EV vs. peers, yet trials and rivals loom. Cure or bust?
U.S. FIRMS SWAP DOLLARS FOR EURO to lower funding costsU.S. FIRMS SWAP DOLLARS FOR EURO to lower funding costs—SMART MOVE?
(1/9)
Good afternoon, Tradingview! U.S. companies are flipping dollar debt into euros—slashing borrowing costs 📈🔥. Cross-currency swaps are the hot ticket amid rate gaps. Let’s break it down! 🚀
(2/9) – SWAP SURGE
• Trend: Dollar bonds morph into euros 💥
• Why: Eurozone rates lag U.S. by ~200 points 📊
• Volume: $266B in Jan ‘25 swaps, up 7% YoY
Lower rates, big savings—companies pounce!
(3/9) – THE TRIGGER
• Fed: Holds steady—U.S. rates stay high 🌍
• ECB: Eases up—eurozone softens 🚗
• Trump Tariffs: Stir inflation fears—volatility spikes 🌟
Dollar strength pushes firms to euro deals!
(4/9) – HOW IT WORKS
• Swap: Trade dollar debt for euro payments 📈
• Gain: Cheaper interest, currency hedge
• Impact: Millions saved, euro cash flows shine
It’s a financial jujitsu move—clever stuff! 🌍
(5/9) – RISKS IN PLAY
• Euro Flip: Stronger euro could zap savings ⚠️
• FX Losses: Hedging costs climb if dollar dips 🏛️
• Uncertainty: Fed vs. ECB—rate dance wobbles 📉
Smart bet, but not risk-free!
(6/9) – WHY NOW?
• Rate Gap: U.S. high, eurozone low—carry’s juicy 🌟
• Trump Effect: Tariffs fuel dollar power 🔍
• Global Ops: U.S. firms shield Europe earnings 🚦
Timing’s ripe—swaps are the shield!
(7/9) – MARKET VIBE
• Early ‘25: Swap restructures cash in 🌍
• Savings: redirected to debt, flexibility 📈
• Trend Watch: Grows if rate split holds
Companies adapt—financial acrobatics in action!
(8/9) – Dollar-to-euro swaps—what’s your take?
1️⃣ Bullish—Cost cuts win big.
2️⃣ Neutral—Works now, risks later.
3️⃣ Bearish—Euro rebound kills it.
Vote below! 🗳️👇
(9/9) – FINAL TAKEAWAY
U.S. firms swap dollars for euros—saving millions as rates diverge 🌍🪙. Tariffs and Fed fuel the play, but euro risks lurk. Genius or gamble?

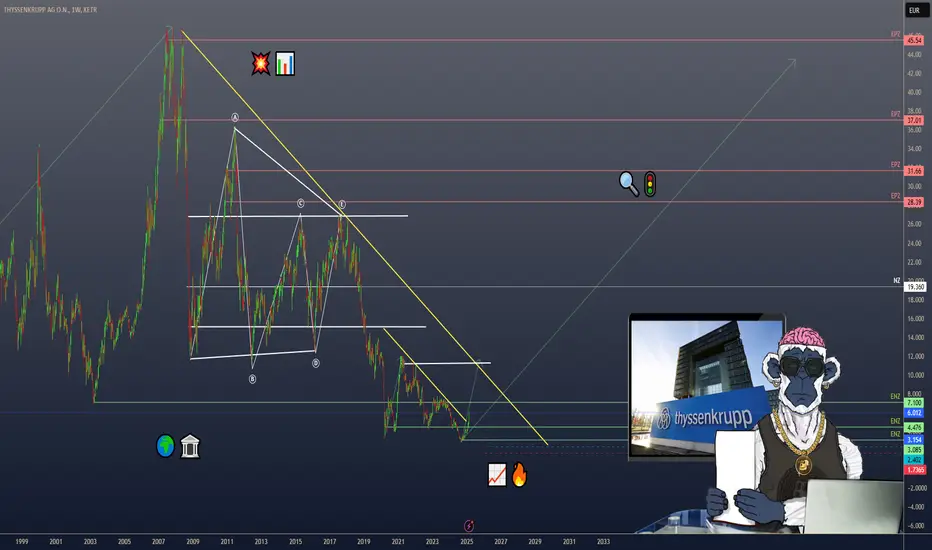
$TKA THYSSENKRUPP & IVECO—HIDDEN DEFENCE GEMS SHINEXETR:TKA THYSSENKRUPP & IVECO—HIDDEN DEFENCE GEMS SHINE
(1/9)
Good afternoon, Tradingview! Thyssenkrupp’s stock soared 20% this week—defence spending’s the buzz 📈🔥. Investors eye TKMS and Iveco’s IDV as undervalued stars. Let’s unpack this rally! 🚀
(2/9) – MARKET SURGE
• Thyssenkrupp: 20% spike Monday, 53% YTD 💥
• Iveco: 68% YTD—IDV’s 10% margin shines 📊
• Driver: Europe’s military budget boom
Defence cash is flipping the script—big gains!
(3/9) – DEFENCE PLAYS
• TKMS Spin-Off: Warship unit set for ‘25 🌍
• Iveco IDV: Defence arm spins out in ‘25 🚗
• BofA: TKMS worth half Thyssenkrupp’s cap 🌟
Hidden gems catching the spotlight!
(4/9) – SECTOR SNAPSHOT
• Defence P/E: 25.8x vs. 18x 3 yrs ago 📈
• Thyssenkrupp & Iveco: ~8x—bargains?
• Vs. Giants: Rheinmetall, BAE soar, but these lag
Value hunt’s on—undervalued or overhyped? 🌍
(5/9) – RISKS TO WATCH
• Peace Talks: Ukraine deal softens demand? ⚠️
• Execution: Spin-offs need to deliver 🏛️
• Focus: Beyond big defence names risky 📉
Rally’s hot—can it hold the heat?
(6/9) – SWOT: STRENGTHS
• Thyssenkrupp: €16B+ TKMS backlog 🌟
• Iveco: IDV’s 10% profit margin 🔍
• Cash Flow: Thyssenkrupp hits €0-300M ‘25 🚦
Defence muscle’s flexing hard!
(7/9) – SWOT: WEAKNESSES & OPPORTUNITIES
• Weaknesses: Thyssenkrupp’s steel drag, Iveco’s focus 💸
• Opportunities: EU budget hikes, spin-off buzz 🌍
Can these sleeper hits wake up big?
(8/9) –Thyssenkrupp & Iveco defence bets—your call?
1️⃣ Bullish—Spin-offs spark a surge.
2️⃣ Neutral—Growth’s there, risks balance.
3️⃣ Bearish—Rally fades fast.
Vote below! 🗳️👇
(9/9) – FINAL TAKEAWAY
Thyssenkrupp’s 20% leap, Iveco’s IDV glow—defence cash ignites hidden plays 🌍🪙. Cheap vs. giants, but risks lurk. Gems or mirage?
META’S Q4 2024—$META RIDES AI AND ADS TO VICTORYMETA’S Q4 2024— NASDAQ:META RIDES AI AND ADS TO VICTORY
(1/9)
Good evening, Tradingview! Meta’s Q4 2024 earnings landed—$48.4B revenue, up 21% YoY, topping estimates 📈🔥. A 16.5% stock rally seals the deal. Let’s unravel NASDAQ:META ’s big win! 🚀
(2/9) – AD & AI POWER
• Q4 Revenue: $48.4B, 21% jump from last year 💥
• Profits: Nearly $21B—up 49%—efficiency shines 📊
• Ad Surge: Biggest driver, fueling the cash flow
AI’s humming, ads are king—Meta’s on fire!
(3/9) – KEY WINS
• AI Spend: $60B+ lined up for ‘25 🌍
• Users: 3.35B daily logins—record crowd 🚗
• Meta AI: 700M monthly fans—AI’s buzzing 🌟
Stock’s tearing up the charts—hot streak alert!
(4/9) – SECTOR SMACKDOWN
• Forward P/E: ~28x, leaner than Amazon’s 33x
• Ad Game: 21% growth beats Google’s 12% 📈
• User Pull: Social king—rivals can’t touch it
NASDAQ:META ’s a growth beast—hidden value or hype? 🌍
(5/9) – RISKS ON THE HORIZON
• Regs: EU and U.S. eyeing fines—trouble brews? 🏛️
• AI Bet: $60B spend—payoff’s a question ⚠️
• Saturation: 3.35B users tough to top 📉
High stakes in this tech showdown!
(6/9) – SWOT: STRENGTHS
• Ad Muscle: $46.8B in Q4—ad king rules 🌟
• AI Edge: 700M Meta AI users—future’s here 🔍
• Cash Pile: $52B free flow in ‘24 🚦
NASDAQ:META ’s flexing serious firepower!
(7/9) – SWOT: WEAKNESSES & OPPORTUNITIES
• Weaknesses: Metaverse burns SEED_TVCODER77_ETHBTCDATA:5B , AI costs stack 💸
• Opportunities: Threads hits 100M+, AI ads shine 🌍
Can NASDAQ:META spin risks into wins?
(8/9) – NASDAQ:META ’s Q4 rocks—what’s the vibe?
1️⃣ Bullish—AI and ads keep it roaring.
2️⃣ Neutral—Growth’s cool, risks hover.
3️⃣ Bearish—Big spends clip its wings.
Vote below! 🗳️👇
(9/9) – FINAL TAKEAWAY
Meta’s Q4 dazzles—$48.4B revenue, $21B profit, AI soaring 🌍🪙. 28x P/E vs. peers, but growth’s electric. Regs and AI costs loom—gem or gamble?

APPLOVIN’S Q4 2024—$APP BLASTS OFF WITH AI-AD SURGEAPPLOVIN’S Q4 2024— NASDAQ:APP BLASTS OFF WITH AI-AD SURGE
(1/9)
Good evening, Tradingview! AppLovin’s Q4 2024 earnings hit—$1.37B revenue, up 44% YoY, crushing $1.26B estimates 📈🔥. AI-powered AXON drives a 37% stock pop. Let’s unpack NASDAQ:APP ’s monster quarter! 🚀
(2/9) – REVENUE & EARNINGS
• Q4 Revenue: $1.37B, +44% YoY ($953.3M Q4 ‘23) 💥
• Ad Revenue: $999.5M, +73% YoY
• Apps Revenue: $373.3M, -1% YoY 📊
• EPS: $1.73, beats $1.24 est.
• Net Income: $599.2M, +248% YoY
(3/9) – BIG MOVES
• Stock Surge: +37% post-earnings (Feb 13) 🌍
• Buybacks: $2.1B retired 25.7M shares in ‘24 🚗
• Debt Play: $3.55B notes issued Nov ‘24 💸
• Q1 ‘25 Guide: $1.355-1.385B, tops $1.32B est.
(4/9) – SECTOR SHOWDOWN
• Market Cap: $175B (Feb 13) 🌟
• Trailing P/E: 116 vs. TTD (50), META (33)
• Growth: 44% YoY beats TTD (26%), META (19%)
• 1Y Stock: +1,000%, 2Y: +3,000%
Premium price, growth screams value!
(5/9) – RISKS TO FLAG
• Valuation: 116 P/E—high stakes, no misses 📉
• Debt: $3.51B vs. $567.6M cash—leverage looms ⚠️
• AI Rivals: Google, Meta eye AXON’s turf 🏛️
• Regs & Economy: Ad spend cuts lurk
(6/9) – SWOT: STRENGTHS
• Growth: 44% revenue, $599M profit soars 🌟
• Margins: 62% EBITDA, $2.1B FCF in ‘24 🔍
• AXON: 73% ad surge—AI’s the champ 🚦
NASDAQ:APP ’s a profit powerhouse!
(7/9) – SWOT: WEAKNESSES & OPPORTUNITIES
• Weaknesses: Apps dip (-1%), $3.51B debt 💸
• Opportunities: E-commerce ads, AI edge, acquisitions 🌍
Can NASDAQ:APP turn risks into riches?
(8/9) – NASDAQ:APP ’s Q4 stuns—where’s it headed?
1️⃣ Bullish—AI keeps it soaring.
2️⃣ Neutral—Growth holds, risks balance.
3️⃣ Bearish—Valuation bites back.
Vote below! 🗳️👇
(9/9) – FINAL TAKEAWAY
AppLovin’s Q4 dazzles—$1.37B revenue, $599M profit, stock blazing 🌍🪙. High P/E, but AI growth shines. Debt and rivals loom—gem or peak?

AIRBNB’S Q4 2024—$ABNB SOARS WITH RECORD GROWTHAIRBNB’S Q4 2024— NASDAQ:ABNB SOARS WITH RECORD GROWTH
(1/9)
Good morning, Tradingview Fam! Airbnb’s Q4 2024 earnings dropped—$2.5B revenue, up 12% YoY, topping $2.42B estimates 📈🔥. Nights booked hit 111M, and a $14% stock surge shows the market’s love. Let’s unpack NASDAQ:ABNB ’s big win! 🚀
(2/9) – REVENUE & EARNINGS
• Q4 Revenue: $2.5B, +12% YoY ($2.2B Q4 ‘23) 💥
• Net Income: $461M vs. -$349M loss last year
• EPS: $0.73, beats $0.61 est. 📊
• Adj. EBITDA: $765M, +4% YoY, 30.8% margin
• GBV: $17.6B, +13% YoY
Travel demand’s fueling the fire!
(3/9) – KEY HIGHLIGHTS
• Stock Surge: +14% post-earnings (Feb 14) 🌍
• Buybacks: $838M in Q4, $3.4B for 2024 🚗
• New Ventures: $200-250M investment in travel services for May ‘25 ✅
NASDAQ:ABNB ’s betting big on growth beyond stays!
(4/9) – SECTOR SHOWDOWN
• Market Cap: ~$102B, Stock: $161.2 🌟
• Trailing P/E: 48.87 vs. BKNG (23), EXPE (15)
• Outperforms: 12% revenue growth beats BKNG (6%), EXPE (2%)
Premium valuation, but $4.5B free cash flow says it’s earned!
(5/9) – RISKS TO WATCH
• Economy: Retail sales dip hints travel cuts 📉
• Regs: NYC bans, Barcelona threats loom 🏛️
• Competition: BKNG, EXPE, hotels fight back ⚔️
• Costs: $200-250M spend may squeeze Q1 margins ⚠️
(6/9) – SWOT: STRENGTHS
• Growth: 12% revenue, $461M profit shines 🌟
• Cash: SEED_TVCODER77_ETHBTCDATA:9B net, $4.5B FCF powers buybacks 🔍
• Tech: 535+ upgrades boost scale 🚦
NASDAQ:ABNB ’s a travel titan with muscle!
(7/9) – SWOT: WEAKNESSES & OPPORTUNITIES
• Weaknesses: High P/E (48.87), Q1 margin dip 💸
• Opportunities: New services ( SEED_TVCODER77_ETHBTCDATA:1B + potential), LatAm/Asia boom 🌍
Can NASDAQ:ABNB turn expansion into gold?
(8/9) – NASDAQ:ABNB ’s Q4 rocks—where’s it headed?
1️⃣ Bullish—Growth keeps climbing.
2️⃣ Neutral—Solid, but risks hover.
3️⃣ Bearish—Valuation caps it.
Vote below! 🗳️👇
(9/9) – FINAL TAKEAWAY
Airbnb’s Q4 dazzles—$2.5B revenue, stock soaring, new bets in play 🌍. Premium P/E vs. peers, but growth screams value. Risks lurk—regs, economy. Gem or peak?

$KBE’S BANKING BOOM—Q4 STRENGTH & POST-ELECTION SURGEAMEX:KBE ’S BANKING BOOM—Q4 STRENGTH & POST-ELECTION SURGE
(1/9)
Good morning, Tradingview! AMEX:KBE ’s riding high—up 8.3% since the Nov ‘24 election, beating AMEX:SPY ’s 3.3% 📈🔥. Banks are cashing in on trading and dealmaking post-election. Let’s dive into the AMEX:KBE rally! 🚀
(2/9) – PERFORMANCE & REVENUE
• Post-Election Gain: +8.3% vs. AMEX:SPY +3.3% 💥
• Q4 Revenue Growth: Holdings ( NYSE:GS , NYSE:JPM , NYSE:BAC ) up 5-10% YoY
• Sector EPS Est.: +7-8% for Q4 2024
Fixed income trading and investment banking are fueling the fire!
(3/9) – BIG EVENTS
• Pro-Business Vibes: Deregulation hopes lift sentiment 🏛️
• M&A/IPO Surge: Banks thriving in deal flow 📊
• NYSE:GS Q4 Est.: GPW:11B + revenue, +5-7% YoY 🚗
X posts buzz about a banking renaissance!
(4/9) – SECTOR SHOWDOWN
• AMEX:KBE : +8.3% vs. AMEX:XLF +6%, AMEX:IWM +5.4% 🌍
• Forward P/E: ~10x ( AMEX:KBE ) vs. 12x ( AMEX:XLF ), 20x ( AMEX:SPY )
• P/B: 1.2x vs. AMEX:XLF ’s 1.5x
Undervalued vs. peers, but banking focus shines!
(5/9) – RISKS TO WATCH
• Rates: Rising costs could pinch margins 📉
• Trade Policy: Tariffs might slow deals ⚠️
• Loan Demand: Weakness or credit dips a threat 🏦
• Sentiment: Undervaluation lingers—earnings key!
(6/9) – SWOT: STRENGTHS
• Trading Power: FICC up 10% in Q4 🌟
• Dealmaking: Top banks lead M&A/IPO surge 🔍
• Low Cost: 0.35% expense ratio beats most 🚦
AMEX:KBE ’s got muscle in the banking game!
(7/9) – SWOT: WEAKNESSES & OPPORTUNITIES
• Weaknesses: Cyclical reliance, bank-only focus 💸
• Opportunities: Deregulation, 10-15% earnings pop in ‘25 🌍
Can AMEX:KBE cash in on policy and growth?
(8/9) – AMEX:KBE ’s Q4 strength—where’s it going?
1️⃣ Bullish—Banks keep soaring.
2️⃣ Neutral—Growth holds, risks balance.
3️⃣ Bearish—Rate woes hit hard.
Vote below! 🗳️👇
(9/9) – FINAL TAKEAWAY
AMEX:KBE ’s Q4 glows—trading and deals lift banks high 🌍. Cheap at 10x P/E, but risks lurk. Undervalued gem or cyclical trap?

ROBINHOOD’S Q4 2024—TRADING BOOM FUELS RECORD GAINSROBINHOOD’S Q4 2024—TRADING BOOM FUELS RECORD GAINS NASDAQ:HOOD
(1/9)
Good morning, Tradingview! Robinhood’s Q4 2024 earnings are out 📈🔥—$1.01B in revenue, up 115% YoY, smashing $945M estimates. Post-election trading frenzy in equities and crypto lit the fuse. Let’s break down HOOD’s monster quarter! 🚀
(2/9) – REVENUE & EARNINGS HIGHLIGHTS
• Q4 Revenue: $1.01B, +115% YoY 💥
• Q3 Recap: $637M, +36% YoY
• Q4 EPS: $1.01, beats $0.43 est. 📊
• Net Income: $916M, up 510% from Q3’s $150M
• ARPU: $164, +102% YoY
Record profits, driven by a trading surge!
(3/9) – KEY WINS
• Net Deposits: $16.1B, +42% QoQ 🌍
• New Tools: Index options, futures, Robinhood Legend launched late 2024 🚗
• SEC Settlement: $45M in Jan 2025 clears past compliance woes ✅
HOOD’s expanding fast and cleaning house!
(4/9) – SECTOR SHOWDOWN
• Market Cap: $56.4B, Stock: $65.28 🌟
• Trailing P/E: 40.9x vs. IBKR (50x), SCHW (20x)
• Revenue Growth: 115% YoY crushes sector avg (5.7%)
Outpaces peers in growth, but valuation’s a hot debate!
(5/9) – RISKS ON DECK
• Market Volatility: Trading boom could fade 📉
• Regs: $45M SEC hit flags ongoing scrutiny 🏛️
• Competition: Schwab, Coinbase closing in ⚔️
• Economy: $1.21T credit card debt, layoffs loom ⚠️
Big gains, big risks—tightrope ahead!
(6/9) – SWOT: STRENGTHS
• Revenue: 115% YoY, $916M profit shines 🌟
• User Loyalty: $16.1B deposits, 2.2M+ Gold subs 🔍
• Innovation: Futures, options expand the game 🚦
HOOD’s firing on all cylinders!
(7/9) – SWOT: WEAKNESSES & OPPORTUNITIES
• Weaknesses: Trading reliance, reg baggage 💸
• Opportunities: Futures growth, crypto-friendly regs, global push 🌍
Can NASDAQ:HOOD turn momentum into a dynasty?
(8/9) – HOOD’s Q4 is a banger—where’s it headed?
1️⃣ Bullish—Growth keeps roaring.
2️⃣ Neutral—Solid, but risks loom.
3️⃣ Bearish—Peak’s in, fade coming.
Vote below! 🗳️👇
(9/9) – FINAL TAKEAWAY
Robinhood’s Q4 is a SEED_TVCODER77_ETHBTCDATA:1B thunderclap—trading, deposits, and profits soar 🌍. But volatility and regs lurk. Undervalued or overhyped?

BAIDU’S Q4 2024 Earnings drop today Review Q3BAIDU’S Q3 2024 PERFORMANCE—AI GROWTH VS. AD WOES
(1/9)
Good morning, Tradingview Fam! Baidu’s latest financials are 📈🔍. Q3 2024 revenue hit ¥33.6B ($4.7B USD), but the story’s in the details: AI’s soaring, ads are slipping. Let’s dive into BIDU’s numbers and outlook! 🚀
(2/9) – REVENUE & EARNINGS SNAPSHOT
• Total Revenue: ¥33.6B ($4.7B USD)
• Baidu Core: ¥26.5B ($3.7B USD), +4% YoY 💥
• Cloud Revenue: Strong growth (exact figures vary) ☁️
• Q3 EPS: ¥19.2 ($2.67 USD), missed ¥19.62 est.
• Non-GAAP Net Income: ¥7.6B (~$1.06B USD)
Next up: Feb 18 earnings, est. $1.78 EPS, $4.56B revenue (-7.4% YoY).
(3/9) – BIG MOVES IN AI & AUTONOMOUS TECH
• Baidu World 2024: Unveiled iRAG & Miaoda AI tools 🤖
• ERNIE API: 1.5B daily calls, up 30x YoY 📈
• Lidar Deal: $200-300M with Hesai for Yichi 06 robotaxis 🚗
AI and autonomy are stealing the show—growth engines revving up!
(4/9) – SECTOR SHOWDOWN
• Market Cap: $31.36B (Feb 2025) 🌍
• Trailing P/E: 10.56x, Forward P/E: 10.5x—cheap vs. Alphabet or Tencent 📊
• Lags GOOG in search/ad scale but leads Chinese peers (JD, PDD) in AI diversification
At 3x EV/EBITDA, is BIDU undervalued? X posts think so!
(5/9) – RISKS ON THE RADAR
• Ad revenue: Squeezed by Tencent, ByteDance competition 📉
• AI costs: Big R&D spend, profits TBD 🤔
• China regs: Unpredictable hurdles loom 🏛️
• Economy: Slowdown could hit ad & cloud growth
• U.S.-China tension: Weighs on sentiment ⚠️
(6/9) – SWOT: STRENGTHS
• King of China’s search market, mobile ecosystem thriving 🔍
• ERNIE Bot: 430M users, 770k enterprise apps 🌟
• Apollo Go: Leading autonomous driving, $162.6B robotaxi market by 2025 🚦
Baidu’s got serious firepower!
(7/9) – SWOT: WEAKNESSES & OPPORTUNITIES
• Weaknesses: Ad margins shrinking, AI not yet cashing in 💸
• Opportunities: AI cloud expansion, robotaxi scale-up, China stimulus upside 🌍
Can Baidu turn its tech bets into gold? Time will tell!
(8/9) – What’s BIDU’s 2025 vibe?
1️⃣ Bullish—AI and autonomy will drive a breakout.
2️⃣ Neutral—Growth potential, but risks balance it out.
3️⃣ Bearish—Ads and regs will drag it down.
Vote below! 🗳️👇
(9/9) – FINAL TAKEAWAY
Baidu’s Q3 shows a tale of two trends: AI and autonomy surging, ads under pressure 🌍. With a low valuation and big tech bets, BIDU’s at a crossroads. Will innovation outpace the risks? Earnings drop today—stay tuned for the next chapter! 💪

GOLDMAN SACHS’ NEAR-$2B CRYPTO ETF BETGOLDMAN SACHS’ NEAR- SEED_TVCODER77_ETHBTCDATA:2B CRYPTO ETF BET
(1/8)
Goldman Sachs just revealed a massive crypto ETF position—nearly SEED_TVCODER77_ETHBTCDATA:2B in Bitcoin and Ethereum funds, per an SEC filing. Let’s break down the details and see what it means for traditional finance! 🚀💸
(2/8) – HOLDINGS SNAPSHOT
• Bitcoin ETFs: $1.63B total
24,077,861 shares in BlackRock’s iShares Bitcoin Trust (IBIT) (~$1.33B)
3,530,486 shares of Fidelity’s Wise Origin Bitcoin (FBTC) (~$300M)
49,183 shares of Grayscale Bitcoin Trust (GBTC) (~$3.7M)
• Ethereum ETFs: $196.3M total
7,024,747 shares in Fidelity’s Ethereum Fund (FETH) (~$191.1M)
200,000 shares of Grayscale Ethereum Mini Trust (~$5.1M)
(3/8) – ETFS: BRIDGING TRADFI & CRYPTO
• First approved in 2024, BTC & ETH ETFs let institutions gain crypto exposure without holding coins directly
• Perfect for “regulated” banks like Goldman, bridging Wall Street with digital assets 🏦
(4/8) – GOLDMAN’S STANCE ON DIRECT CRYPTO
• CEO David Solomon: “We’re a regulated bank, can’t own crypto as principal.” ⚖️
• They advise clients & dabble in ETFs, but can’t yet park BTC on their balance sheet due to regs
• Hints at how major banks remain cautious, even with big bets
(5/8) – WHY IT MATTERS*
• SEED_TVCODER77_ETHBTCDATA:2B in BTC & ETH ETFs = a serious vote of confidence in crypto’s future
• Encourages other institutional players to follow suit—if Goldman is in, who’s next? 🤔
• Demonstrates that “indirect” ownership is how TradFi is tiptoeing into crypto markets
(6/8) – REGULATORY OVERHANG*
• The bank can’t directly hold crypto due to existing rules, but invests heavily via approved ETFs
• Raises questions: will we see a day when Goldman (and others) hold actual BTC or ETH on their balance sheets? 🚪
(7/8) – Is SEED_TVCODER77_ETHBTCDATA:2B in BTC & ETH ETFs the start of a bigger Goldman crypto push?
1️⃣ Yes—They’ll expand once regs loosen 🚀
2️⃣ No—They’re staying in the safe zone 🤔
3️⃣ Unsure—Too many regulatory question marks ⚖️
Vote below! 🗳️👇
XRP FINAL STEEP DISCOUNT OPPORTUNITY IS IMMINENTMy time-wave cycles analysis (among other components) indicating we will have a final sell wave to 1.45-1.7 zone over coming days (before FOMC meeting in March imo).
Granted I was a little off on exact timing to reach the buy-side targets back in December but nonetheless accurate on projected price levels..See prior analysis at attached link for the projected high coming in at 3.1-3.3, exactly as it happened...
I have no doubt this final sell wave will also occur. Depending on your goals & trading style, you may treat this next sell wave as an opportunity to simply add more at discounted levels via DCA'ing....or choose to sell at these relative highs to maximize position size once again from sub-1.70 levels.. I DO NOT EXPECT US TO SEE sub-3$ ANYTIMEagain after this next sell wave completes & then buyers take us to 4+ in q2 & beyond.
Expecting this to be the FINAL steep discount buying opportunity for those interested in maximizing their capital purchasing power for long term speculative hodling
Follow for additional actionable alerts & analysis. Appreciate the boosts & looking forward to your comments as well!

$PYPL PAYPAL’S FINANCIAL LANDSCAPE: VALUATION & OPPORTUNITIESPAYPAL’S FINANCIAL LANDSCAPE: VALUATION & OPPORTUNITIES
1/8
PayPal ( NASDAQ:PYPL ) has been on the move lately—announcing a FWB:15B buyback and posting mixed but intriguing earnings results. Let’s dive into what’s making this fintech giant tick! 💳💡
2/8 – Recent Revenue Growth
PayPal’s revenue soared during the digital payment boom but has moderated recently.
Although the exact figures aren’t in the latest posts, growth since 2017 is substantial.
Stabilization might indicate a new normal in digital payments.
3/8 – Earnings & Guidance
Some quarters saw EPS pop by 61%—pretty impressive! 🚀
Mixed guidance ahead: margin expansion concerns and flat-to-down cash flow.
The FWB:15B buyback suggests management sees long-term potential.
4/8 – Valuation vs. Peers
Forward P/E near 10, PEG ratio of 0.52—that’s cheap compared to Visa/Mastercard.
PayPal straddles fintech + payments, competing with everyone from Square ( SET:SQ ) to Apple Pay.
Lower growth vs. some peers, but strong operating margins help PayPal stay ahead.
5/8 – Risk Factors
1️⃣ Regulatory: New rules could cramp expansion.
2️⃣ Market Saturation: Need emerging markets to fuel next leg of growth.
3️⃣ Competition: Stripe, Apple Pay, & countless fintech upstarts.
4️⃣ Tech Disruption: Blockchain, AI, or next-gen payments could reshape the landscape.
6/8 What’s PayPal’s biggest near-term challenge?
1️⃣ Regulatory Hurdles
2️⃣ Competition
3️⃣ Market Saturation
4️⃣ Tech Disruption
Vote below! 🗳️👇
7/8 – SWOT/SCOT
Strengths: Massive user base, recognizable brand, buyback confidence.
Weaknesses: Slowing user growth, uncertain future margins.
Opportunities: Emerging markets, strategic partnerships, AI integration.
Threats: Fierce competition, cyber risks, evolving payment tech.
8/8 – Your Next Move?
PayPal’s at a pivot—undervalued or a value trap? 💰
Let’s see if NASDAQ:PYPL can keep up the momentum!
#PayPal #Fintech #DigitalPayments #PYPL #Investing #Earnings #Valuation #Finance

Monday sell Off? History May Repeat Itself...Monday Sell-Off? This Setup Says It’s Coming... | SPX Market Analysis 10 Feb 2025
Another week wraps up, and as I eye Monday’s open, I can’t shake a sense of déjà vu.
The last two weeks started with a gap down, followed by a bearish finish into the weekend.
Super Bowl Sunday is also here – Can the Kansas City Chiefs complete an unprecedented three-peat in Super Bowl 59 or will the Philadelphia Eagles gain revenge? Just like the markets, only time will tell and we will have to wait and see.
That said, Friday’s setup is setting the stage for another pop ‘n drop. The only question? What triggers the fall this time?
...
SPX Deeper Dive Analysis:
📉 Mondays Have Been Bearish – Will This One Be Too?
The last two Mondays started with a gap down, followed by a bearish move into the weekend. If the pattern holds, next week could open with a bang – but not necessarily to the upside.
🏈 Super Bowl & The Markets – A Perfect Parallel?
The markets are playing their own Super Bowl showdown. Will the bulls make a comeback, or will the bears crush their hopes yet again? Just like the Chiefs vs. Eagles, we can only wait and see.
🔻 Friday’s Bearish Setup – A Warning Sign?
- V-shaped reversal entry ✅
- Bearish pulse bar confirmation ✅
- Similar daily bar pattern to the last two Fridays ✅
📌 So What Happens Monday?
If history repeats itself, we could see:
- A pop higher at the open, luring in buyers 🏹
- A sharp drop shortly after, trapping the late bulls 🕳
- A repeat of the last two weeks' bearish close 📉
🔑 Key Takeaway: The setup is there. Now we wait for the trigger.
Fun Fact:
📢 Did you know? The Super Bowl Indicator suggests that if an AFC team wins, markets go bearish, but if an NFC team wins, markets go bullish.
💡 The Lesson? As ridiculous as it sounds, market psychology is a wild beast. While we don’t trade superstition, it’s always fun to see how random events get tied to stock performance.
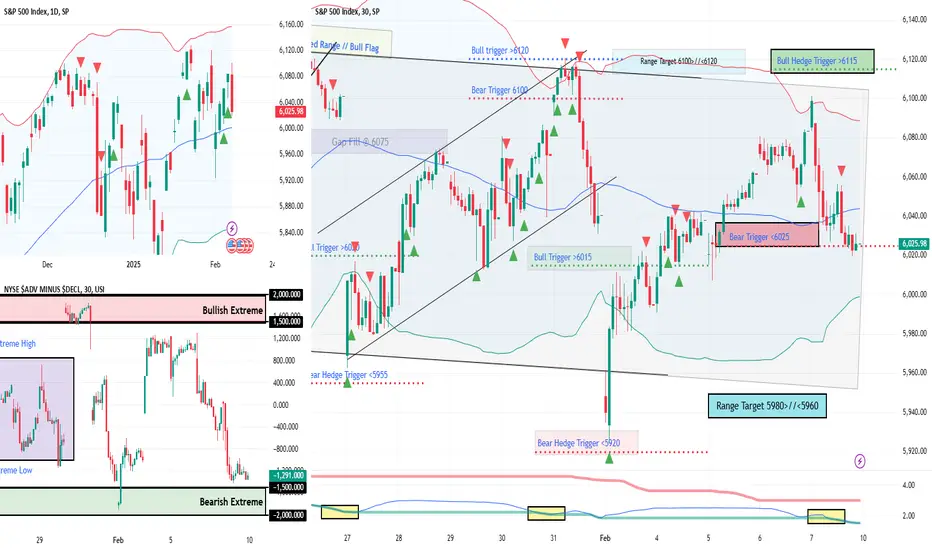
NFP Incoming - Will SPX Smash 6100?NFP Incoming – Will SPX Smash 6100? | SPX Market Analysis 7 Feb 2025
The bulls keep charging as SPX edges closer to 6100. But with the NFP report dropping pre-market, things could get lively.
Will we blast through resistance or bounce back down? Expect some whipsaw chaos before the market settles – but with a bullish trend already in play, we should at least get one more push toward target exits before the dust settles.
---
SPX Deeper Dive Analysis:
📈 Bullish Move On Track
SPX has ridden the momentum train all the way from the range lows to the range highs. Now, we’re staring at 6100, the key level where decisions will be made.
🚀 NFP Report – A Market Mover
Today’s Non-Farm Payroll (NFP) data drops just before the opening bell. This is one of the bigger monthly catalysts, meaning we could see:
A breakout past 6100 if the market likes the numbers.
A sharp rejection back into the range if traders get spooked.
A whipsaw shakeout, with wild swings before settling.
🔄 Short-Term Expectation? A Push Higher
Even if volatility kicks in, the existing bullish momentum should at least give us a final nudge up toward target exits. Whether we smash through 6100 or stall out, we’re in prime position to lock in profits.
⏳ The Good Kind of Waiting
Once again, we’re in a holding pattern, waiting for the market to tip its hand. But this is strategic patience – the kind where we’ve done the hard work and now simply let the market do its thing. The setups are in place – now, we sit back and watch the magic unfold.
---
Fun Fact:
📢 Did you know? In 2010, a trader accidentally caused a $1 trillion stock market crash in just 36 minutes – all because of a fat-finger trade.
💡 The Lesson? One typo, one misclick, or one overleveraged position can cause chaos. Always double-check your trades, because even the pros have hit the wrong button before.

+55% in a day $CYCN compared $TSLA $NVDA -5% in drop marketWe can't be the only ones who actually made money overnight from Friday to Monday in this market?
This was the only daytrade held 🎯
NASDAQ:NVDA NASDAQ:TSLA wake up into -5%
Woke up into +25% with NASDAQ:CYCN and continued to +55% from $4 to $6.25+

Technical Analysis on SBC Medical Group (28/01/2025)Neutral Outlook with Key Support at 5.00–5.08
Price Action Analysis
SBC Medical Group Holdings Incorporated (NASDAQ: SBC) is currently trading at 5.08 on the day. Over the past week, the stock has shown consolidation within a narrow range of
5.02–5.13, reflecting a balance between buyers and sellers. The 1-hour chart highlights a lack of decisive momentum, with prices hovering near the $5.08 level, suggesting short-term indecision in the market.
Immediate Support: The 5.00–5.02 zone has emerged as a critical floor, with the stock rebounding from this level multiple times in recent sessions. A sustained break below $5.00 could signal bearish pressure.
Resistance: The upper boundary lies at 5.08–5.13, where the stock has faced selling interest. A close above 5.13 level may retest the previous high in November levels.
Trading volume remains subdued, averaging between 33,950–38,980 shares, consistent with consolidation phases. The absence of significant volume spikes indicates limited institutional participation and reinforces the neutral near-term bias.
While momentum indicators like the Relative Strength Index (RSI) are not explicitly provided, the sideways price action suggests a neutral RSI reading (near 50), aligning with the lack of overbought or oversold conditions.
SBC’s price action reflects a “wait-and-see” approach among market participants. For now, the stock appears anchored near its 5.08 pivot point level. Traders may consider range-bound strategies (e.g., buying near 5.02) until a breakout occurs.

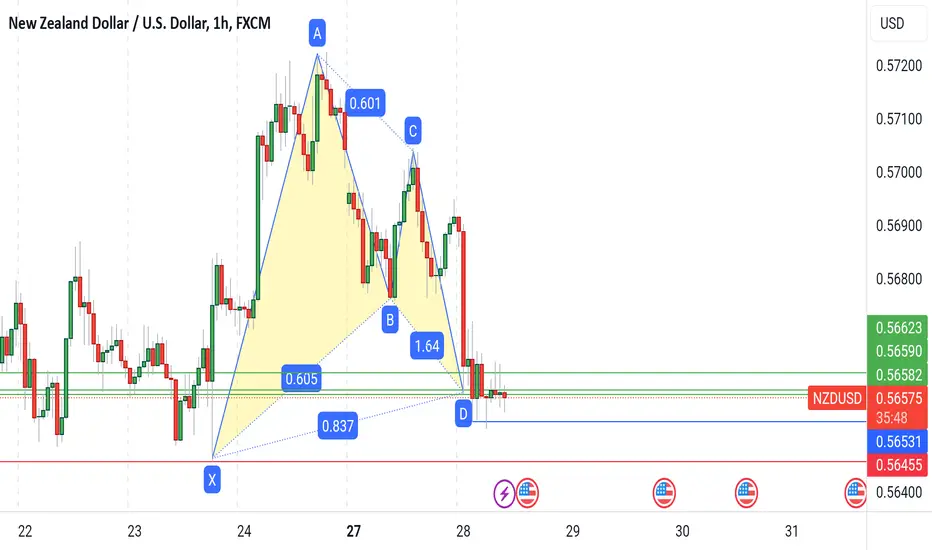
NZDUSD GARTLEYHarmonic Pattern Trading Strategy:
1. Combine patterns with 2-3 confirmations (e.g., MA, BB, RSI, Stoch) for increased accuracy.
2. Implement proper risk management.
3. Limit exposure to 3% of capital per trade.
4. Exercise caution: Not every Harmonic Pattern presents a good trading opportunity.
5. Conduct thorough diligence and analysis before trading.
Disciplined approach = Enhanced edge.
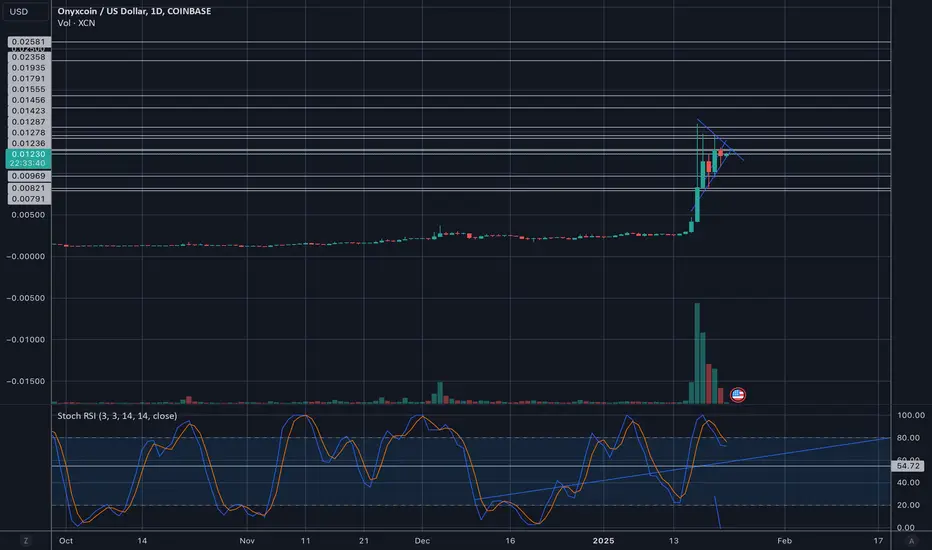
Stoch RSI Big Inverse H&S On The Daily 4 XCN OnyxcoinIf that right shoulder forms we are going to break above the recent high. The price range we have been testing the last day was major resistance in the initial sell off. A lot of the higher prices have FAR less resistance than we are seeing here.
There was a smaller inverse head and shoulders before last weeks pump.
This one is much larger.
Speculation and risk are your friend if you treat them well.
Cheers.