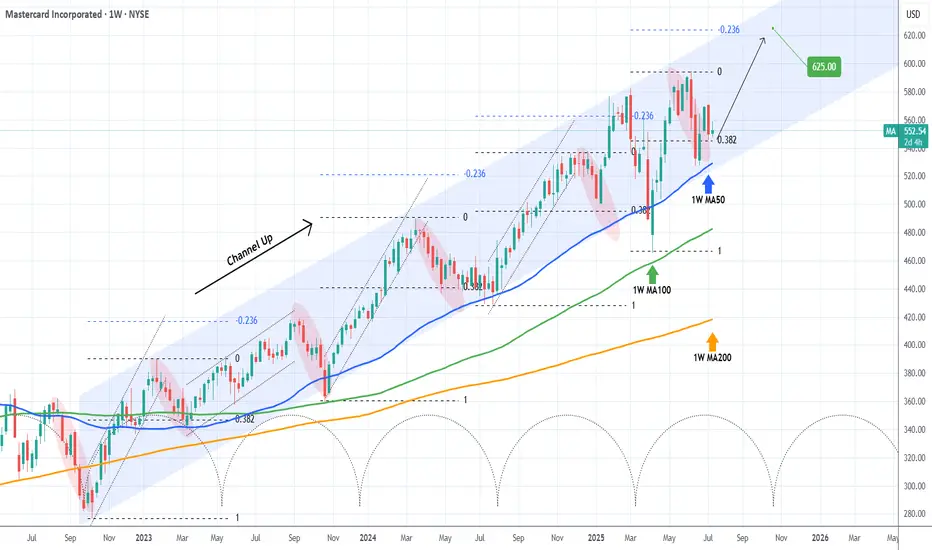
MASTERCARD Best buy entry now. Target $625.Mastercard (MA) has been trading within almost a 3-year Channel Up that only broke (but recovered naturally) during Trump's trade war. Still, the 1W MA100 (green trend-line) contained the downfall, as it always had.
Normally the Bearish Legs of this pattern tend to find Support on the 1W MA50 (blue trend-line), as the latest one did 3 weeks ago. Now that the price is trading still on the 0.382 Fibonacci retracement level, it historically is the best buy opportunity, as per all previous Bullish Legs.
The Channel Up has always priced its Higher High (top) on at least the -0.236 Fibonacci extension. As a result, we are targeting $625.00 before the year ends.
-------------------------------------------------------------------------------
** Please LIKE 👍, FOLLOW ✅, SHARE 🙌 and COMMENT ✍ if you enjoy this idea! Also share your ideas and charts in the comments section below! This is best way to keep it relevant, support us, keep the content here free and allow the idea to reach as many people as possible. **
-------------------------------------------------------------------------------
💸💸💸💸💸💸
👇 👇 👇 👇 👇 👇
Financestocks
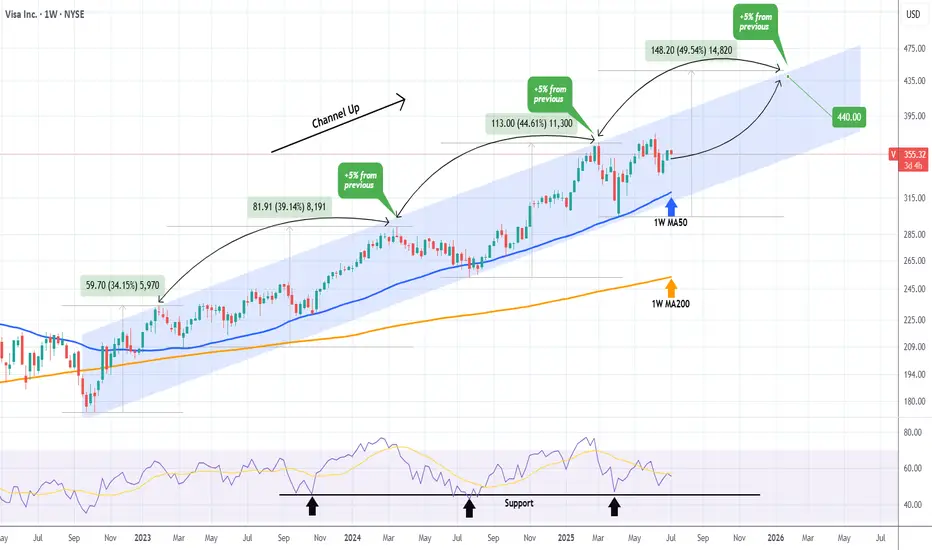
VISA on a strong Bullish Leg targeting $440.Visa Inc. (V) has been trading within a Channel Up pattern since the October 10 2022 market bottom. After December 2022, every test of the 1W MA50 (blue trend-line) has been the most optimal long-term buy opportunity, being also a Higher Low (bottom) of the pattern.
Every Bullish Leg has been +5% stronger than the previous, which leads us to believe that the current Bullish Leg will peak at around +49.50% (+5% from +44.60%). This translates to $440 Target towards the end of the year.
-------------------------------------------------------------------------------
** Please LIKE 👍, FOLLOW ✅, SHARE 🙌 and COMMENT ✍ if you enjoy this idea! Also share your ideas and charts in the comments section below! This is best way to keep it relevant, support us, keep the content here free and allow the idea to reach as many people as possible. **
-------------------------------------------------------------------------------
💸💸💸💸💸💸
👇 👇 👇 👇 👇 👇
JP MORGAN won't give a better buy opportunity in 2025.Last time we looked at JP Morgan Chase (JPM) on November 27 2024 (see chart below), it gave us a clear sell signal that went straight to our $236 Target:
Now that the price rebounded not only on the 1D MA200 (orange trend-line) but also on the bottom (Higher Lows trend-line) of the long-term Channel Up, we are switching back to buying a we even got the first pull-back on the 1D MA50 (blue trend-line).
Given that the 1D RSI also rebounded from oversold (<30.00) territory like the October 27 2023 Low did, we expect a similar Bullish Leg to follow and thus our Target is $330 at the top of the Channel Up.
-------------------------------------------------------------------------------
** Please LIKE 👍, FOLLOW ✅, SHARE 🙌 and COMMENT ✍ if you enjoy this idea! Also share your ideas and charts in the comments section below! This is best way to keep it relevant, support us, keep the content here free and allow the idea to reach as many people as possible. **
-------------------------------------------------------------------------------
💸💸💸💸💸💸
👇 👇 👇 👇 👇 👇

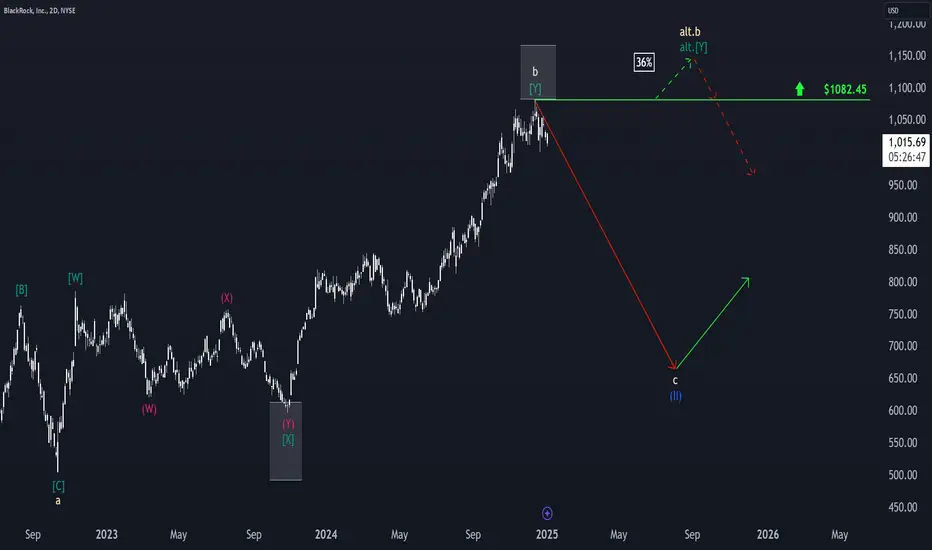
BlackRock: Top Confirmed!Just shy of the lower edge of our Target Zone, BlackRock recently established its high at $1,082.45, completing the beige wave b. The Target Zone has since been deactivated. With this milestone reached, we now anticipate a prolonged decline as part of the beige wave c. This development aligns with the overarching correction of the blue wave (II), which began in November 2021 and is defined by a subordinate abc-structure. From the $1,082.45 high, we primarily expect a sustained price decline. However, this level now serves as a critical resistance. In the context of our 36% likely alternative scenario, we must allow for the possibility of a new wave alt.b high above this mark.
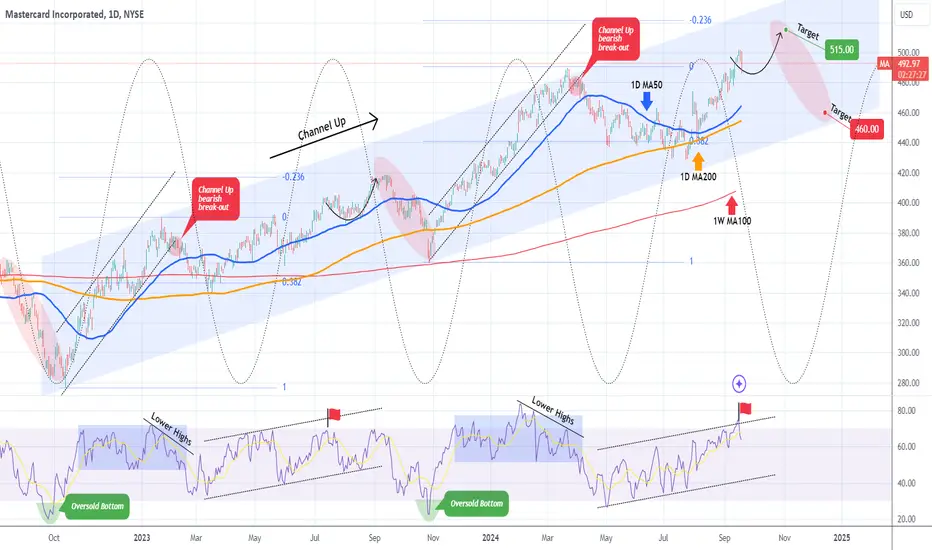
MASTERCARD short-term weakness is a buy opportunity. Target $515Mastercard (MA) gave us an excellent sell signal on our last call (April 02, see chart below), reaching our exact Target ($440.00) before turning sideways and reach this way a Higher Low:
That Higher Low was a bottom on the 2-year Channel Up pattern that has been dominating the long-term price action of the stock. As you can see it hit the 1D MA200 (orange trend-line) and the 0.382 Fibonacci retracement level and has rebounded since, which is similar to the March 16 2023 Low.
The similarities are evident on this chart between the Bullish and Bearish Legs of the Channel Up and the Sine Waves help at giving us a sense of Highs and Lows. The 1D RSI sequences between the two main fractals are also similar and this shows that probably we are at a similar symmetrical level as on July 14 2023.
As a result, we expect a short-term pull-back towards the 1D MA50 (blue trend-line) and then final rally towards the elections for a Higher High around $515.00, which will be just below the -0.236 Fibonacci extension (similar to the September 14 2023 High). Then we expect the stock to yet again seek the bottom of the Channel Up near the 1W MA100 (red trend-line) at $460.00.
-------------------------------------------------------------------------------
** Please LIKE 👍, FOLLOW ✅, SHARE 🙌 and COMMENT ✍ if you enjoy this idea! Also share your ideas and charts in the comments section below! This is best way to keep it relevant, support us, keep the content here free and allow the idea to reach as many people as possible. **
-------------------------------------------------------------------------------
💸💸💸💸💸💸
👇 👇 👇 👇 👇 👇