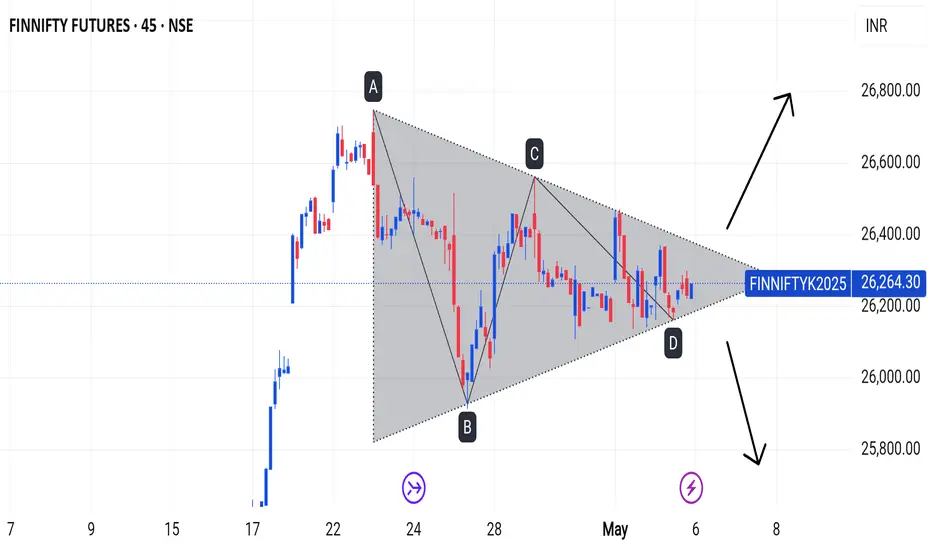
FINNIFYIf the price breaks above the upper trendline, it could be a bullish signal. On the other hand, if the price breaks below the lower trendline, it could be a bearish signal.
If you find this helpful and want more FREE forecasts in TradingView, Hit the 'BOOST' button
Drop some feedback in the comments below! (e.g., What did you find most useful?
How can we improve?)
Your support is appreciated!
Now, it's your turn!
Be sure to leave a comment; let us know how you see this opportunity and forecast.
Have a successful week
DISCLAIMER: I am NOT a SEBI registered advisor or a financial adviser. All the views are for educational purpose only
Finniftyview
Finnifty Bearish ViewFinnifty Bearish View.
the market has completed the 5 wave move and we can expect the market to decline from here. SL for the short position can be the 5-wave high.
Please note that this information is solely for educational purposes, and it is essential to exercise caution when trading
NSE:FINNIFTY1! NSE:FINNIFTY1! NSE:CNXFINANCE

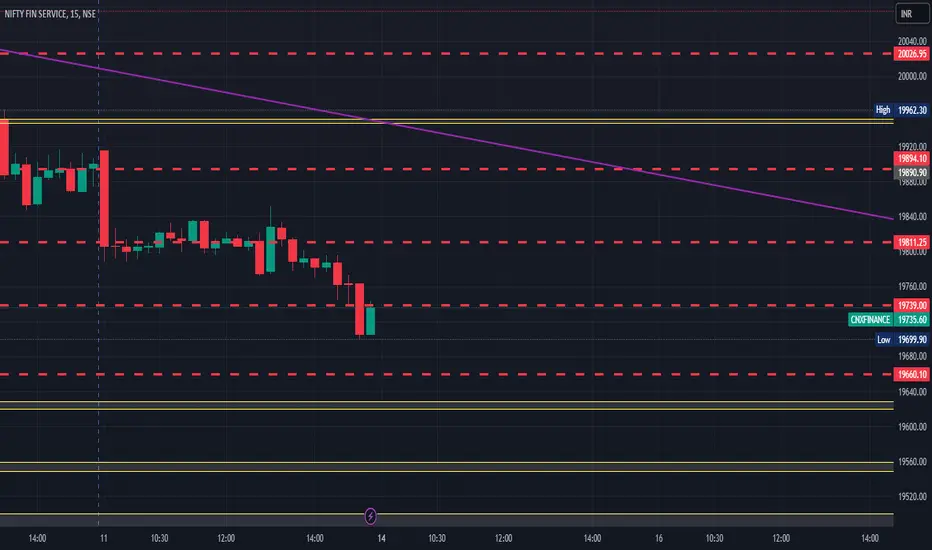
FinNifty levelsFinNifty support and resistance levels are valuable tools for making informed trading decisions, specifically when combined with the analysis of 5-minute timeframe candlesticks and VWAP. By closely monitoring these levels and observing the price movements within this timeframe, traders can enhance the accuracy of their entry and exit points. It is important to bear in mind that support and resistance levels are not fixed, and they can change over time as market conditions evolve.
The dashed lines on the chart indicate the reaction levels, serving as additional points of significance to consider.
We hope you find this information beneficial in your trading endeavors.
* If you found the idea appealing, kindly tap the Boost icon located at the bottom right. We encourage you to share your thoughts and comments regarding it.
Wishing you success in your trading activities!