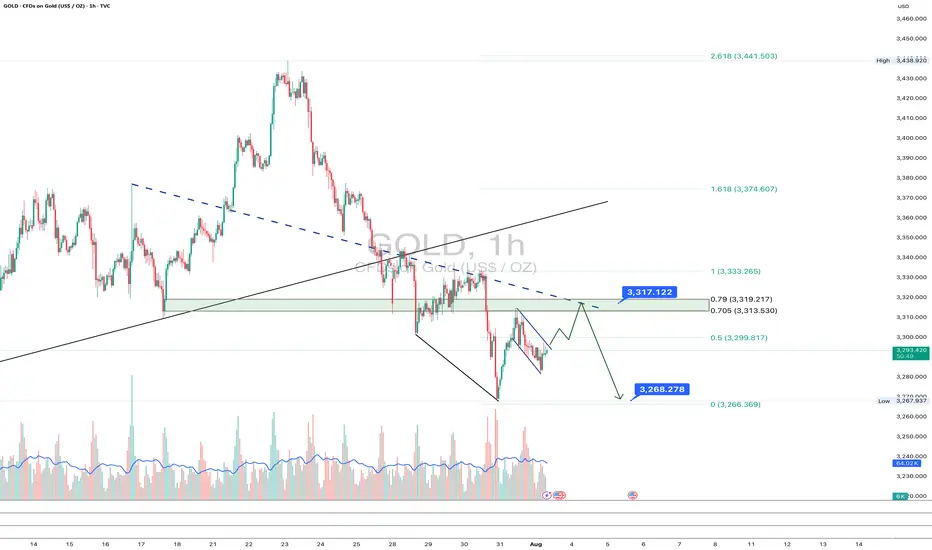
Gold: final pullback or bull trap?On the 1H chart, gold (GOLD) is forming a bullish flag after a sharp decline, which may just be a corrective move within a broader downtrend. The price is now approaching the key resistance zone around $3313–$3317 - this area holds the POC, broken trendline, and the 0.705–0.79 Fibonacci retracement from the last drop. This is the decision-making zone.
If bulls fail to push above it, we expect a move down toward $3268 - the next strong support and potential buy zone, also confirmed by Fibonacci and local demand. Stochastic divergence and slowing volume suggest a possible rebound from that level. However, if the price breaks and holds above $3317, this would indicate a local trend reversal, with targets at $3333 and $3374.
Watch the $3317 zone closely - bulls have yet to prove this is more than just a bounce.
FLAG
BTCUSD – Descending Channel or Bullish Flag?BINANCE:BTCUSDT – Market Maker’s Game Inside a Descending Channel
Timeframe: 2H | MJTrading View
Market Structure Overview:
Bitcoin recently printed a new ATH at $122,000 after a parabolic run from the previous ATH at $111,937.
Since then, price has been consolidating inside a descending channel, which could act as a bullish flag in higher timeframes.
Liquidity pools are clearly formed:
Above $122K – resting stops of late shorts.
Below $115K–$114K – weak long stops and untapped demand near the Order Block (OB).
Key Levels & Liquidity Zones:
Upside:
$122K Liquidity Pool → If swept, could trigger momentum towards $124K–$125K.
Downside:
$116K OB → First defensive zone for bulls.
$112K Strong Support → Aligns with previous ATH breakout base.
Market Maker’s Dilemma:
If you were a market maker… which liquidity pool would you hunt first?
Price is coiling tighter within the channel, and both scenarios are possible:
Upside Sweep → Rapid breakout above $122K to clear shorts, then potential continuation.
Downside Sweep → Sharp drop into $116K–$112K liquidity, flushing longs before any recovery.
⚡ MJTrading Insight:
This is the classic market maker compression – first sweep likely determines direction.
Patience here is key; let the liquidity tell the story.
#BTCUSD #Bitcoin #Liquidity #SmartMoney #PriceAction #MJTrading #ChartDesigner #CryptoAnalysis
Psychology Always Matters:

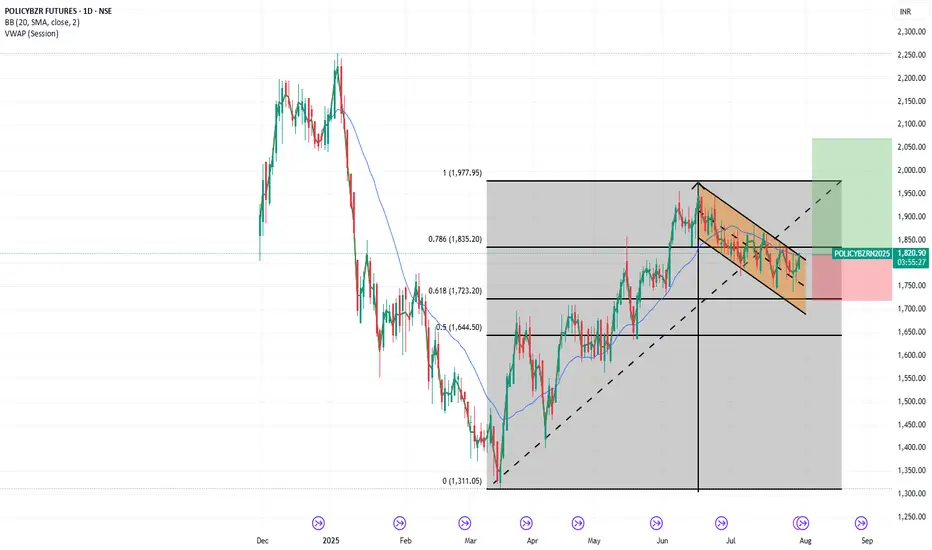
POLICYBZRPolicybzr breaking out of consolidation of over a month time & made flag pattern on daily charts while taking support from 100 MA as well 0618 fib retracement level. With all indicators suggesting long.
Risk: Reward = 1:2.5
Short term traders can trade with target of 1900 & stoploss of 1750
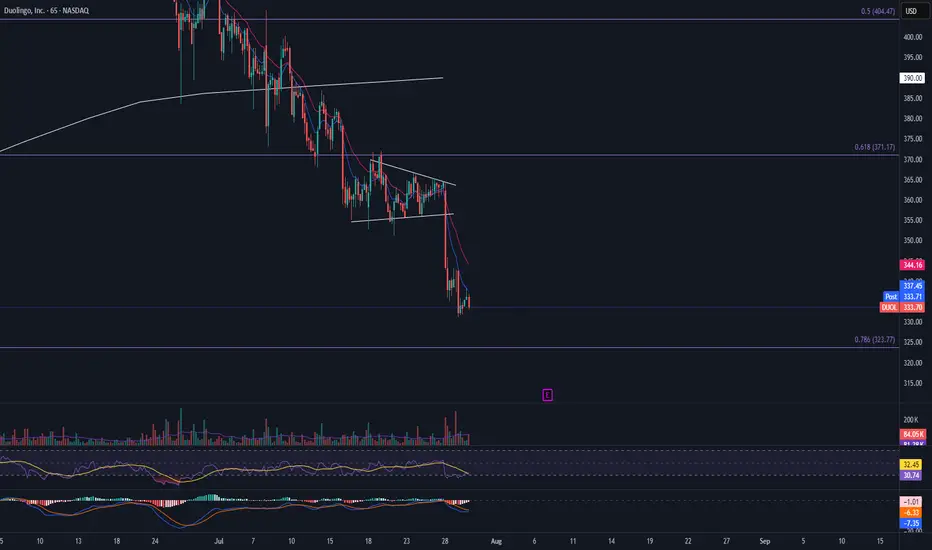
DUOL Bear Flag Break
DUOL has broken the bear flag down and continuing its move towards the 786 FIB level. I would want to see a bounce off this level and then a following close above the 9 EMA on the daily chart.
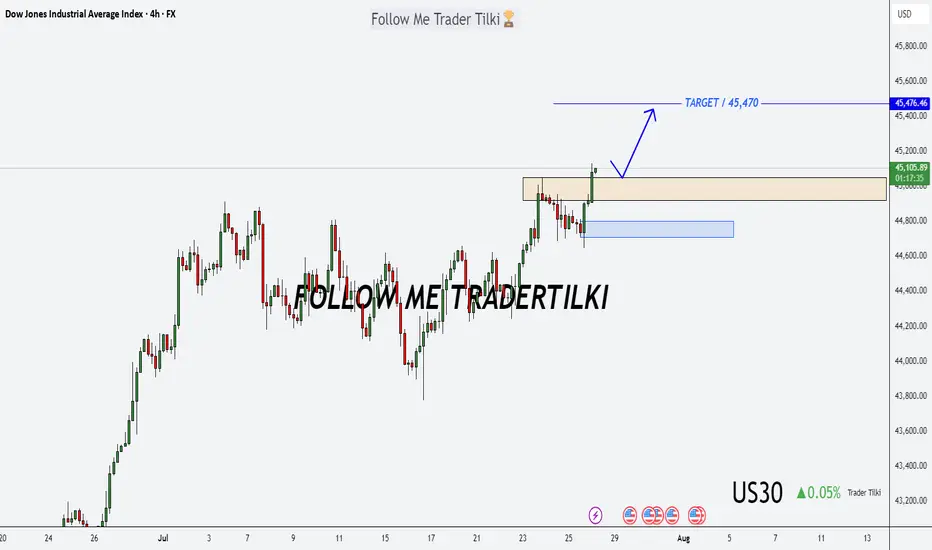
US30 Forecast: Target Locked, Buy Zones in Sight!Good morning friends ☀️
I've prepared a fresh analysis for US30 (Dow Jones).
My current target is 45,470. Even if the price dips to 45,050 or 44,800, I fully expect it to reach that 45,470 mark.
These levels represent strong buying zones and powerful retest regions—don’t forget that.
Every like from you is my biggest source of motivation to keep posting these insights. 💬📊
Big thanks to everyone supporting with a thumbs-up.
NZDCHF - Can we make it back to previous highs?NZDCHF has been shaping up for the next price movement as bulls strongly rejected any further downside and created a strong reversal impulse which should gain some momentum.
Good Luck

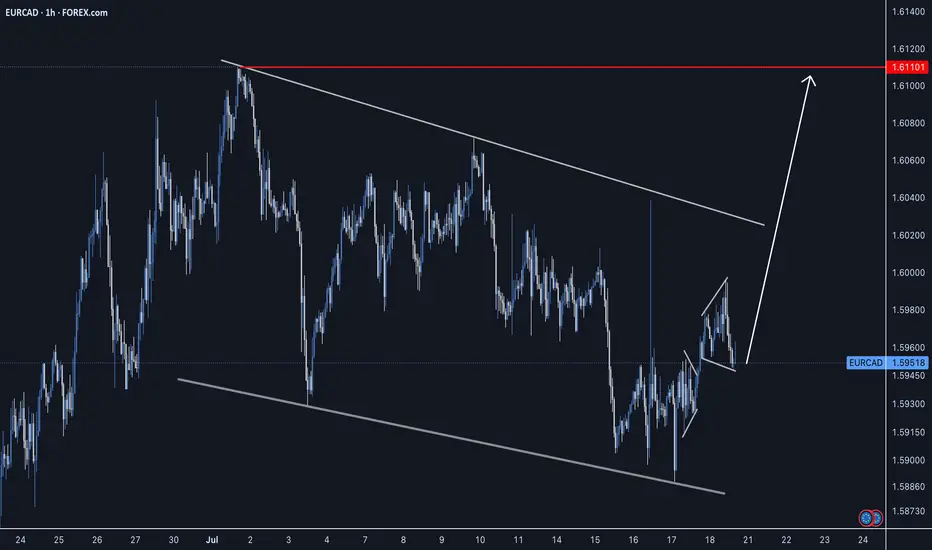
EURCAD - Long Setup - Impulse, Correction, ImpulsePrice action has been setting up for the next impulse phase as we can the bullish continuation is completing to indicate price has further growth. Looking for a long entry this upcoming week.
Good Luck
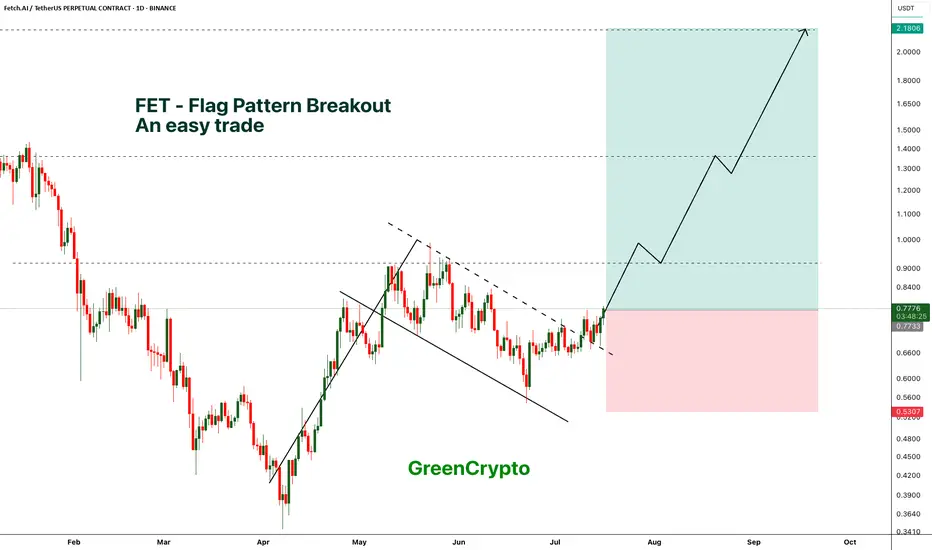
FET - Perfect trade for beginner- FET is breaking out from the flag pattern and we have clear and confirmed breakout
- most of the like flag pattern breakout succeeds, this gives a high confidence trade
Entry Price: 0.775 (current price)
Stop Loss: 0.5307
TP1: 0.9072
TP2: 1.1495
TP3: 1.3791
TP4: 1.7927
TP5: 2.1468
Max Leverage 5x
Don't forget to keep stoploss
Cheers
GreenCrypto
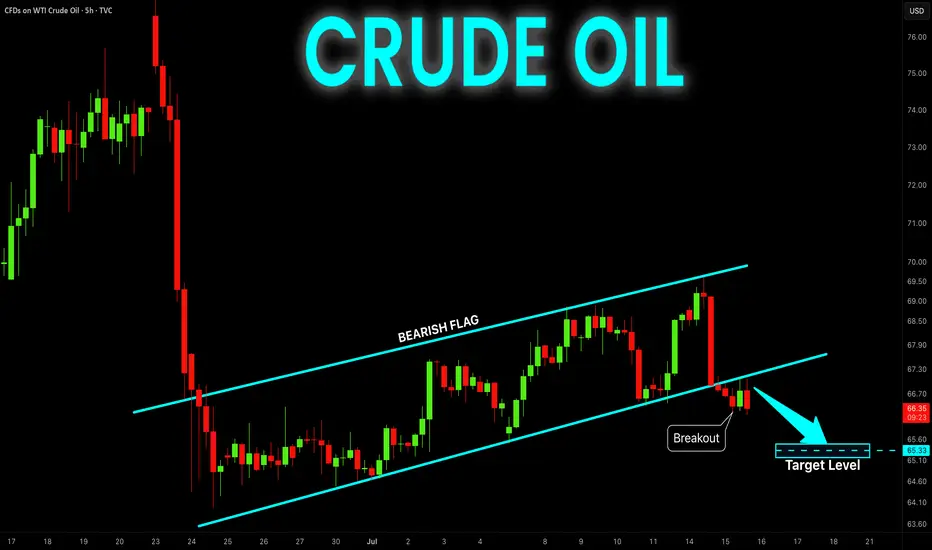
CRUDE OIL Bearish Flag Breakout! Sell!
Hello,Traders!
CRUDE OIL is trading in a local
Downtrend and formed a bearish
Flag pattern and now we are
Seeing a bearish breakout
So we are bearish biased
And we will be expecting
A further bearish move down
Sell!
Comment and subscribe to help us grow!
Check out other forecasts below too!
Disclosure: I am part of Trade Nation's Influencer program and receive a monthly fee for using their TradingView charts in my analysis.
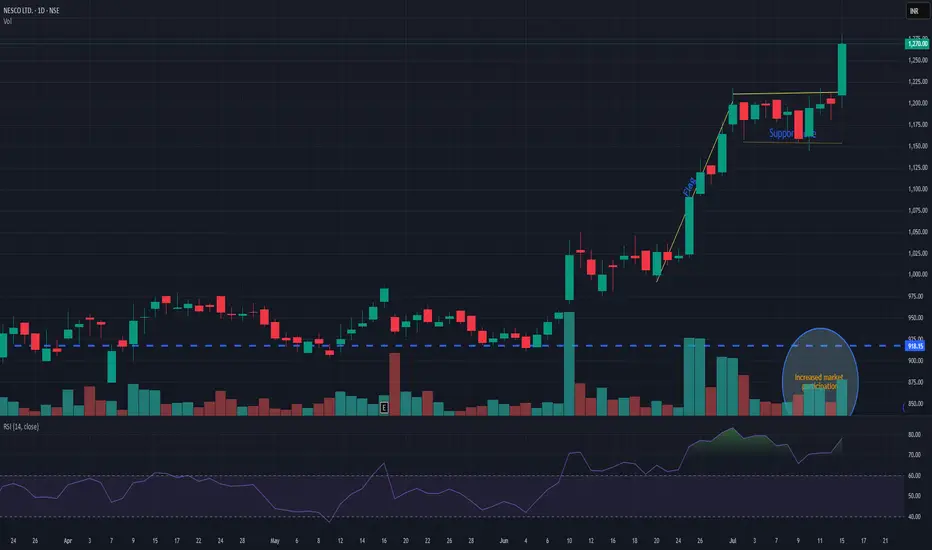
NESCONESCO giving flag pattern breakout with decent volume. Support is seen nr 1180. while pole initiation can be seen near 1010. Currently trading near 1270. It has a potential for new momentum. Keep it on radar.
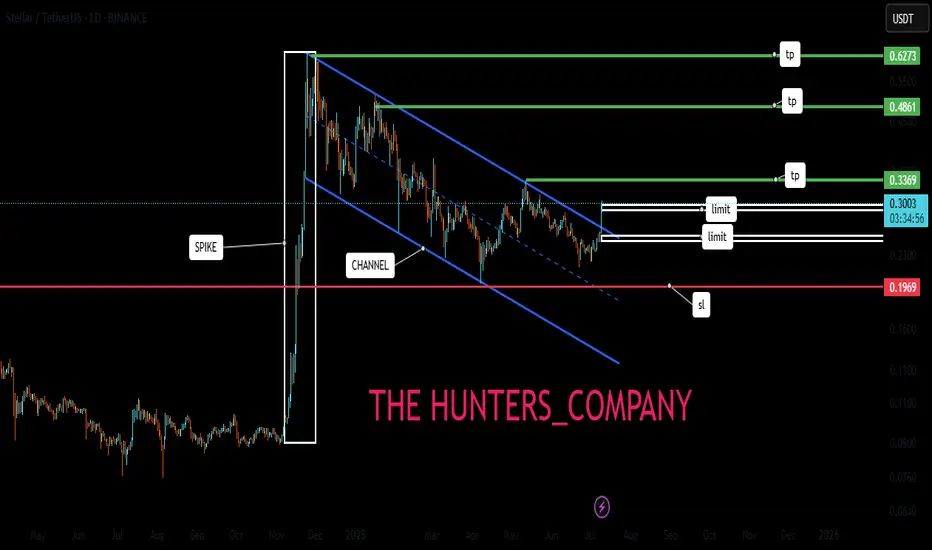
XLM/USDT;FREE SIGNALHello friends🙌
Given the good price growth, you can see that the price has entered a channel, which has caused the price to form a flag...
Now, with a strong channel breakdown by buyers and their entry, you can enter the trade with risk and capital management and move with it to the specified targets.
🔥Join us for more signals🔥
*Trade safely with us*
TRADING IDEA - US CRUDE OIL - BEARISH FLAG, CONCERNS ON GLOBAL EFOREXCOM:USOIL
The US Crude Oil prices went down yesterday, mostly because of the tariffs and concerns on demand.
Here is what the Bloomberg is writing: " OPEC+ is discussing a pause in its oil production increases from October is fueling concerns about a slowdown in global energy demand. In addition, the intensification of US tariffs risks slowing global economic growth and energy demand after President Trump ramped up tariffs on numerous countries this week, including a 50% tariff on Brazil."
So, despite the pause in oil production increase, which is supposed to be bullish factor the oil prices, we may see the slowdown in global economy and supposedly a recession because of Trump's tariffs. This is a long-term bearish factor for the oil. I think that we will see another bearish impulse here, according to what we observe on the chart.
There is a nice bearish flag and i am planning to short it with a target nearby 6,540.00 support level.
🔽 a pending sell stop order at 6615.3 with
❌a stop loss at 6680.9 and
🤑a take profit at 6544.0
Trade cautiously! Preserve your deposits!

BTCUSDBullish Alt record high targets Bullflag
Different SL for different Risk takers
BTCUSD BULL TRADE
I will share traget
* I share The chart earlier but there was some error so posting again
How to Spot Flag Patterns on TradingViewLearn to identify and trade flag patterns in TradingView with this step-by-step tutorial from Optimus Futures. Flag patterns are continuation formations that help traders join existing trends by buying high and selling higher, or selling low and buying back lower.
What You'll Learn:
• How to identify bullish and bearish flag patterns on any timeframe
• Breaking down flag patterns into two parts: the flagpole and the flag
• Finding strong flagpole formations with fast, obvious price moves
• Spotting flag consolidation areas that form tight ranges
• Why flag patterns work: buyer and seller psychology explained
• Real chart examples showing how flag patterns develop and play out
This tutorial may help futures traders and technical analysts who want to trade with market trends rather than against them. The concepts covered could assist you in identifying opportunities to join strong price movements when they pause before continuing.
Learn more about futures trading with Tradingview: optimusfutures.com
Disclaimer:
There is a substantial risk of loss in futures trading. Past performance is not indicative of future results. Please trade only with risk capital. We are not responsible for any third-party links, comments, or content shared on TradingView. Any opinions, links, or messages posted by users on TradingView do not represent our views or recommendations. Please exercise your own judgment and due diligence when engaging with any external content or user commentary.
This video represents the opinion of Optimus Futures and is intended for educational purposes only. Chart interpretations are presented solely to illustrate objective technical concepts and should not be viewed as predictive of future market behavior. In our opinion, charts are analytical tools—not forecasting instruments. Market conditions are constantly evolving, and all trading decisions should be made independently, with careful consideration of individual risk tolerance and financial objectives.

India vs ChinaYear to date, NIFTY has underperformed China - but not recently. Nifty outperformed HSCEI by nearly 20% pts between mid-Mar to mid-Apr and the over the last 2 months, gave back nearly half of these gains! What happened next?
The pullback appears to be a "flag" pattern - typically a bullish continuation - if this breakout holds (stays above 2.9 for NIFTY/HSCEI), Then the measuring implication is a whopping 3.5 - an outperformance of 18-20% pts.
Long Nifty/ HSCEI, currently ay 2.95; stops at 2.85

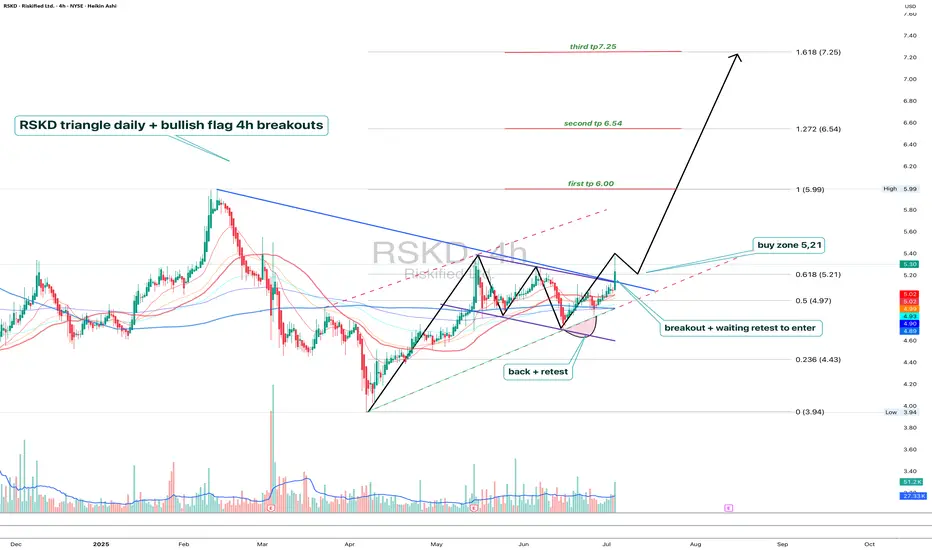
RSKD - breakout confirmed, now waiting for retestRiskified (RSKD) shows a textbook breakout setup: daily triangle plus 4H bullish flag. Price already broke out and is now retesting the 0.618 Fibonacci retracement at $5.21, which also matches the flag resistance flip and EMA cluster. This is a clean buy zone with strong technical alignment.
Volume spiked during the breakout, trend structure remains intact, and moving averages are converging — usually a precursor to strong moves. The current pullback is orderly, and if buyers show strength on this retest, the price could target $6.00, then $6.54, and potentially $7.25 (1.618 extension).
Fundamentally, Riskified offers fraud prevention tech for e-commerce. The business is benefiting from global growth in online transactions and improved margin control. While still unprofitable, recent quarters showed progress toward positive operating leverage and strong client acquisition.
Tactical plan:
— Entry on confirmation from $5.21 retest
— TP1: $6.00
— TP2: $6.54
— TP3: $7.25
— SL: below $4.90 or $4.43 support zone
You’ve been watching this one. The triangle broke. The pullback is clean. Maybe it’s time to stop watching and start participating.
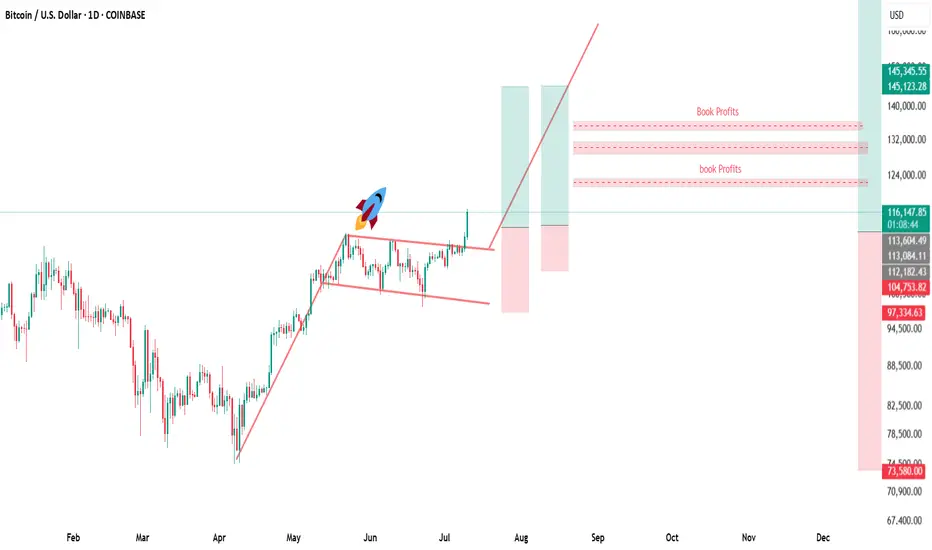
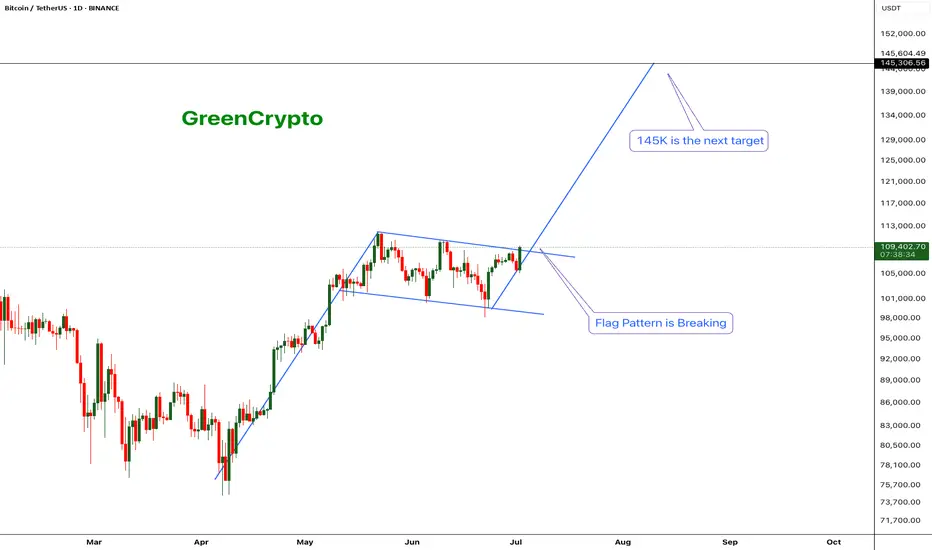
Bitcoin - Flag pattern is brokenBitcoin had been consolidating within a flag pattern for the past three months. That pattern has now officially broken to the upside, with the price surging to $109K — a strong bullish signal fueled by encouraging news around institutional adoption.
Based on both the technical flag breakout and ongoing fundamental momentum, the next target for Bitcoin is $145K. Any move beyond that would be considered a bonus in this current bull cycle.
Stay tuned for more updates.
Cheers,
GreenCrypto
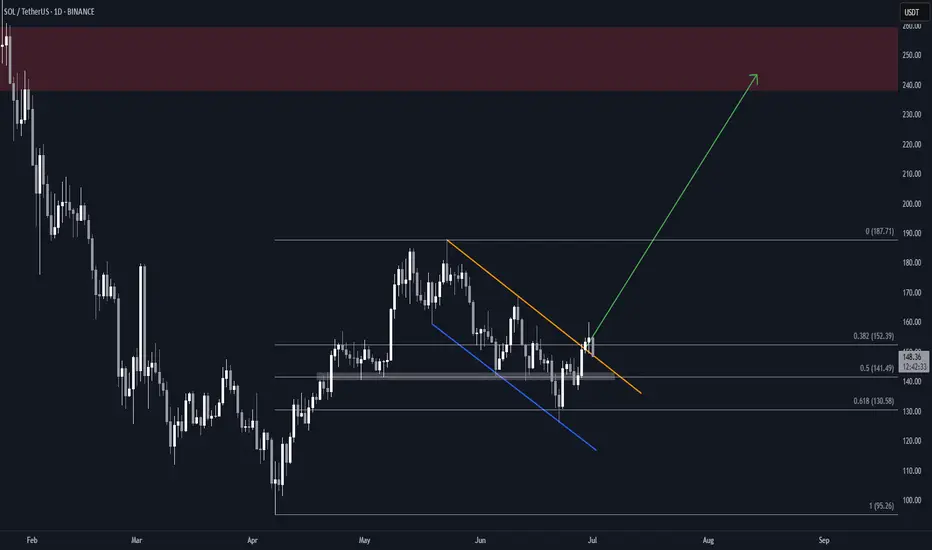
Solana (SOL) Flag & Pole Breakout (1D)BINANCE:SOLUSDT broke out of a textbook falling wedge two days ago, and is now retesting the former resistance as support.
Key Technicals
• Falling channel with clean structure and multiple touches
• Resistance trendline broken
• Price now retesting the breakout zone (~$148)
• Overhead supply zone at $238–$260
• Measured Target: $240, within supply
Why This Setup Matters
• Clear breakout followed by a retest, which can often precede the next leg up if support holds
• Falling channel retracement aligns with 0.618 Fib, a common reversal area
What to Watch
• Daily close above the previous resistance trendline
• Push above the local $160 high for full confirmation
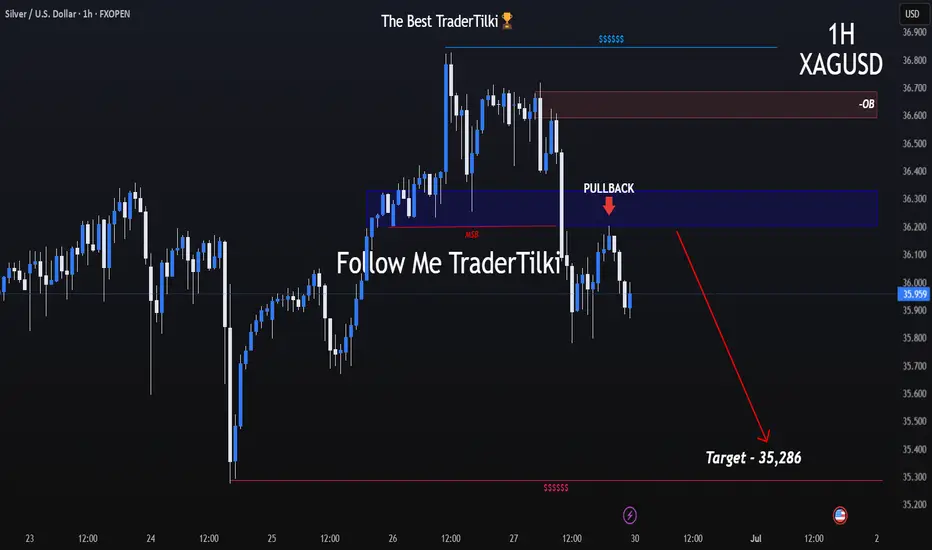
Is the Uptrend Over? Critical Break on the Silver 1-Hour ChartHey everyone,
After the upward trend structure on XAGUSD broke down, the support level was breached, followed by a pullback. Because of this, my target level is 35.286.💬
Also, keep a close eye on key economic data releases on the fundamental side, as they could significantly influence your strategy.
I meticulously prepare these analyses for you, and I sincerely appreciate your support through likes. Every like from you is my biggest motivation to continue sharing my analyses.
I’m truly grateful for each of you—love to all my followers💙💙💙
FLAGPIIND fut made flag n pole pattern after consolidation on daily hourly charts with all 4 indicators suggesting long.
Accum/Dist :- 4.40 m
OI :- -9.91% (short covering)
RSI:- 69
MACD :- 68
Could b bought wih stoploss of 4075 & target of 4235.

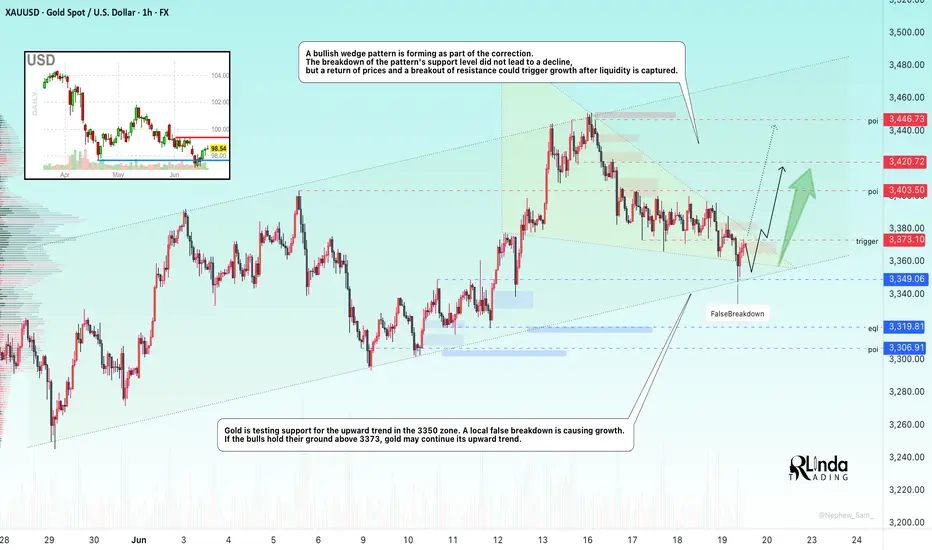
GOLD → Continuation of the global trend... To 3350?FX:XAUUSD is testing trend support within a correction. Against a complex fundamental backdrop (the Middle East, Fed comments, Trump's desire to lower rates), the price may continue to rise.
The price of gold rose from a weekly low of $3,363 on Thursday thanks to increased demand for safe-haven assets following reports of possible US strikes on Iran. Markets are ignoring the Fed's hawkish decision to maintain its tight policy and rate forecasts. Traders are waiting for new signals from the Middle East, given the risk of increased volatility due to low liquidity in connection with the US holiday.
Technically, a bullish wedge pattern is forming as part of the correction. The breakdown of the pattern's support did not lead to a decline, but a return of prices and a breakout of resistance could trigger growth after liquidity returns.
Resistance levels: 3373, 3403, 3420
Support levels: 3349, 3320
Before growth, a retest of the trend support or the 3350 zone is possible. However, if the price goes above 3375 and the bulls hold their ground above this level, then we can expect growth to continue within the trend.
Best regards, R. Linda!
BTCUSD: Decoding the Price Action Through "Tape Reading"🚀 BTCUSD: Decoding the Price Action Through "Tape Reading" 🚀
Hey Traders,
Let's dive into a "tape reading" analysis of BTCUSD, breaking down the recent price movements and looking ahead. We've seen some fascinating patterns emerge, and understanding them could be key to our next moves.
🔍 A Look Back: The Bullish Flag Formations 🔍
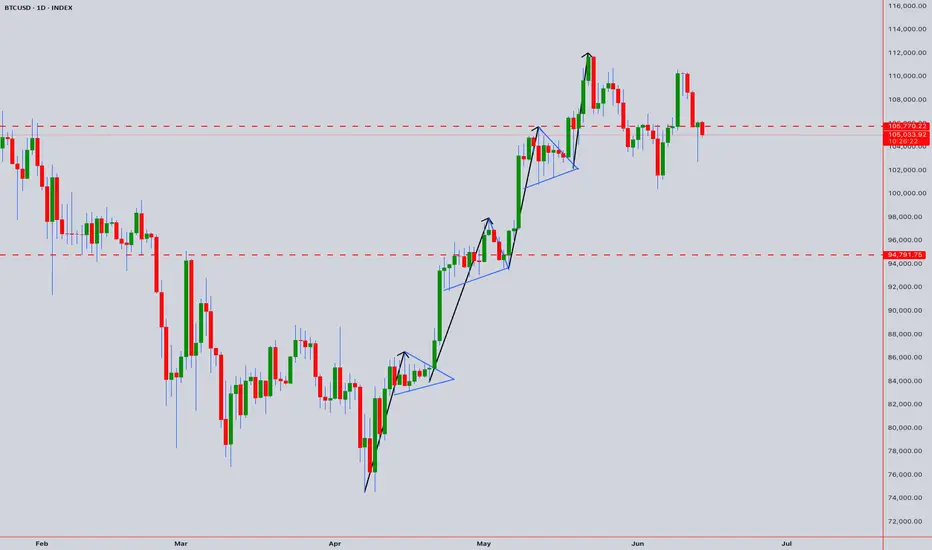
Our journey begins on April 7th, 2025, with the establishment of a strong "Flag Pole" at $74,489.00. This was supported by a robust double bottom, setting the stage for what was to come.
First "Flag" Confirmation: We saw the first "Flag" form, confirmed by a powerful "Hammer" candle on April 20th, 2025. This Hammer, with its unique "bottom-less Marubozu" body, signaled significant underlying strength.
Second "Flag" Confirmation: Another "Flag" emerged, solidified by strong multi-day bottom support around $94,791.00. This resilience suggested continued upward momentum.
The Breakout: On May 8th, 2025, BTCUSD surged, breaking out of its previous patterns and entering a new "flag pole" formation.
Third "Flag" & All-Time High: May 15th, 2025, brought the third "Flag" formation, again supported by a "Hammer" and a bullish Marubozu. This momentum culminated in a breach of the $105,770.00 multi-month price level on May 20th, 2025, breaking the previous all-time high from December 17th, 2024! We then rocketed to a new all-time high of $112,000.
📉 Recent Developments: The Downtrend and Key Levels 📉
Since the all-time high, we've started to experience a shift:
Downtrend Begins: A downtrend initiated around May 22nd, 2025.
High-Low Formations: We observed a second high-low formation on May 27th, 2025, followed by another on June 9th, 2025.
Double Top & Hanging Man: A clear double top formation emerged, further supported by a "Hanging Man" candle on June 10th, 2025.
🔮 What's Next? The Critical Close 🔮
Today's candle close is absolutely paramount! As of now, the candle is still forming, but my current read suggests a potential move to fill the wick of the June 13th, 2025, "Hammer" candle.
The direction BTCUSD takes – North or South – will largely be dictated by how today's candle closes. This will be our prime dominant signal.
Monthly Candle Perspective:
Interestingly, the Monthly candle is showing similar "Flag" patterns. Check out the chart here for a broader perspective:
Let me know your thoughts in the comments below! Are you seeing the same patterns?
Trade safe!
_________________________________________________________________________________
⚠️ Disclaimer: This post is educational content and does not constitute investment advice, financial advice, or trading recommendations. The views expressed here are based on technical analysis and are shared solely for informational purposes. The stock market is subject to risks, including capital loss, and readers should exercise due diligence before investing. We do not take responsibility for decisions made based on this content. Consult a certified financial advisor for personalized guidance.
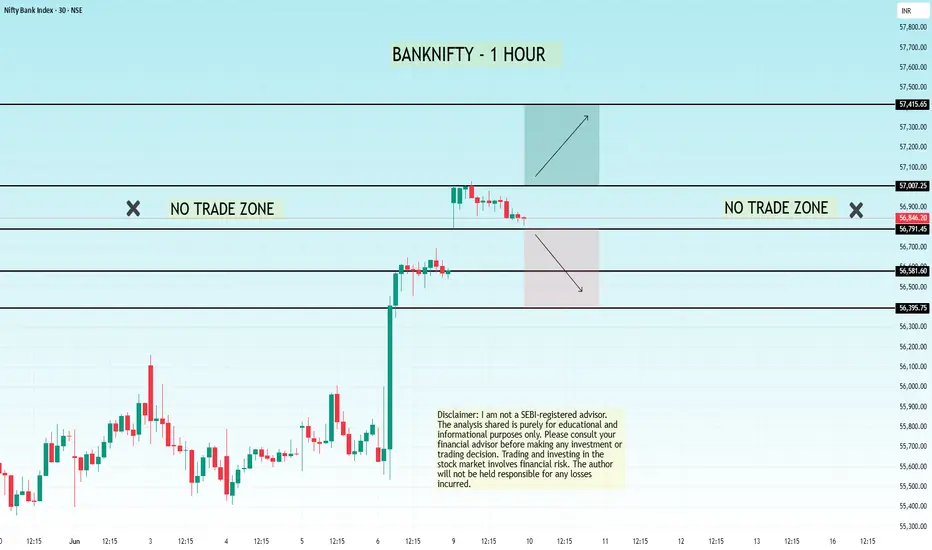
#banknifty - 10th June! NSE:BANKNIFTY NSE:BANKNIFTY1!
Understand the chart, observe the analysis, implement while trading:
Key Observations:
1. Trendlines:
- Resistance Trendline: A descending trendline (sloping down) marks the area where the price faces selling pressure. This indicates a pattern of lower highs.
- Support Trendline: An upward-sloping trendline beneath the price indicates where the price finds buying interest. This suggests a slight upward momentum at the support level.
2. Consolidation Zone:
- The price is moving within a tightening range between these two trendlines, forming a wedge or triangle pattern. This indicates consolidation, where the market is waiting for a breakout or breakdown.
3. Support Levels:
- Key support levels are highlighted at 53,407.75, 53,229.05, 53,057.45, and 52,784.15. These levels represent zones where buyers are likely to step in and prevent further price decline.
4. Resistance Levels:
- Resistance levels are marked at 53,679.35, 53,956.65, 54,128.90, and 54,304.25. These are zones where the price may face selling pressure.
5. Current Price Action:
- The price is currently at 53,577.70, approaching the descending resistance trendline. This is a critical point because it suggests a decision zone for the next move.
Scenarios:
1. Bullish Breakout:
- If the price breaks above the descending resistance trendline, it could signal bullish momentum.
- Potential targets are the next resistance levels at 53,956.65, 54,128.90, and 54,304.25.
2. Bearish Breakdown:
- If the price breaks below the support trendline, it may indicate a bearish trend.
- Possible downside targets are the lower support levels at 53,229.05, 53,057.45, and 52,784.15.
3. Neutral Consolidation:
- If the price continues to move within the wedge, traders may need to wait for a clear breakout or breakdown before acting.
What This Chart Suggests:
- The chart highlights decision points for the market, with the wedge pattern indicating an imminent breakout or breakdown.
- A breakout above resistance would suggest strength, while a breakdown below support would indicate weakness.
Trading Plan:
- For Buyers: Wait for a breakout above the resistance trendline and aim for higher resistance levels.
- For Sellers: Look for a breakdown below the support trendline and target the lower support zones.
Not SEBI Registere.