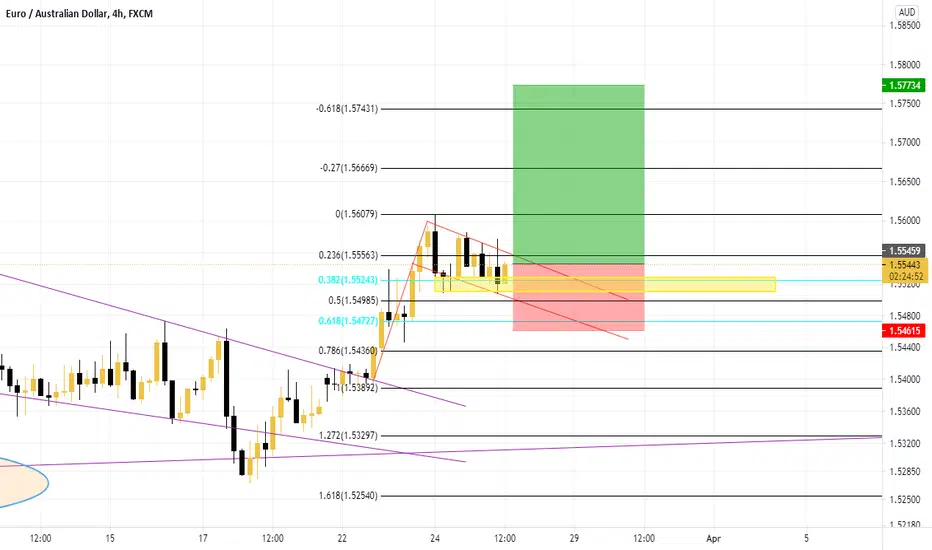
EURAUD Bullish Flag? I am expecting a some bullish pressure.
1. Price has found support and appears as if it's setting up for a chance to breakout out of the bullish flag.
2. Price respected the lower trendline of the flag pattern.
3. Price also retraced and found support at the 50.0 Fibonacci level.
The combination of the previous 3 statements eludes that there is a MAJOR support area at that location. It will take heavy bearish pressure to fall below this zone.
I already entered this trade, but to be safe one can set a buy stop above the channel to be safe.
This break out may take some time to form, so if you enter set a decent size SL, and relax.
If one take a look at the daily time frame, you will also see that price formed a double bottom.
Price met support and has begun a push to the upside.
Flagformation
EUR/AUD Is Expected to Fly Soon 🚀🚀🚀💡 Trade Idea
📈 EUR/AUD | Buy Limit Order @ 1.5472
🎯 Target Profit 1.5566
🛑 Stop Loss 1.5435
❌ Do not risk more than 1% of your account on each trade
🙂 Good Luck !
Description:
The price is trading within a bullish channel formation where the price formed a bullish flag formation. A slight correction to the downside is expected to the 1.5472 USD mark and then we expect a breakout of the bullish flag formation to the upside and then it might reach the 1.5566 USD level.
-------------------------------------------------------------------------------------
Please press “Like” if you appreciate the trading idea 👍
“Follow” for more trading ideas in the future 👀
“Comment” below to share your thoughts with us and other traders 👥
-------------------------------------------------------------------------------------
Risk Disclaimer: All trading ideas published by “collegeofpips” are for educational purposes only. These posts can help you to enhance your trading skills, but please do your own research before opening any trading position. ⚠️

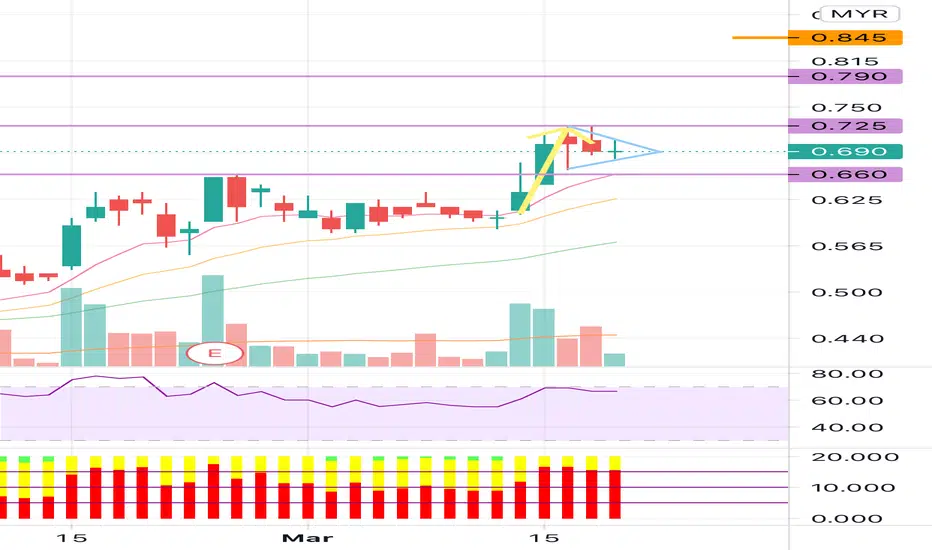
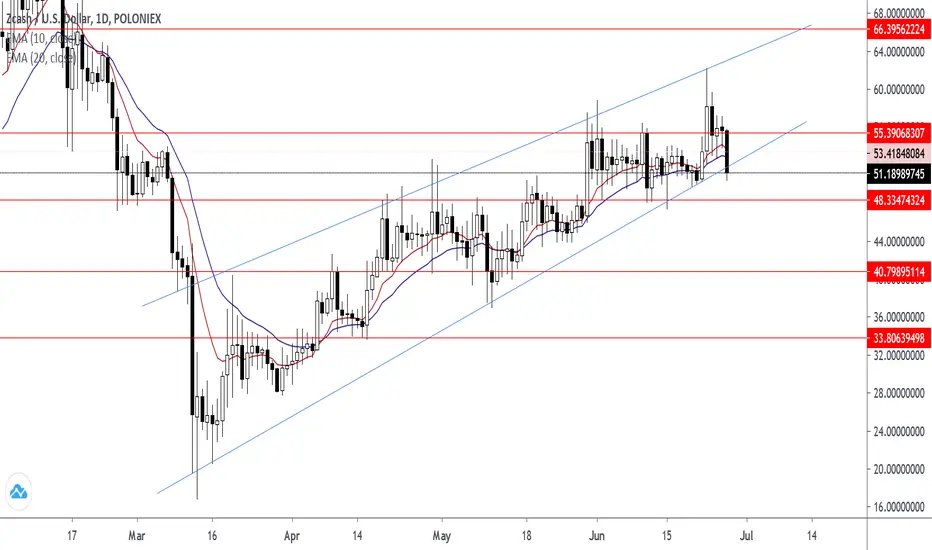
RLDoji appeared when forming pennant.
Monitor to see whether it can break out on 18 March.
R1: 0.725
R2: 0.79 (all time high)
Target: 0.84 based on “if” flag-pennant formation broke out
S1: Lower pennant line
S2: 0.66

USDCAD sell setup USDCAD mine own perspective so what's your consideration on the price movement please comment in the below section ?
I believe that. So what is your expectations in comment below.
So guys Let's look at it 😍😍😍🥰😍😍😍😍 with #hasanat_hussain_al_ahmed_hasan
Learn forex then thought to does earn
Stay With me
Stay With trading

Harmony/ONEUSD TetherUS In Harmony USD we see another bullflag forming on the one hour timeframe with higher lows and lower highs just like the previous formation.
On the previous breakout ONEUSD did a 80% climb.
Watchout for a breakout above the line for possibly a 40% minimum.
Goodluck!

BTC Daily outlook: Bullish flagHi guys.
Have been going through my previous analysis and I have to get back my old channel into play. We are bouncing actually multiple times off of the top line of the channel we have ben moving in the last 9 months before braking out of it in late December.
My point of view is that we will be bullish in the following month, and then to expect a great decline in March. Overall a great start of the year for BTC.
Not financial advice.
DYOR.
Cheers!

UMAUSDT is trying to have a breakout🦐$UMA.X is trying to have a breakout from a bullflag. IF the price will have a breakout upward and flip the current 4h resistance into new support, According to Plancton's strategy (check our Academy), we can set a nice order
–––––
Follow the Shrimp 🦐
Keep in mind.
🟣 Purple structure -> Monthly structure.
🔴 Red structure -> Weekly structure.
🔵 Blue structure -> Daily structure.
🟡 Yellow structure -> 4h structure.
⚫️ Black structure -> <4h structure.
Here is the Plancton0618 technical analysis, please comment below if you have any question.
The ENTRY in the market will be taken only if the condition of the Plancton0618 strategy will trigger.

QTUMUSDT is testing daily resistance 🦐QTUMUSDT is testing daily resistance and the price is creating a bull flag. IF the price will have a breakout and turns the current resistance as new support, According to Plancton's strategy (check our Academy), we can set a nice order
–––––
Follow the Shrimp 🦐
Keep in mind.
🟣 Purple structure -> Monthly structure.
🔴 Red structure -> Weekly structure.
🔵 Blue structure -> Daily structure.
🟡 Yellow structure -> 4h structure.
⚫️ Black structure -> <4h structure.
Here is the Plancton0618 technical analysis, please comment below if you have any question.
The ENTRY in the market will be taken only if the condition of the Plancton0618 strategy will trigger.

Short term Bullish Sentiment on the NZDThe NZD is bullish in the short term as the DXY weighs heavily on the US elections in November.
The country's GDP contracted in Q2 by -12.2% as opposed to the consensus of -12.8%.
After elections in New Zealand, leadership is said to be more inclusive and this might have a positive impact on the economy as it recovers.
The CFTC COT Weekly Data shows that investors remain long on the NZD futures with 6k+ net positions after 4k long positions were opened.
Technically, the NZDUSD is in a flag and I would expect the price to test the 2019 pivot highs after which I'll make an update
I'll keep an eye out for data and news from the US as stimulus deal talks resume and news of COVID19 treatment medicine and vaccine development continues to lift the US equity markets.

SPY - Measuring Flag WarningThe $SPX sell-off from September 2nd highs, created a consolidation range (orange rectangle) from $330-340 approximately.
Making a measured move, with the consolidation constituting a half-way measuring flag structure (blue arrows).
100 exponential moving average is now the trend support, coincidental with June highs. Unfortunately, this is not a support trend historically market makers pay special attention to.

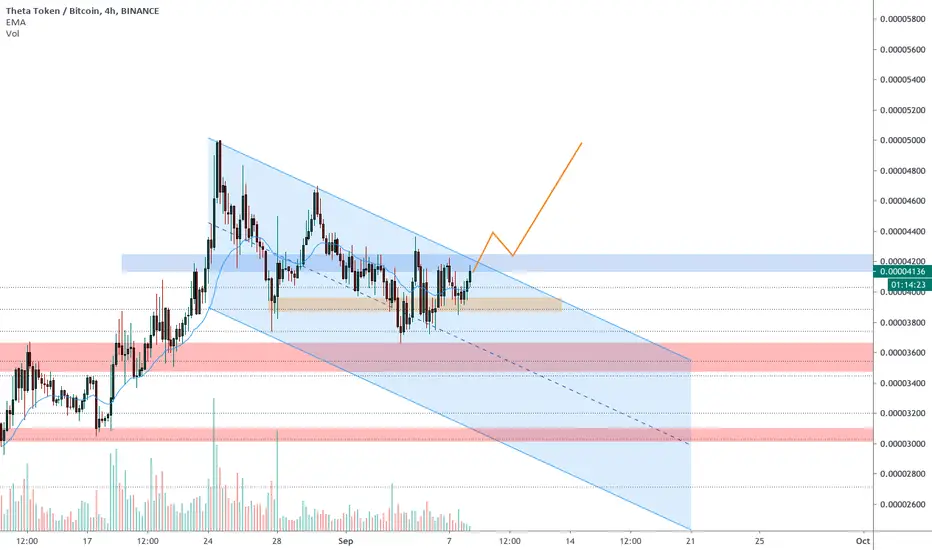
THETABTC in inside a bull flag 🦐After amazing profit ( +62% previous idea the price is inside a bull flag an it finds 4h support.
IF the price will have a breakout from flag According to Plancton's strategy, we can set a nice order
–––––
Follow the Shrimp 🦐
Keep in mind.
🟣 Purple structure -> Monthly structure.
🔴 Red structure -> Weekly structure.
🔵 Blue structure -> Daily structure.
🟡 Yellow structure -> 4h structure.
Here is the Plancton0618 technical analysis, please comment below if you have any question.
The ENTRY in the market will be taken only if the condition of Plancton0618 strategy will trigger.
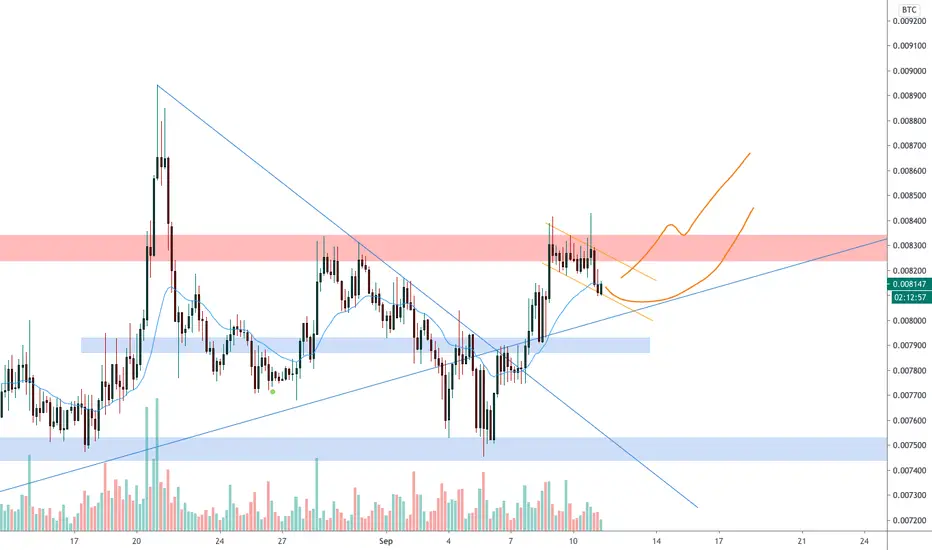
XMRBTC is creating a bullflag below weekly resistance 🦐XMRBTC is creating a bullflag below weekly resistance, after a nice recover.
IF the price will break the weekly resistance According to Plancton's strategy, we can set a nice order
Weekly
–––––
Follow the Shrimp 🦐
Keep in mind.
🟣 Purple structure -> Monthly structure.
🔴 Red structure -> Weekly structure.
🔵 Blue structure -> Daily structure.
🟡 Yellow structure -> 4h structure.
Here is the Plancton0618 technical analysis, please comment below if you have any question.
The ENTRY in the market will be taken only if the condition of Plancton0618 strategy will trigger.
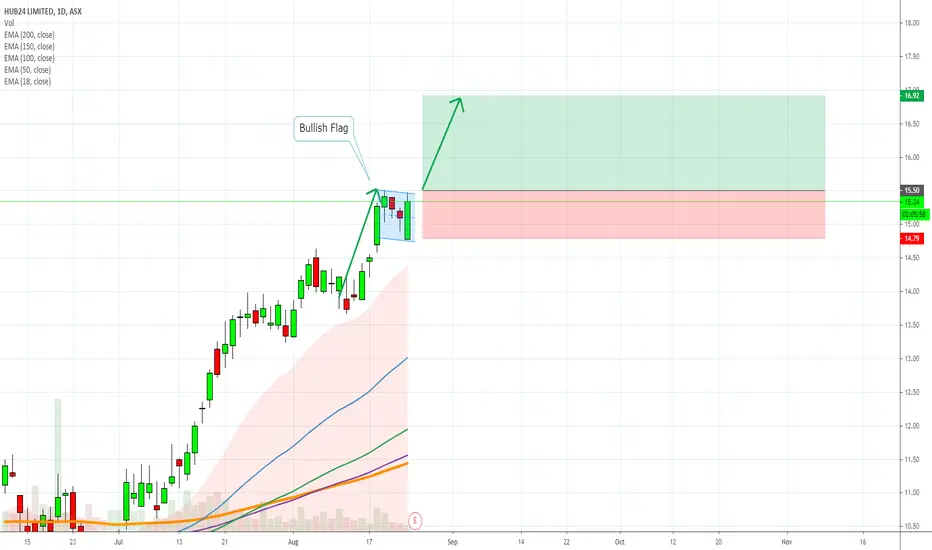
HUB - Bullish Flag - can the trend continue ?Technicals - High probabilty bullish flag formation. Fundamentals - record inflows continue and are likely to keep going/growing in this environment.
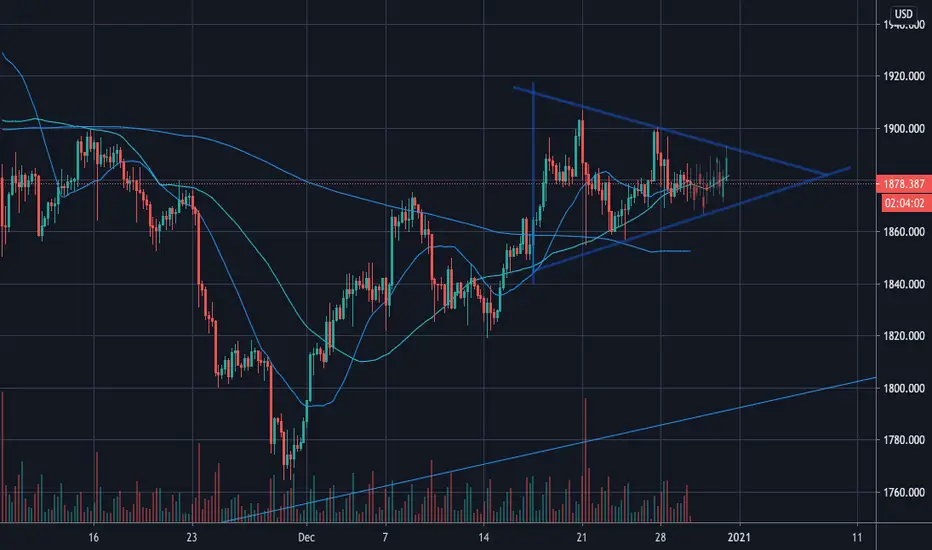
XAUUSD Flag Breakout - Bull SignalXAUUSD still in an uptrend now in flag formation. This has not yet broken the main up trend line so main direction is up.
Look to buy at bottom of flag or once we have a north breakout
Good luck!
Charles V
www.cvfxmanagement.com
Trading made Simple

ETHUSD is following BTCUSD 🦐ETHUSD create a bullish flag like BUTUSD
IF the price will break the 4h structure and retest it According to Plancton's strategy, we can set a nice order
–––––
Follow the Shrimp 🦐
Here is the Plancton0618 technical analysis, please comment below if you have any question.
The ENTRY in the market will be taken only if the condition of Plancton0618 strategy will trigger.

What Markets to Trade TomorrowChart analysis of Forex Markest on the Hourly, and M15 charts. What markets can we trade tomorrow based on what happened today.


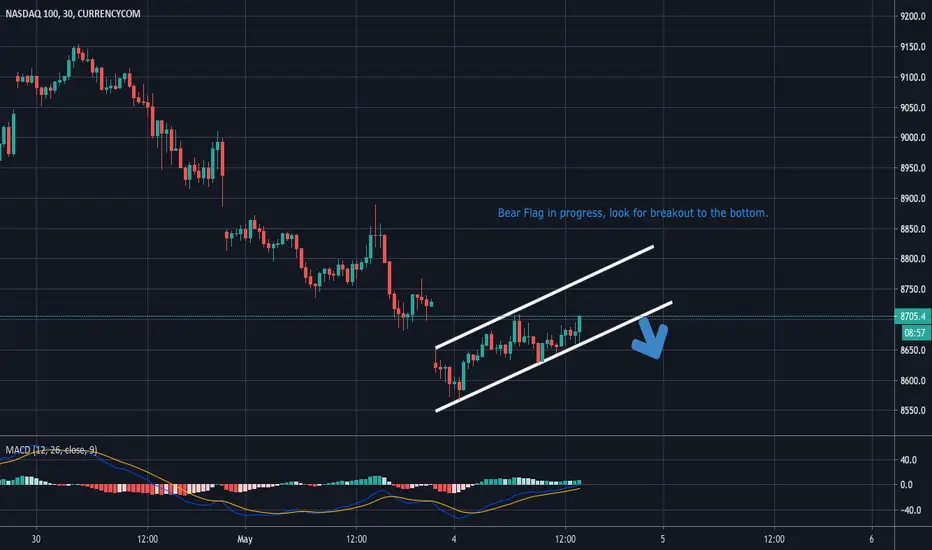
NASDAQ100 Bear FlagBear flag showing on the 30 minute chart. Possibility of a break to the down side.