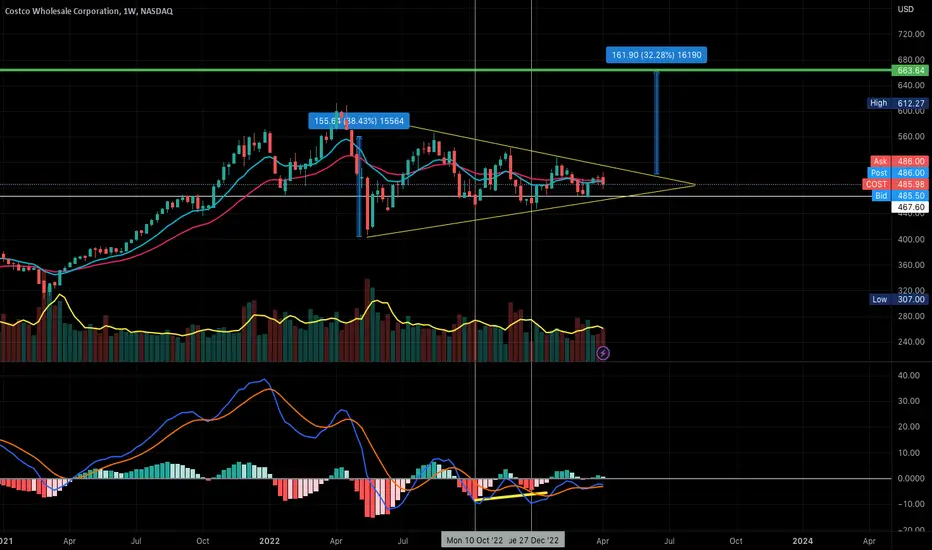
COST Costco flap and poleHey folks
Back with my signature flag and pole. Not into using crazy indicators here but just pure tech analysis.
COST giving a weekly flag and pole with divergence on macd.
Wait for 8-9 weeks for the next earning season and see it pop. Feel free to checkout my previous ideas and see how they faired.
Leave a comment and a subscribe for more ideas
Cheers
A
Flagformation
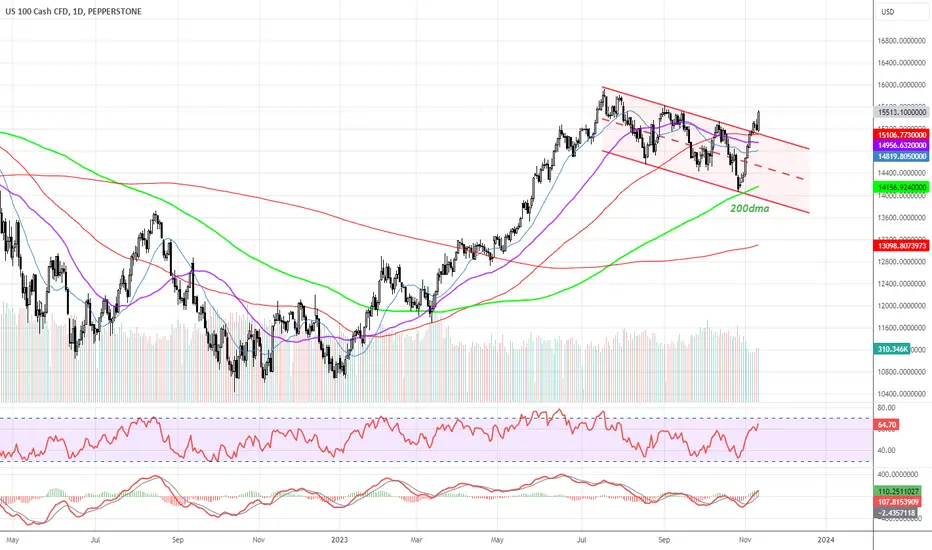
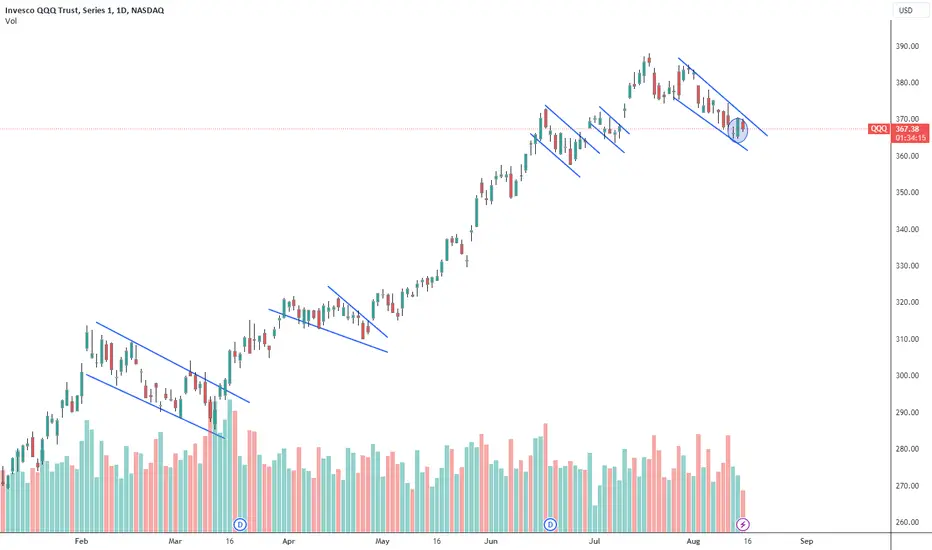
#NDQ Bullish flag breakoutI have no other ways to put this, but hard to see how this is negative with Nasdaq breaking above its bullish flag this week. Much higher targets in play here in the absence of some unknown which derails the rally.
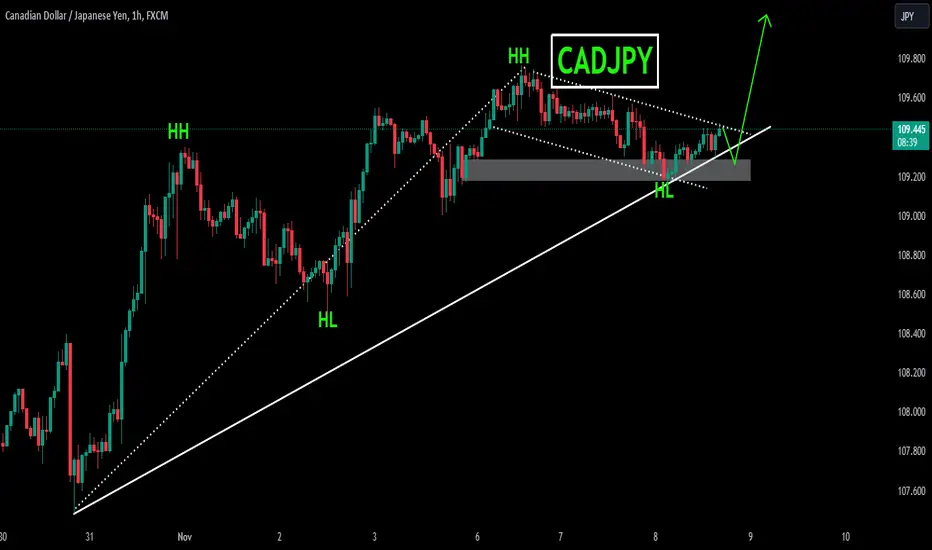
CADJPYCADJPY is in strong bullish trend.
As the market is consistently printing new HHs and HLs.
currently the market is retracing a bit after last HH, which is also the healthy retracement and local support as well. if the market successfully sustain this bullish confluence the next leg high could go for new HH
What you guys think of this idea ?
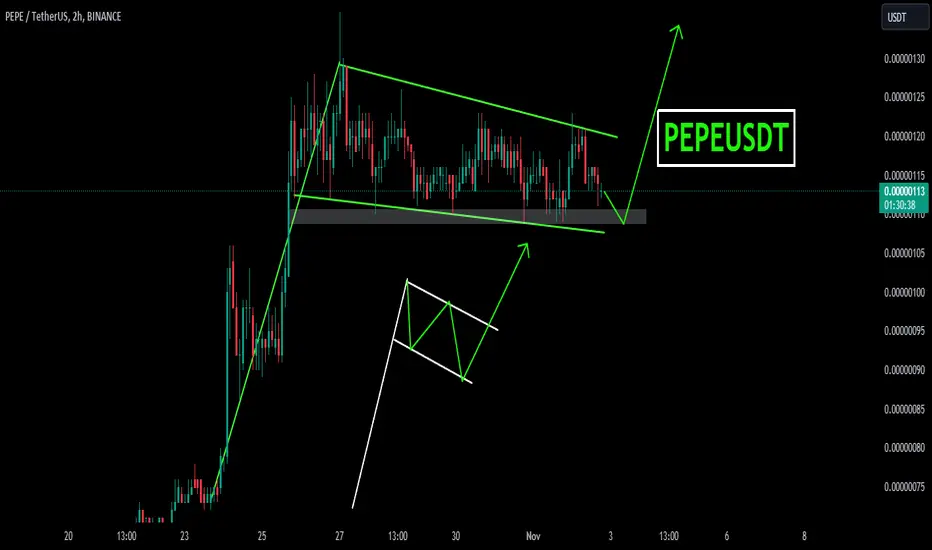
PEPEUSDTPEPEUSDT is in strong bullish trend.
As the market is consistently printing new HHs and HLs.
currently the market is being respected by inclining trendline and has also formed bullish flag pattern which is also being supported by inclining trendline.
These two to gather putting strong bullish confluence for the pair.
What you guys think of this idea
BTC/USD Daily Timeframe AnalysisIn the daily TF, after engulfing the $16,218 area, price started to accumulate. This accumulation took almost 60 days and BTC had very low fluctuation but after the accumulation price started to break all the SR lines and even the mid-term trend-line.
As a result of these engulfing these SR lines, we can see FTR zones were formed and had supported the rise in the price one after another. And also cased a formation of a very important base between $19,562 - $20,368. (Referring to the strength of this base and the pattern formed, we can consider this base an important Order Block).
By breaking out of the FTR zone $25,200 (orange) price formed a new FL between $24,745 - $32,376.
Generally, when price of BTC rose to $32,000 we can consider this a pullback to the DP of the weekly TF. And started to distribute.
In the current situation we must take the following into consideration:
⁃ currently price is ranging in a Flag ( indecision area) and non of FLs has been engulfed in order for us to have a clear for cast of BTC future moves !
⁃ As price is in downtrend in the higher TFs, and after making the pullback to the DP of the downtrend pattern price broke the mid-term uptrend trend-line.,The probability of engulfing the lower FL and descent of price to the base which was before the pole (FTR) is very high !
Kindly note that in Financial Market there are more than 1 scenario!
We in fact, by relying on rules and principles of Technical Analysis & also deep analysis of Fundamental Data, try our best in providing you with a thorough analysis together with e most probable scenario for the future values of assets and currencies.

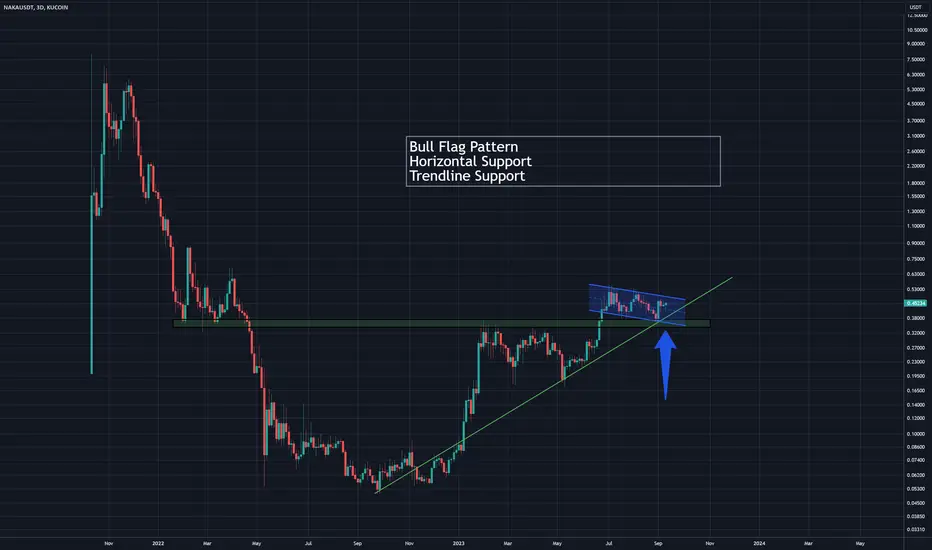
NAKAUSDT Bullish Flag On Support LevelNAKAUSDT Bullish flag pattern sitting on top of horizontal level of support. Also, note the trendline support level. Expecting a breakout.
Adv. Micro Dev. (AMD) -> Breakout TimeMy name is Philip, I am a German swing-trader with 4+ years of trading experience and I only trade stocks , crypto , options and indices 🖥️
I only focus on the higher timeframes because this allows me to massively capitalize on the major market swings and cycles without getting caught up in the short term noise.
This is how you build real long term wealth!
In today's anaylsis I want to take a look at the bigger picture on Advanced Micro Devices.
Just 9 months ago - after a quite harsh drop of more than 60% - Advanced Micro Devices perfectly retested the 0.786 fibonacci retracement level and reversed towards the upside.
With the overall trend still being massively bullish I am now waiting for and expecting a bullish breakout of the current flag pattern with my upside target being the previous all time high.
- - - - - - - - - - - - - - - - - - - -
I know that this is a quite simple trading approach but over the past 4 years I've realized that simplicity and consistency are much more important than any trading strategy.
Keep the long term vision🫡

CFX - 🚩 Flying High: Unveiling the Bullish Flag Formation 📈🚀On the weekly chart, CFX displays a promising bull flag formation. In the long term, it resembles a head and shoulders pattern around 0.09, with a favorable risk-reward profile. There are two resistance ladders on KDJ and Fisher indicators that need to be surpassed. The projected path is shown in black. The bull flag setup remains intact, even potentially retracing to the 0.07c area.
PS Notice the green highlights on indicators.

Linkusdt bullflag formation Linkusdt forming a bullflag in 4hr timeframe which is expected to breakout in coming days, link just touched a lower trend line and bounce from there this show's strong support there.
.
.
.
.
DYOR

Am I missing something?Well, am I missing something or this is just a continuation pattern? The last candlestick formation is bullish. I'm not sure to short the market now. Lets see how the week closes.
BTC Swing AnalysisHi friends.
Today im going to take a brief look at Bitcoin.
According to New Cryptocurrency market Catalyst , I mean
launching PayPal Stable coin , we can look at BTC chart Technically better.
So lets take a look:
1.After reaching price to the Middle line of drawn channel , it failed to break it.
so went approach lower channel line that overlapped with a strong support level(28000-28800 level)
2.When we reach this level , an Engulfing candle appears in 4H timeframe.
3.We have a strong fundamental Catalyst about PayPal stable coin(Remember that past Bullrun to 67000$ level starts with accepting Bitcoin by PayPal)
4.If we pass this area , the first target is 31800 and after that we have a strong resistance at 36500 level.
5.Classically , price is shaping a flag pattern that its target is the middle line of growing channel in around 33000 level.
Hope you enjoy my view in Bitcoin.
Share me your opinion in comments.
What do you think?

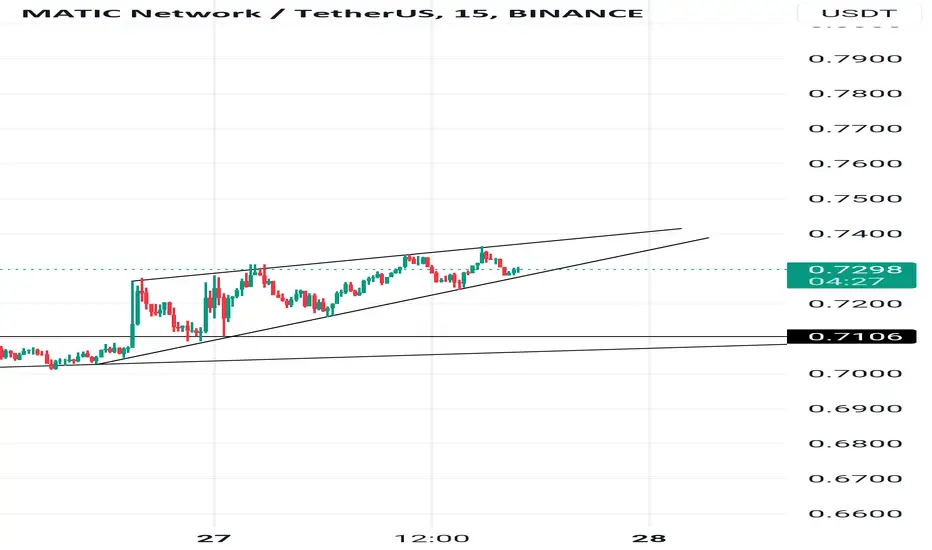
Maticusdt bull flag formation Matic forming a bull flag which is bullish pattern, if the BTC trade between 29000-30000 we may see breakout of flag , plan to enter only when you see the volume breakout to avoid fake breakouts. .
DYOR!!!

MaticusdtHello guys hope you all are doing well 🙏💓
Matic is forming bearish pattern (flag) in very short time period let's see wether it's breakout or breakdown. In this type of pattern mainly trend shift downside.
.
.
.
.
DYOR !!!!
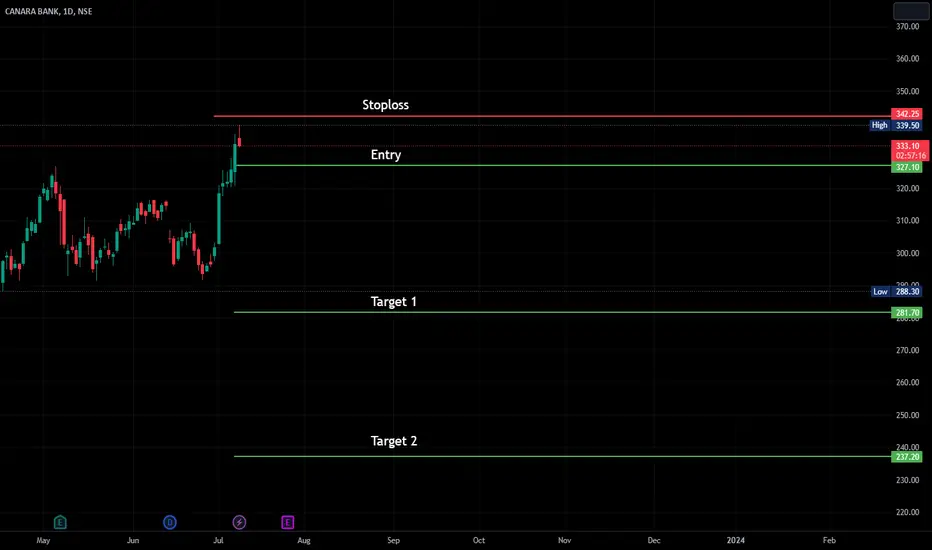
CANERA BANKCanera Bank
Time frame = Day
Pattern = Flag
Type Bearish
iT'S Risky Trade Small Stoploss And Big Target
Sell = 327.10
Stoploss= 342.25
Target 1 = 281.70
Target 2 = 237.20
NIFTY IN SUPER BULLISH MODE READY TO BULLISH INDIA
NIFTY SPOT TARGETS UPDATED
TARGETS BASED ON MONTHLY CHART - BULLISH FLAG WITH CUP AND HANDLE PATTERN. FOR EDUCATIONAL PURPOSE
Tgt 1 : 20243± (SHORT TERM)
Tgt 1 (A) : 21132± (SHORT TERM)
Tgt 2 : 22465± (LONG TERM - Maximum by Dec 2024)
Tgt 2 (A) : 25598± (LONG TERM - Maximum by 2026)
Tgt 1 & Tgt 2(A) tracking From 31/08/2022 when Nifty spot was trading at 17759.
Tgt 1(A) & Tgt 2 tracking From 01/06/2023 when nifty was trading at 18579.
Note : The above is my personal view based on chart pattern and shared it for educational purpose only.
In between ups and downs are quite common. Market will test us by some dips. No Gain without Pain.
Tgts get invalid when Nifty spot closes below 15000
If any Changes in the chart pattern I will share it during that time.
Used Support, Resistance, Chart Pattern and My Eyes as an Indicator.
Chances of hitting the tgt based on Chart Pattern 70 - 80%
Rest MARKET IS SUPREME.
Let's see how Market Behaves.
STAY INVESTED & ENJOY THE RALLY

EURCAD I Potential bearish flag breakout Welcome back! Let me know your thoughts in the comments!
** EURCAD Analysis - Listen to video!
We recommend that you keep this pair on your watchlist and enter when the entry criteria of your strategy is met.
Please support this idea with a LIKE and COMMENT if you find it useful and Click "Follow" on our profile if you'd like these trade ideas delivered straight to your email in the future.
Thanks for your continued support!

GBPCAD I Potential breakout coming soonWelcome back! Let me know your thoughts in the comments!
** GBPCAD Analysis - Listen to video!
We recommend that you keep this pair on your watchlist and enter when the entry criteria of your strategy is met.
Please support this idea with a LIKE and COMMENT if you find it useful and Click "Follow" on our profile if you'd like these trade ideas delivered straight to your email in the future.
Thanks for your continued support!

SPY Bear Flag?Can't help but see a giant textbook bear flag appearing on the daily chart. Anyone have thoughts?

GBPUSD I Possibly a break of the channel line +100 pipsWelcome back! Let me know your thoughts in the comments!
** GBPUSD Analysis - Listen to video!
We recommend that you keep this pair on your watchlist and enter when the entry criteria of your strategy is met.
Please support this idea with a LIKE and COMMENT if you find it useful and Click "Follow" on our profile if you'd like these trade ideas delivered straight to your email in the future.
Thanks for your continued support!

EURAUD I Correction completed from recent impulse - LONG Welcome back! Let me know your thoughts in the comments!
** EURAUD Analysis - Listen to video!
We recommend that you keep this pair on your watchlist and enter when the entry criteria of your strategy is met.
Please support this idea with a LIKE and COMMENT if you find it useful and Click "Follow" on our profile if you'd like these trade ideas delivered straight to your email in the future.
Thanks for your continued support!

CLEAR FLAG PATTERN this is a bullish flag pattern and market went below to touch the demand zone
and now we begin a ride to the supply zone for a hopeful breakout as to being a bullish flag.
note: there has to be a BOS/CHOCH confirmation before picking the trade not just touching of the flag lines.
and watch out for sweeping of liquidity
GBPNZD I Impulse flag and continuation
Welcome back! Let me know your thoughts in the comments!
** GBPNZD Analysis - Listen to video!
We recommend that you keep this pair on your watchlist and enter when the entry criteria of your strategy is met.
Please support this idea with a LIKE and COMMENT if you find it useful and Click "Follow" on our profile if you'd like these trade ideas delivered straight to your email in the future.
Thanks for your continued support!
