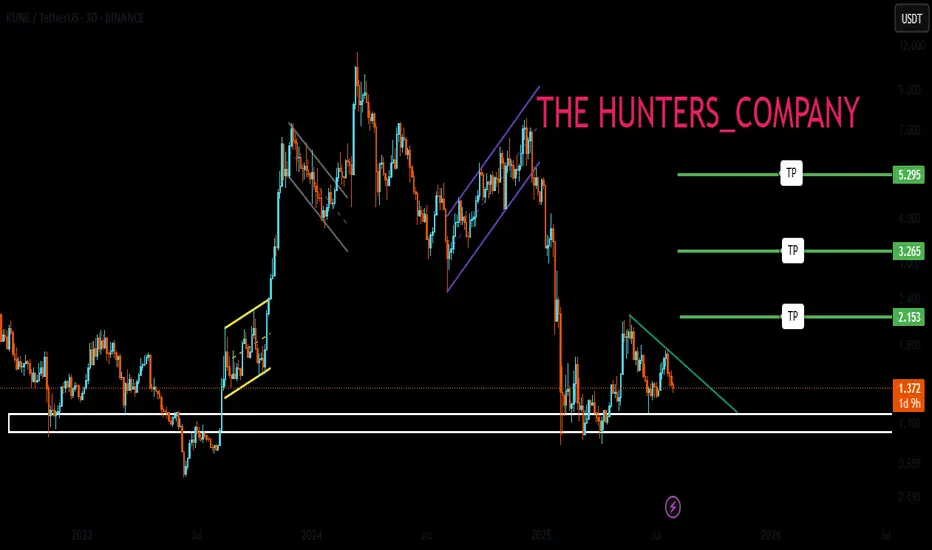
RUNE : Ready to pump?Hello friends🙌
👀According to the price drop, you can see that the price has reached an important area, which, according to the pattern formed, if the specified resistance is broken, we can enter with risk and capital management and move to the specified targets.
🔥Follow us for more signals🔥
*Trade safely with us*
Flag
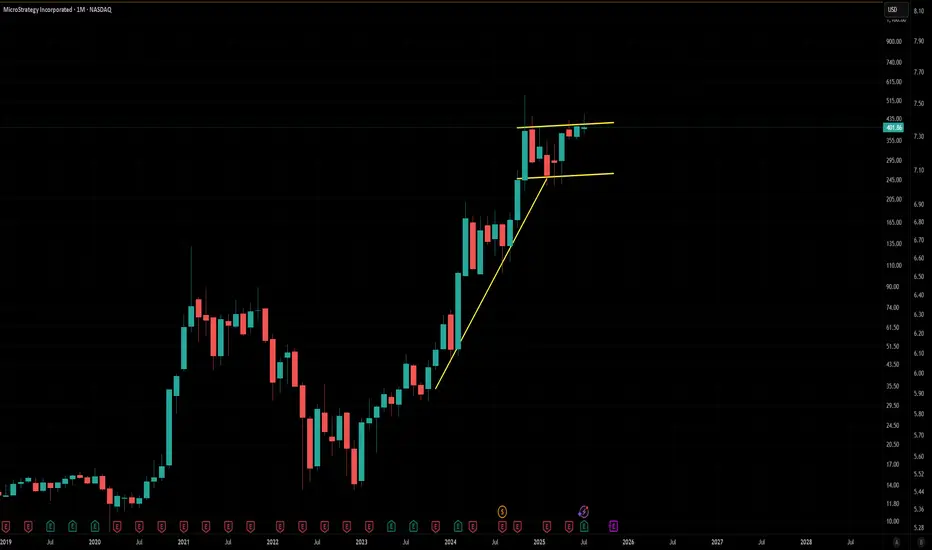
Monthly $MSTR Bullflag MicroStrategy is forming a textbook bull flag on the monthly, right after a massive vertical leg from sub-$200 to over $500.
Strong pole ✅
Tight consolidation near the highs ✅
Monthly closes holding above prior resistance ✅
This thing is coiling under ~$455. Once it breaks, it could easily send toward $800–1000+, especially if CRYPTOCAP:BTC keeps surging. BTC already confirmed a major cup & handle — MSTR just lagging a bit.
High timeframe structure + BTC correlation = explosive potential.
Watching for volume + breakout confirmation. Let’s see if it rips.
XAUUSDXAUUSD breakout falling channle and resistance zone.
Buy above 3295
Stop Loss: 3291
1st TP: 3308
2nd TP: 3313
3rd TP: 3322
4th TP: 3333
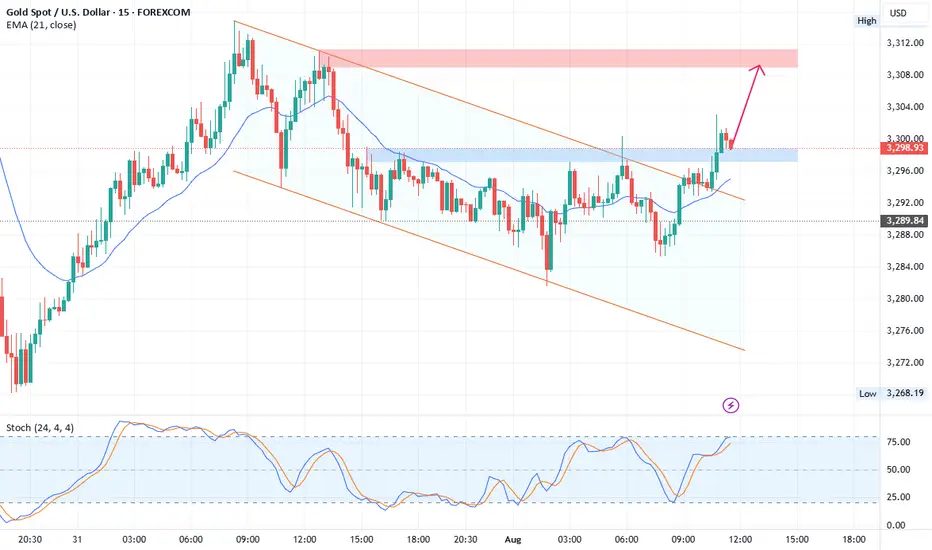
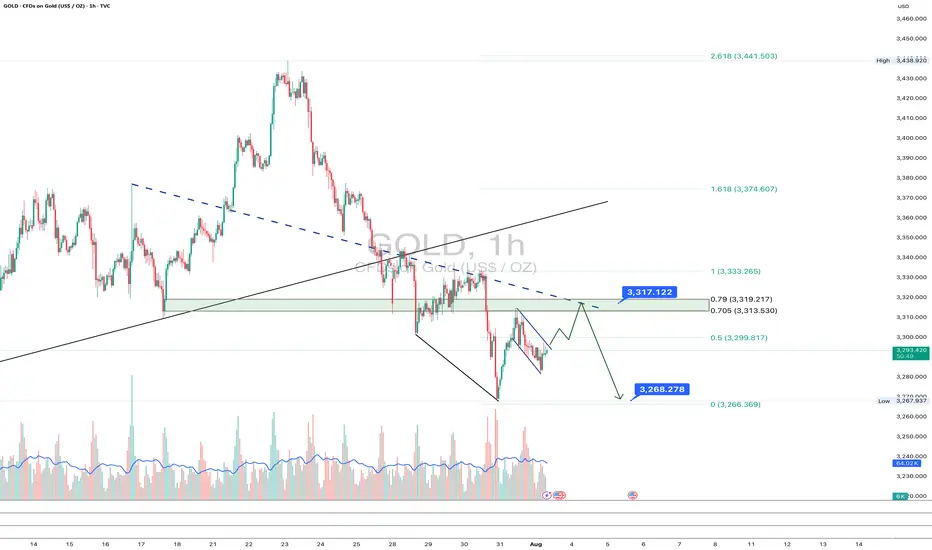
Gold: final pullback or bull trap?On the 1H chart, gold (GOLD) is forming a bullish flag after a sharp decline, which may just be a corrective move within a broader downtrend. The price is now approaching the key resistance zone around $3313–$3317 - this area holds the POC, broken trendline, and the 0.705–0.79 Fibonacci retracement from the last drop. This is the decision-making zone.
If bulls fail to push above it, we expect a move down toward $3268 - the next strong support and potential buy zone, also confirmed by Fibonacci and local demand. Stochastic divergence and slowing volume suggest a possible rebound from that level. However, if the price breaks and holds above $3317, this would indicate a local trend reversal, with targets at $3333 and $3374.
Watch the $3317 zone closely - bulls have yet to prove this is more than just a bounce.
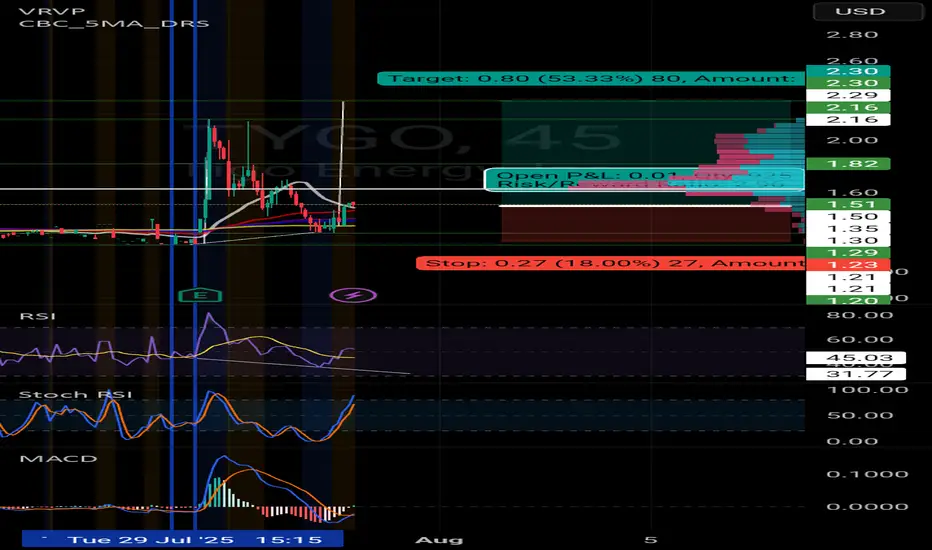
TygoPotential 50% gains coming for Tygo
Falling wedge on this 1hr time frame
I see stochastics, macd, Rsi all in favor .
Let's see if the bullish trend can continue.
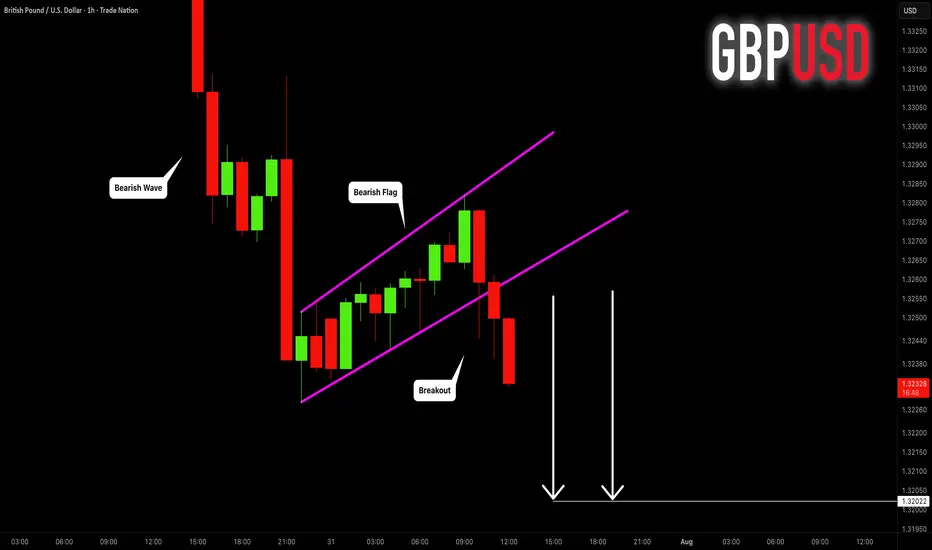
GBPUSD: Strong Trend-Following Pattern 🇬🇧🇺🇸
GBPUSD is going to drop lower.
The market has completed a correctional movement within
a bearish flag.
Its support violation provides a strong bearish confirmation.
I expect a drop to 1.3202 level.
❤️Please, support my work with like, thank you!❤️
I am part of Trade Nation's Influencer program and receive a monthly fee for using their TradingView charts in my analysis.
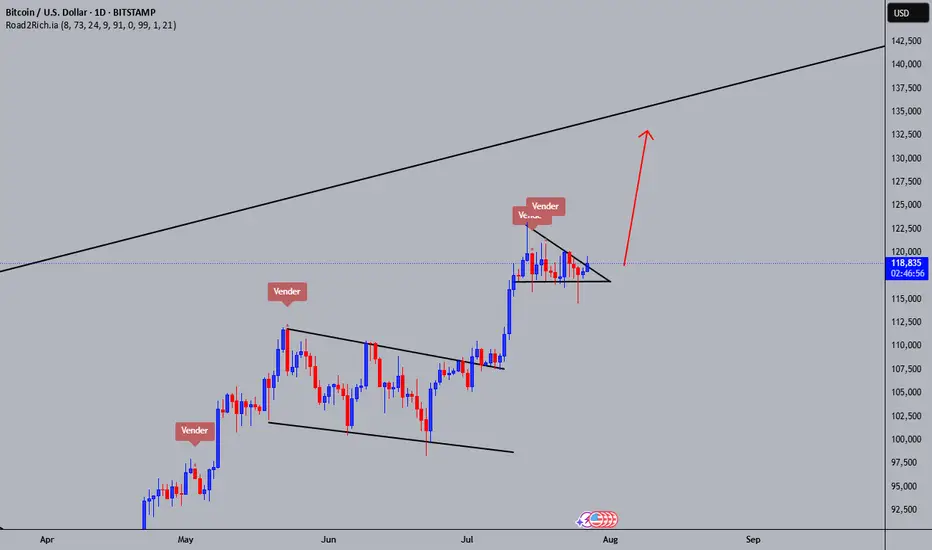
BITCOIN & 134KAfter Bitcoin rallied on July 8 and consolidated for two weeks, this bull flag remains valid, targeting $134,000.

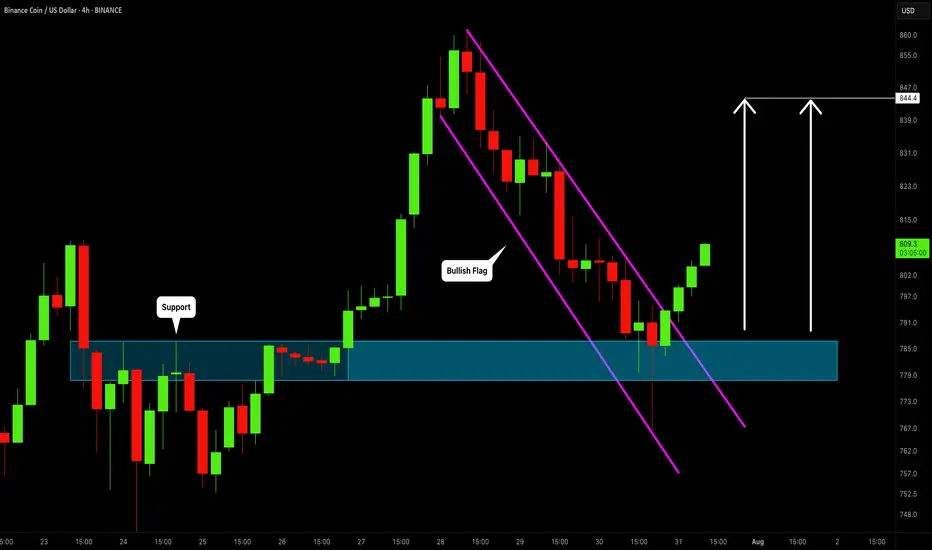
BINANCE COIN (BNBUSD): Bullish Continuation Ahead
BNB is going to resume growth after a retest of a recently broken structure.
A bullish breakout of a resistance line of a bullish flag provides a strong bullish confirmation.
I think that the price will go up to 844 level.
❤️Please, support my work with like, thank you!❤️
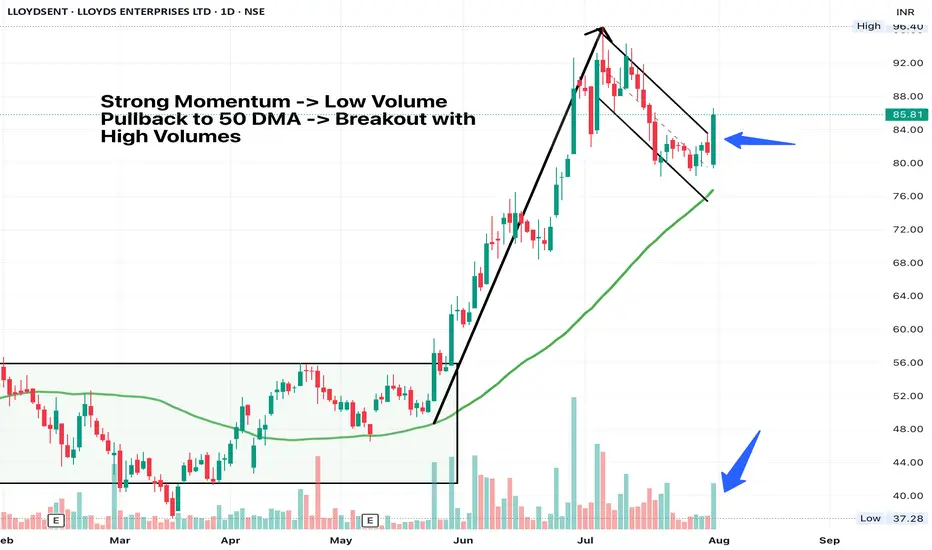
LLOYDSENTMomentum stocks pulling back to 50 DMA are my favourite stocks.
These give you excellent entry opportunities when other's are getting shaken out of their positions
Possible Double bullish flag for #SOLThere is a world where SOL is confirming this double bullish flag setup for New Higher Highs...Let's wait and see. It needs to hold the 179 -178 line and keep and eye on Volume for a healthy push until the next Fibo level around 220.
The only pb is August has always been a bad month for crypto in gnl. Trade carrefully ! Educational content only

Ethereum Tests Key Long Term ResistanceEthereum continues to push higher, but a key resistance zone is causing a pause in the upward movement. Every day brings new positive developments for the crypto market, from ETF to tokenization news. This pattern reflects the typical progression of a crypto bull cycle. The latest SEC decision regarding a crypto-based ETF adds to the bullish backdrop.
However, a rising dollar index and a slowing momentum of U.S. stock market are having a short-term negative impact. Another reason for the current slowdown is the presence of massive resistance. The long-term trendline from the 2021 top, combined with the horizontal 4100 level, has formed a major resistance zone for Ether.
In the short term, ETHUSD may have formed another flag pattern. If it breaks to the upside, a retest of the 4100 resistance is possible. Today, dovishness level of Powell and the number of dissents in the rate-hold decision could significantly influence the price action.

Gold Struggles Near Resistance – Eyes on 3313 for Further DropXAU/USD Slips as Dollar Gains on Trade Deal – Bearish Below Pivot Zone
Gold is under pressure as the U.S. dollar strengthens on optimism around a trade agreement. Risk appetite has returned, weighing on safe-haven demand.
Price failed to hold the pivot zone (3347–3360) and is now slipping below 3327. A 4H close below 3313 will likely trigger further downside.
Until bulls reclaim the pivot, bias stays bearish. Next support sits near 3287 if 3313 breaks clean.
Key Levels:
Resistance: 3388 – 3390 – 3412
Pivot Zone: 3340 – 3347
Support: 3313 – 3263

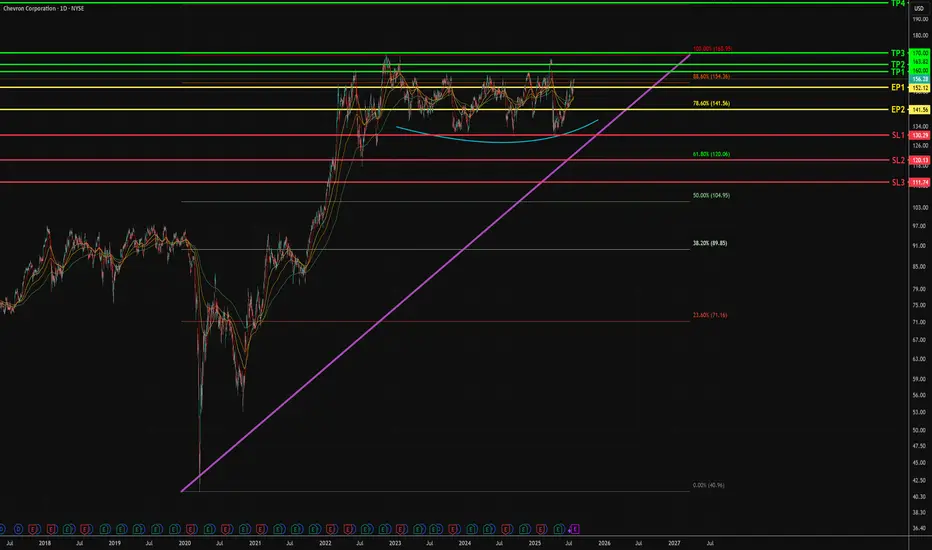
CVX - Potential Swing Upside - Mid TermTimeline - now to 3 months
1. Bullish flag pattern sustained, form during Oct 2021.
2. Rounding bottom above 1D resistance at $130
- Last close is above Fib 88.6% - $154.36
- In the 2 days, weak selling pressure is noticed.
3. More attempts to break 88.6% Fib level opposed to $130 support line
- Bullish angle upthrust stays above 45 degrees
- Concludes high change of breaking 88.6% fib level, towards previous high of $169.66
3. Entry points
EP 1 - buy spot with 1 or 0.5 size
EP 2 - Enter another 1 or 0.5 size if closing prices stay above Fib 78.6% at $141.56
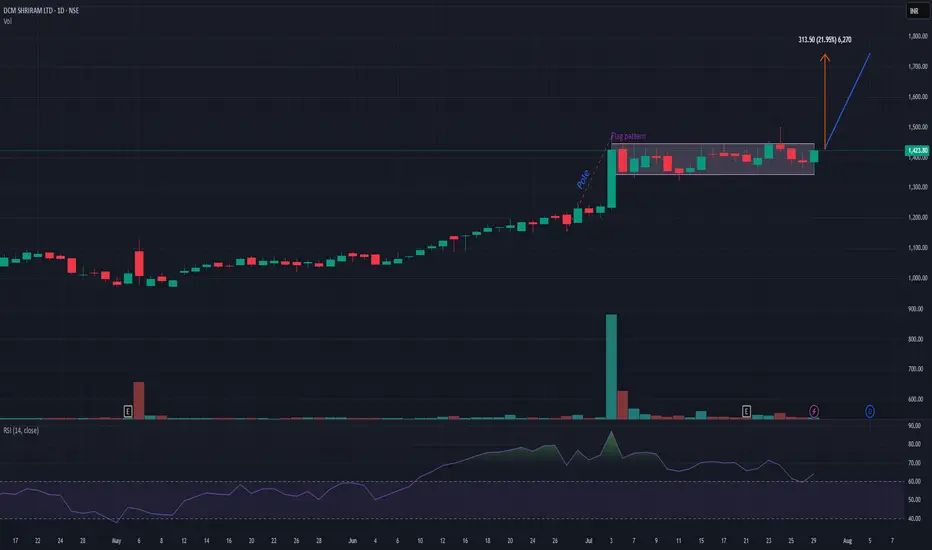
DCMSHRIRAMDCMSHRIRAM is on verge of flag pattern breakout provided that it closes above 1440 level. It has a potential to add up to 20-22% from this level. My view may change if it closes below 1350. Risk-reward is quite in favor. Keep it on radar.
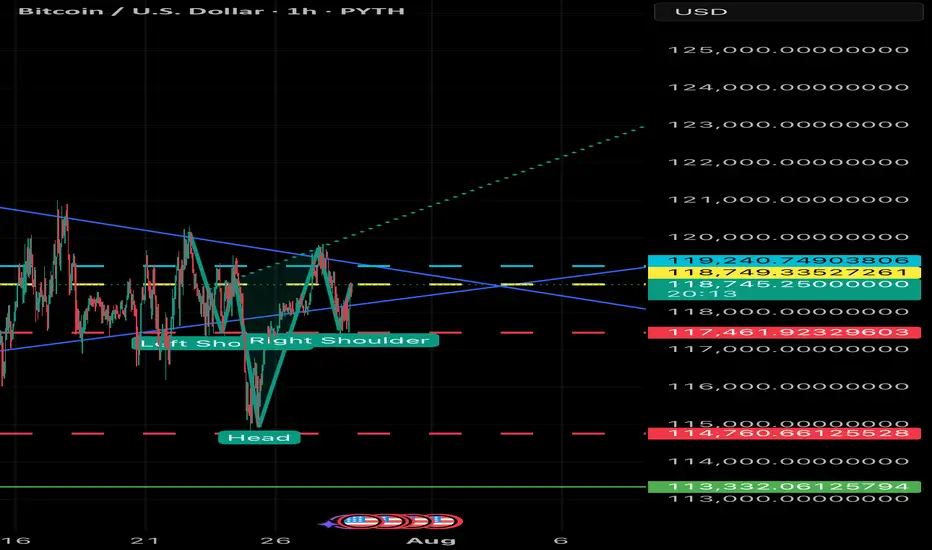
BULLISH - BTC Breakout Imminent The breakout confirmation in the context of the inverse head and shoulders pattern depicted in the provided chart refers to the validation of a bullish reversal signal, indicating a potential shift from a downtrend to an uptrend. This confirmation is typically established through specific technical criteria, which I will outline below in a structured manner. Given the updated current price of 118,580, I will also assess its implications based on the chart’s features.
Key Elements of Breakout Confirmation
1. Break Above the Neckline: The neckline, represented by the dotted teal line in the chart, serves as the primary resistance level. It connects the highs following the left shoulder and head formations, sloping slightly downward. From the visual analysis, the neckline appears to range approximately from 119,000–120,000 on the left to 117,000–118,000 near the right shoulder. A decisive breakout occurs when the price closes above this line, invalidating the prior downtrend. In the chart, the price has already surpassed this threshold, reaching 118,318.57 at the time stamp of 23:23.
2. Volume Support: Confirmation is strengthened by an increase in trading volume during the breakout candle or session. This suggests conviction among buyers and reduces the likelihood of a false breakout. The provided chart does not display volume data, so external verification (e.g., via exchange metrics) would be necessary for full assessment. Absent this, price action alone provides preliminary evidence.
3. Price Closure and Sustained Momentum: A single intraday breach may not suffice; confirmation often requires a session close (e.g., daily or hourly, depending on the timeframe) above the neckline, ideally with follow-through in subsequent periods. Additional supportive factors include:
• No immediate retest or pullback below the neckline, which could signal a trap.
• Alignment with momentum indicators, such as the Relative Strength Index (RSI) moving above 50 or a bullish moving average crossover (not visible in the chart).
4. Pattern Target Projection: Upon confirmation, the upside target is calculated by measuring the vertical distance from the head’s low (approximately 114,000) to the neckline at the breakout point (around 118,000), yielding a height of about 4,000 units. Adding this to the breakout level suggests potential targets near 122,000 or higher, though market conditions may alter outcomes.
Assessment at Current Price of 118,580
At 118,580, the price remains above the estimated neckline breakout point (approximately 118,000 at the right shoulder), extending the upward trajectory shown in the chart. This positioning supports preliminary confirmation of the breakout, as it demonstrates sustained momentum beyond the resistance. However, for robust validation:
• Monitor for a close above this level on the relevant timeframe.
• Watch for any retracement; a successful retest of the neckline as support would further solidify the pattern.
• Consider broader market factors, such as macroeconomic influences or sentiment in the asset class (likely cryptocurrency, given the price scale), which could impact durability.
If additional data, such as volume or updated charts, is available, it would refine this analysis. Should you require further details or evaluation of related indicators, please provide specifics.
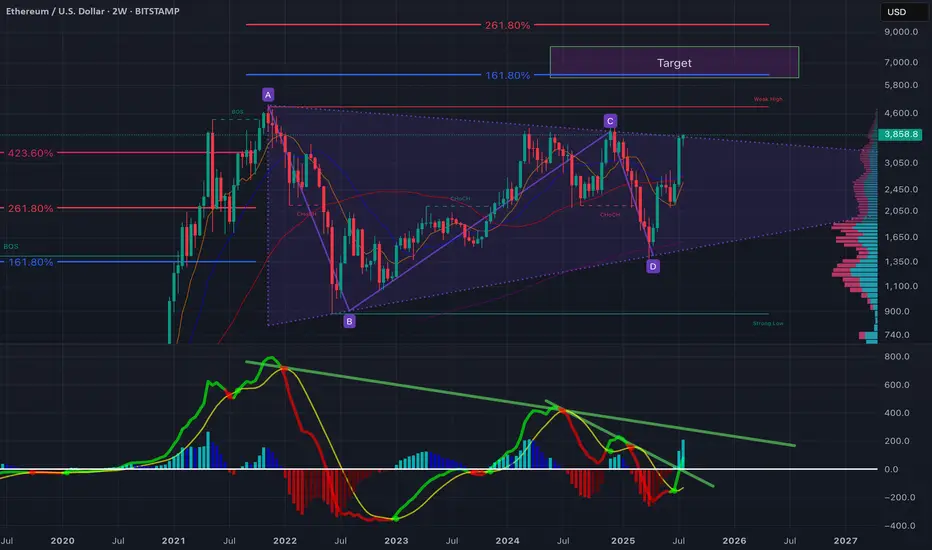
$ETH - Nothing has changedEthereum is showing a significant breakout setup after years of consolidation within a large symmetrical wedge structure (A–B–C–D pattern). The price has just tested the upper boundary of the wedge, and momentum indicators suggest a potential mid-term bullish continuation.
Key Observations:
ABCD Harmonic Structure: Price has respected the harmonic range with D forming a strong higher low near $1,500–$1,600, showing buyer absorption at key demand levels.
Fibonacci Confluence:
The 161.8% extension aligns with ~$5,800, forming the first major target.
A 261.8% extension pushes towards ~$7,000, aligning with the marked "Target" zone.
Volume Profile: Heavy accumulation between $1,500–$2,500 with low resistance above $4,000 suggests a breakout could accelerate quickly.
MACD/RSI Divergence: The momentum oscillator shows a triple bullish divergence (higher lows on momentum vs. lower lows on price), and the downtrend line on the MACD histogram has been broken—often a precursor to sustained upside.
Moving Averages: The 50/100 EMA crossover on the 2-week chart is imminent, historically a strong macro signal.
Bullish Scenario:
A clear close above $4,000 confirms wedge breakout.
Short-term targets: $4,600 (weak high) and $5,800 (Fib 161.8%).
Macro target: $7,000+ if bullish momentum holds through Q4.
Bearish Risk:
Failure to hold $3,500 could lead to retests of $2,500 or even $2,000 (mid-wedge support).
Watch for macroeconomic shocks (rate cuts, liquidity shifts) which have previously caused retracements in crypto markets.
What’s next?
ETH is approaching a make-or-break moment. If the breakout holds, this could be the start of the next major leg up. A strong weekly close above $4,000–$4,200 is critical for validation.
BITCOIN UP!!Look really good if someone of you guys know about chart pattern.
Take a look in this chart.
Looking for some goods position this year. Chart Pattern ( Descending triangle ) looking for breakout. Im my opinion, you dont need a breakout here.
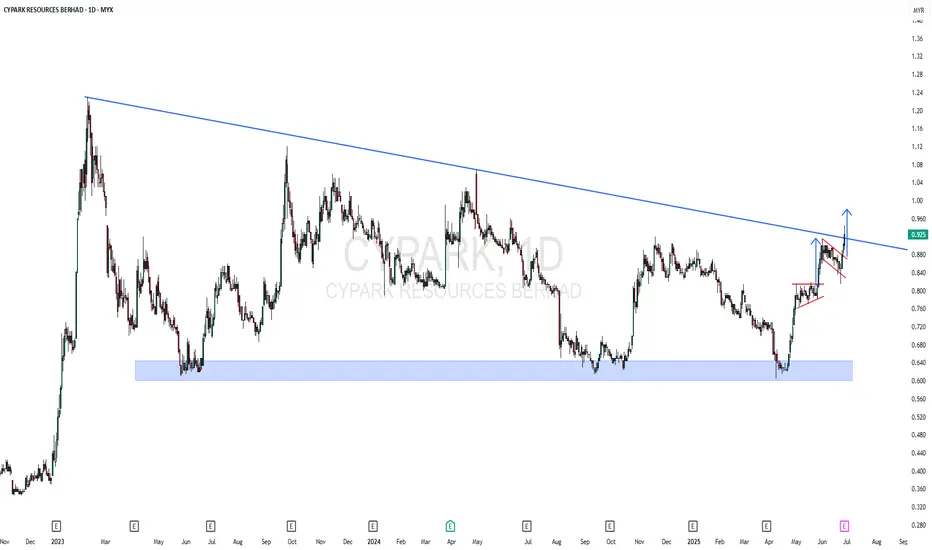
CYPARK - 52 WEEK HIGH CYPARK - CURRENT PRICE : RM0.925
CYPARK made a NEW 52 WEEK HIGH on 26 JUNE 2025. It also breakout a significant down trendline - indicating strong bullish momentum. Nearest target will be the measurement of flag pattern price target which is RM0.980. Then if it continues to rise, RM1.02 will be second target. Stop loss level is RM0.850.
ENTRY PRICE : RM0.920 - RM0.930
TARGET : RM0.980 and RM1.02
STOP LOSS : RM0.850
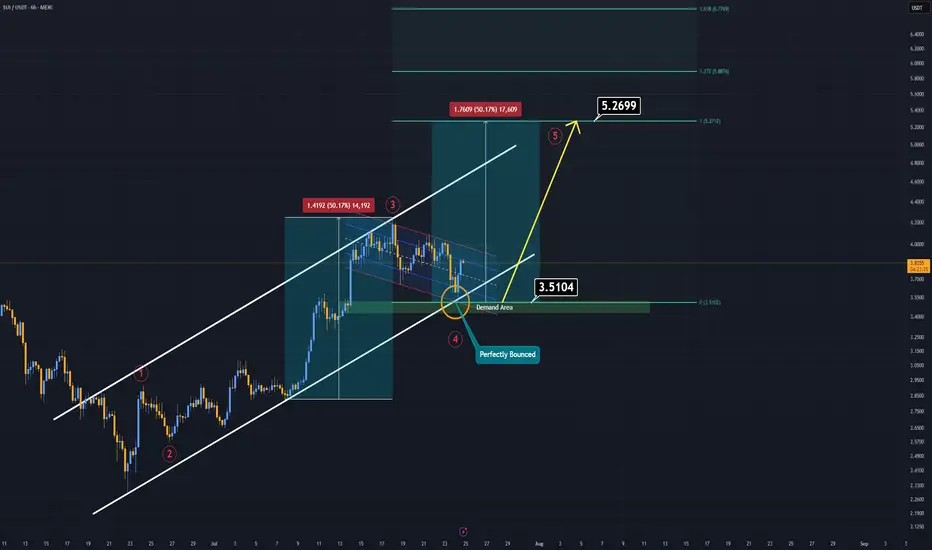
SUI Analysis (6H)If you're on the hunt for extreme risks and potentially high rewards — SUI might be calling your name.
Currently, SUI is trending within a well-respected ascending channel, and just today, it tapped both the demand zone and the lower boundary of this channel.
That’s what we call a double support, and it often signals a strong potential bounce.
SUI now appears to be forming a bullish flag pattern. If this formation breaks to the upside, it could trigger the fifth impulsive wave in line with Elliott Wave Theory.
In such a case, the main target is projected around $5.00–$5.20.
Extreme setups demand extreme conviction.
Good luck.
Spot Ether ETFs Log $453M in Inflows, Extend Streak to 16 DaysThe momentum behind Ethereum continues to build as spot Ether exchange-traded funds (ETFs) in the United States and abroad recorded another impressive influx of capital, attracting $453 million in net inflows over the past week. This marks the 16th consecutive day of inflows, underscoring a growing institutional appetite for the second-largest cryptocurrency by market capitalization.
While Bitcoin has long dominated the digital asset ETF landscape, Ether is increasingly capturing the attention of sophisticated investors. Analysts attribute the sustained interest to a combination of macroeconomic factors, evolving regulatory clarity, and Ethereum’s unique position within the decentralized finance (DeFi) ecosystem.
Institutional Endorsement Grows
Several major asset managers, including BlackRock and Fidelity, have reported increased client demand for Ether exposure in recent months. According to data compiled by Bloomberg, the $453 million inflow in Ether ETFs this week is the largest since the products launched, bringing total assets under management (AUM) across major Ether funds to $3.2 billion.
“These consistent inflows are a clear sign that Ether is becoming institutional-grade,” said Mira Taylor, head of digital asset research at Keystone Capital. “It reflects a shift in how the market perceives Ethereum—not just as a tech platform, but as a core financial infrastructure.”
This shift comes amid Ethereum’s continued progress toward scalability, including its transition to proof-of-stake (PoS) and the implementation of Layer-2 scaling solutions such as Optimism and Arbitrum. These upgrades improve network efficiency and reduce gas fees, making Ethereum more attractive for enterprise-level use cases.
Regulatory Developments Provide Tailwind
The surge in investor confidence is also linked to increasing regulatory clarity. The SEC’s tacit approval of spot Ether ETFs in key jurisdictions, including the United States and Europe, has provided the legitimacy many institutions required before allocating capital.
Moreover, Ethereum’s perceived decentralization and utility have helped it avoid the same level of scrutiny that other altcoins have faced. While Ripple’s XRP and Solana remain entangled in legal ambiguities, Ethereum benefits from its early position as a non-security in the eyes of regulators.
Market Outlook
Despite recent volatility in the broader crypto markets, Ethereum has shown resilience. ETH is currently trading around $3,550, up nearly 12% month-over-month. Analysts suggest the inflows into spot Ether ETFs could act as a support mechanism for price, dampening downside volatility.
“ETF inflows often act as a price stabilizer, particularly in a risk-on environment,” said Noah Wexler, macro strategist at Apollo Digital. “If inflows persist, Ethereum could revisit the $4,000 level by Q4.”
Investors and analysts alike will be watching closely to see whether the inflow streak continues into a 17th day. Regardless of short-term price action, the structural trend appears clear: Ethereum is solidifying its role as an investable, institutional-grade asset.

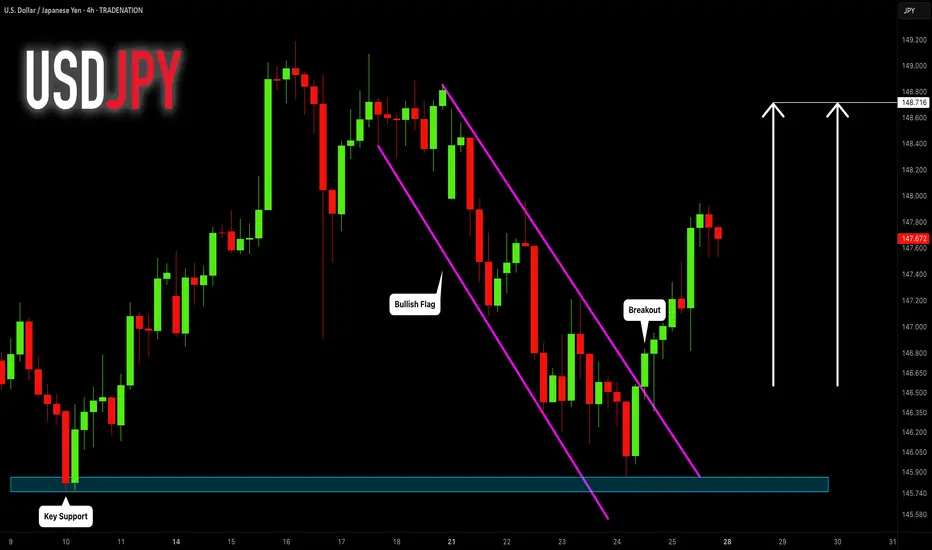
USDJPY: Bullish Move From Support Ahead! 🇺🇸🇯🇵
I think that there is a high chance that USDJPY will continue growing
next week.
A bullish breakout of a resistance line of a flag pattern that occurred
after a test of a key support provides a strong bullish signal.
Goal - 148.7
❤️Please, support my work with like, thank you!❤️
I am part of Trade Nation's Influencer program and receive a monthly fee for using their TradingView charts in my analysis.
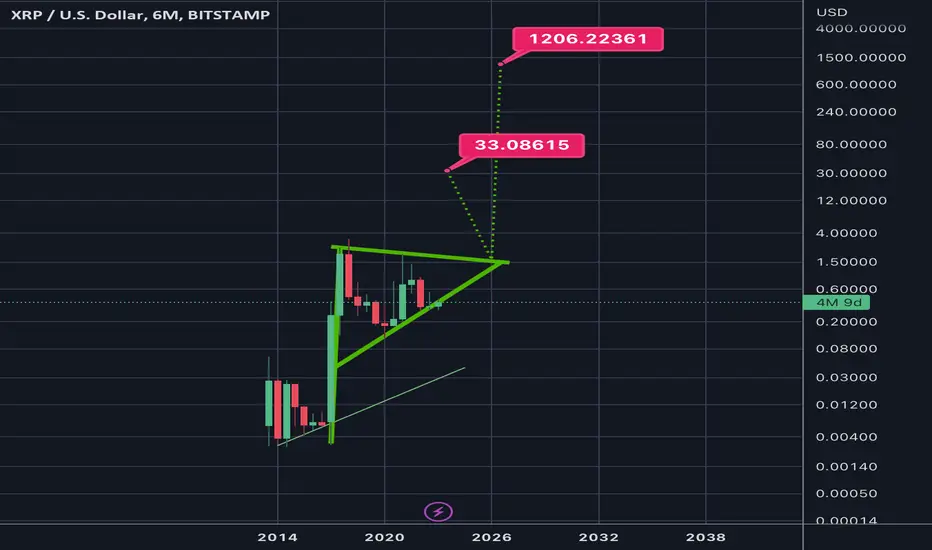
6month log chart on xrpusd suggests crazy potential targetsThe bull pennant we are in shown here on the 6month time frame seems to have a symmetrical triangle for its flag. The breakout target for just the symmetrical triangle is in the $33 range. Factor in the pole of the flag and the potential target skyrockets to 1.2k. Definitely not financial advice and certainly no guarantee it will hit either target as it’s still up in the air if log chart targets reach their full target as reliably as linear chart patterns do. Even if it does hit these targets you can see the apex of the pennant in its current trendline trajectories doesn’t occur until 2026. The only way I see price remaining inside this triangle for that long is indeed if the SEC ripple case is extended through appeal and taken to the Supreme Court. Hopefully not but it isnt impossible. If this were to occur I would simply keep dollar cost average accumulating until it was to break out from the triangle which would give me more opportunity to take some profit at the first target but then also hold onto some of the asset in case it does indeed reach the full bullflag breakout somehow all the way up at 1.2k. Simply posting this hear so I can see how well price action chooses to follow this pattern over the next year or few. Once again *not financial advice*