Link Analysis (12H)Chainlink (LINK) Technical Outlook – Elliott Wave Perspective
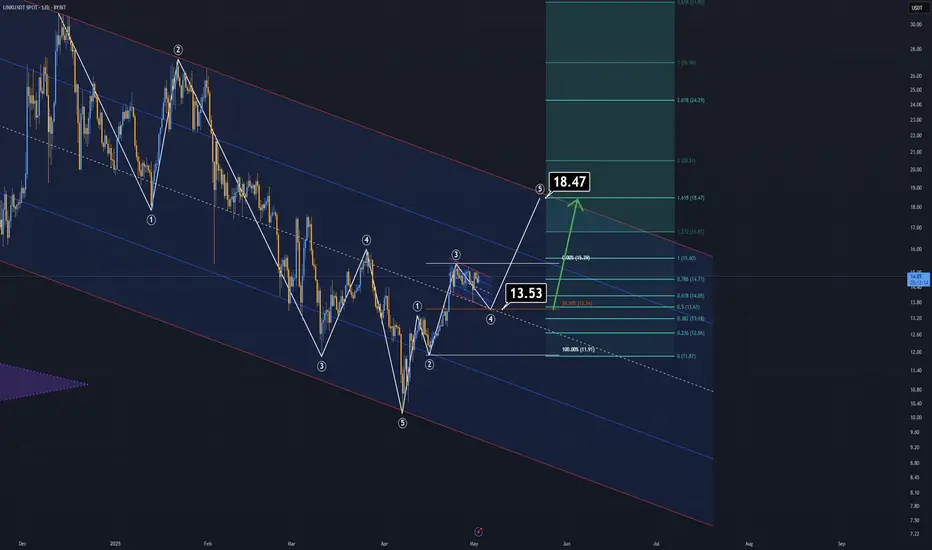
After applying Elliott Wave Theory, the chart appears to speak for itself — the downward corrective phase seems to have concluded.
Zooming into lower timeframes, there are several bullish signs suggesting that LINK is primed for an upward move.
Key Technical Reasons Supporting Upside Potential:
Bullish Flag Formation: A clear flag pattern has formed in lower time frames, and LINK is currently testing its resistance level.
Elliott Wave Count: Based on wave structure, Wave 3 appears to be nearing completion. Should we see a short-term pullback, it would likely be Wave 4, offering a strong buy opportunity around the support zone of the flag.
Fib Confluence: The potential retracement aligns perfectly with the 50% Fibonacci level — a typical target area for Wave 4 corrections.
Two Possible Scenarios:
Immediate Breakout: With support from Bitcoin’s continued momentum, LINK could extend its current Wave 3 and break out from the flag without any significant pullback.
Healthy Correction: Alternatively, LINK could retrace to the 50% Fib level before initiating the final leg of Wave 5 — providing a textbook buying opportunity.
Target:
In both scenarios, the upside target remains the same: $18.00 to $18.40 range.
— Thanks for reading.
Flag
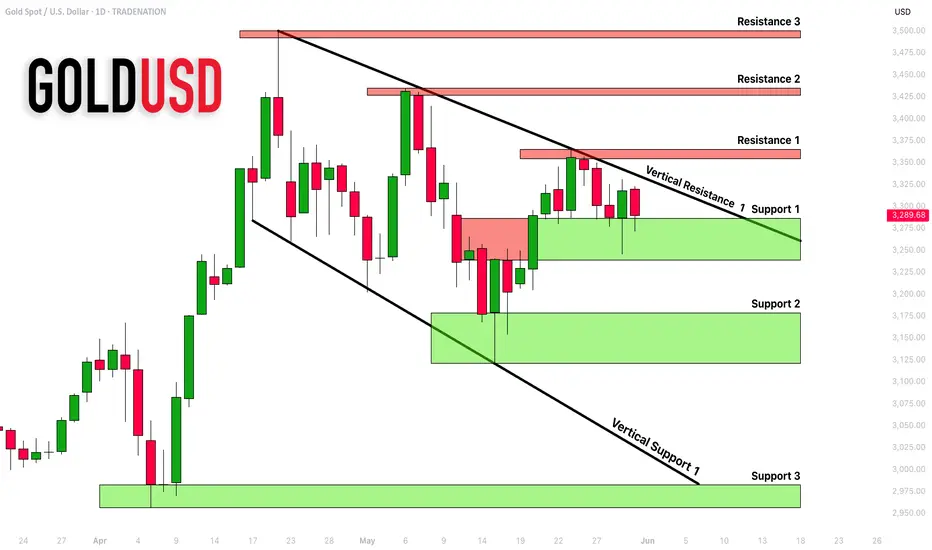
GOLD (XAUUSD): Support : Resistance Analysis For Next Week
Here is my latest structure analysis and
important supports & resistances for Gold for next week.
Horizontal Structures
Support 1: 3238 - 3286 area
Support 2: 3122 - 3179 area
Support 3: 2957 - 2982 area
Resistance 1: 3353 - 3366 area
Resistance 2: 3427 - 3425 area
Resistance 3: 3483 - 3501 area
Vertical Structures
Vertical Support 1: falling trend line
Vertical Resistance 1: falling trend line
Consider these structures for pullback/breakout trading.
❤️Please, support my work with like, thank you!❤️
I am part of Trade Nation's Influencer program and receive a monthly fee for using their TradingView charts in my analysis.
POSSIBLE BREAKOUT ON GOLDGold is making what looks like a large bull flag. Could see it retrace a little bit further before it finally breaks out to new highs

INTEL INTC Short setup target 15.29Fibonacci technical analysis : Intel Corporation NASDAQ:INTC has already found resistance at the Fib level 61.8% (23.07) of my Down Fib. The May 30th Daily candle has closed below retracement Fib level 23.6% (19.73), confirming a sell signal. A Bear Flag pattern has also formed. My Down Fib guides me to look for NASDAQ:INTC to eventually go down to hit first target at Fib level -27.2% (15.29).
NASDAQ:INTC – Target 1 at -27.2% (15.29), Target 2 at -61.8% (12.26) and Target 3 at -78.6 (10.79)
Stop loss slightly above the 50.0% retracement Fib level (22.04).
Enjoy the trading process and take time to smell the roses🌹

GOLD (XAUUSD): Detailed Daily Time Frame Analysis
Gold is officially in correction now.
Analysing a price action on a daily time frame,
we can see a valid bullish flag pattern.
A minor trend that we see within the boundaries of the flag
reflects a global overbought state of the market.
The upper boundary of the flag is a strong vertical resistance
that concentrates a selling interest.
An accurate signal of a resumption of a bullish trend will be
a breakout and a candle close above that.
A bullish wave will be expected at least to 3420 then.
Remember that we can not predict how long the market will
keep trading within the flag. Also, the market may easily
drop lower within that, updating the low.
If a correction continues below the low of a flag pole,
that may signify a global bearish reversal.
Of course, from a current geopolitical and economic perspective
it is a low-probability scenario.
❤️Please, support my work with like, thank you!❤️

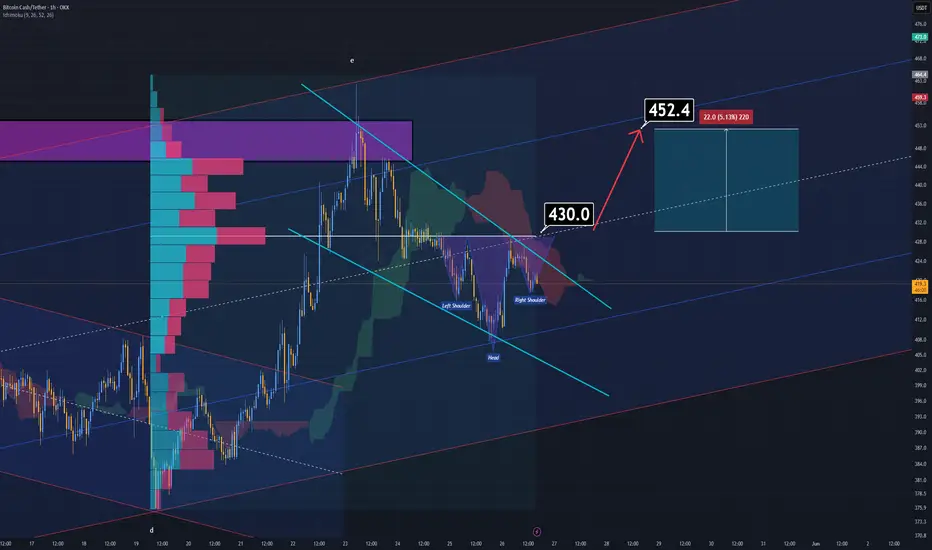
BCH Analysis for Scalpers (1H)Bitcoin Cash (BCH) is currently showing multiple technical signals that support a potential bullish continuation.
A reversed Head and Shoulders pattern is in the process of forming, and it aligns well with several key confluences — including the Ichimoku Cloud and volume profile support zones.
A breakout above the $430 level would not only confirm the pattern but also activate a bullish flag formation, adding further momentum to the setup. In that case, the next immediate target would be around $452.4.
This setup remains valid only upon confirmation of the breakout. Until then, caution is advised — a clean break and retest would offer the most favorable entry.
— Thanks for reading.
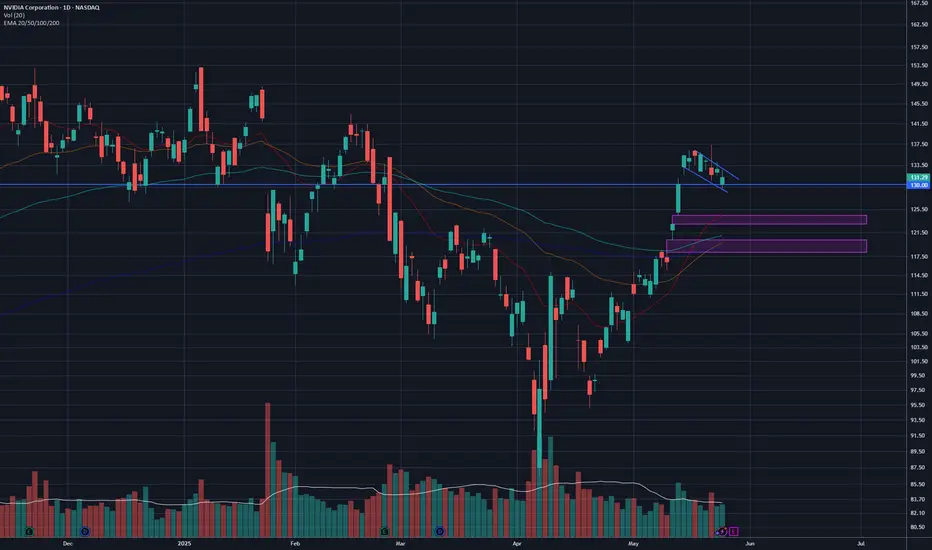
NVDA: Ascending triangle break, bull flag on S/R retestHey traders! I'm back and once again, I've spent almost the whole evening (lol) trying to figure out the odd, strange price action we've seen from NASDAQ:NVDA over the past few weeks, and especially today!
As we all know (I assume), Nvidia failed to disappoint on earnings once again, and we saw a HUGE gap up overnight, as far as up to the $143 mark. However, we soon began to see a dip. That's fair, as traders will likely sell and take profit.
However, the dip became a larger dip, and Nvidia finished the day basically at 3.2%. But it seems that the pullback may been pretty healthy.
Because as you can see from the chart, Nvidia has been forming an ascending triangle ever since the 14th May. That was after the sweet run it had prior to that. It has tested the £136-137 area as a major resistance line ever since until finally, a strong earnings report sent Nvidia above the line.
After the gap up, throughout the day, the stock went into a controlled, composed downward channel which what we like to call, a bull flag. This is taking into consideration market hours, not extended hours. This bull flag is bullish in its own way, but it is also a sign of a retest of the $136-137 resistance zone. This is officially a support zone now.
A successful retest from this support zone will cause a bounce, especially from the support trendline, and likely send the stock towards $140+, possibly extending its reach to $150 if broader market strength (Nasdaq) continues.
On the contrary, a dip below the support line and a crash below the red support trendline, would likely send the stock lower to $133 as next support.
As long as Nvidia maintains $136-137, the bulls are in control.
Note: Not financial advice. Please do your DD.

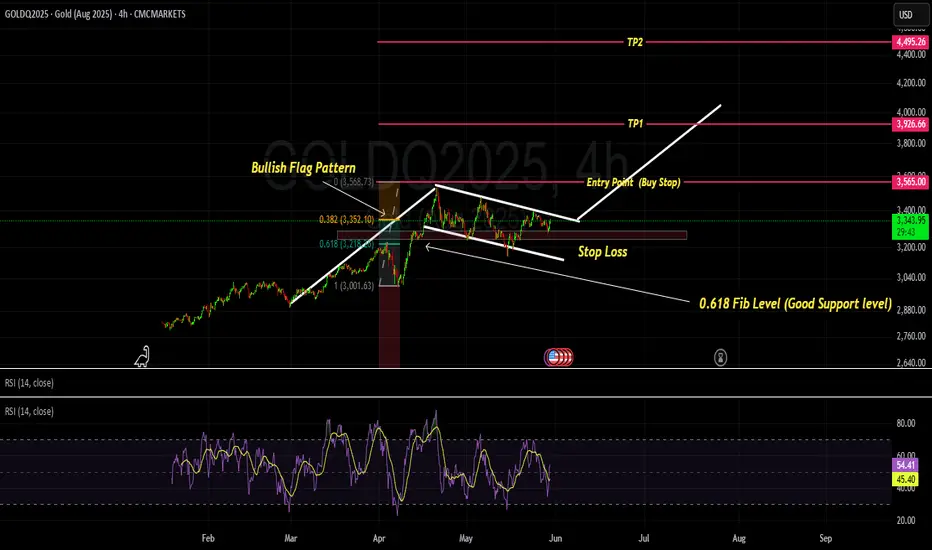
GOLD- BULL SIGN - BUY CALL - Bullish Flag patternMarket is making a Bullish Flag Pattern and it seems when breaksout with a Buy Stop order, it will move to its projected TPs
TATVA : Chart Pattern Breakout (Swing Pick)#TATVA #chartpatternbreakout #breakoutstock #flagbreakout
TATVA : Swing Trade
>> Chart Pattern Breakout
>> Flag & Pole Breakout Visible
>> Trending stock
>> Good Strength in stock
>> Volumes Driedup, Expansion imminent
>> Good Upside Potential
Swing Traders can lock profit at 10% and keep trailing
Disc : Stock charts shared are for Learning purpose and not a Trade recommendation.
Do your own analysis or Consult a SEBI Registered Advisior for taking positions

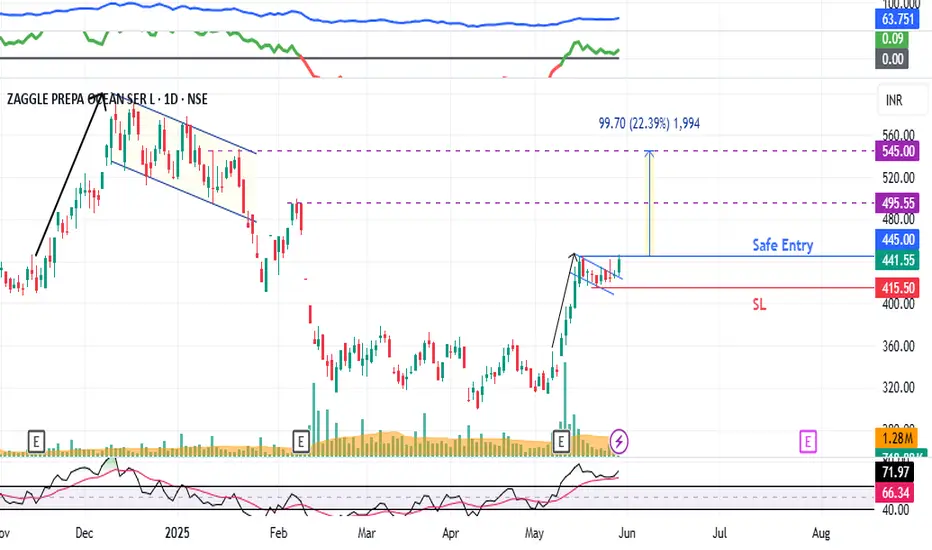
ZAGGLE : Chart Pattern Breakout ( Swing Pick )#ZAGGLE #breakoutstock #flagbreakout #chartpatternbreakout #flagandpole
ZAGGLE : Swing Trade
>> Chart pattern Breakout
>> Flag and pole breakout visible
>> Trending stock
>> Low Risk , High Reward Trade
>> Good Strength & Decent Volumes Building up
Swing Traders can Lock Profit at 10% and keep trailing
Disclaimer : Stock Charts shared are for Learning Purpose and not a Trade Recommendation. Do your Own Analysis or Consult ur Financial advisor or a SEBI Registered Advisor
NZDAUD 1 Daily Chart Bearish Flag Continuation PatternNZDAUD 1 Daily Chart Bearish Flag Continuation Pattern
Stop Loss: 0.92786
Sell Stop Entry: 0.91441
TP1 0.90045
TP2: 0.89040
No Divergence

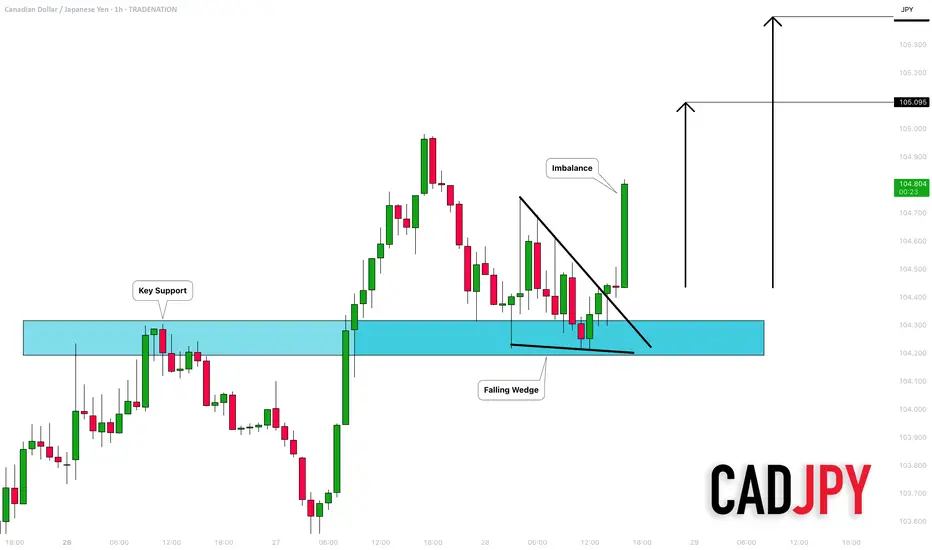
CADJPY: Bullish Continuation Confirmed 🇨🇦🇯🇵
Look how strongly CADJPY reacted to a recently broken
resistance that turned into a support after a breakout.
A bullish violation of a resistance line of a falling wedge on an hourly time frame
with a bullish imbalance confirms a highly probable growth.
The price will go up at least to 105.09
❤️Please, support my work with like, thank you!❤️
I am part of Trade Nation's Influencer program and receive a monthly fee for using their TradingView charts in my analysis.
Gold Daily Bullish Flag Continuation PatternGold Daily Bullish Flag Continuation Pattern
The price is likely to Continue

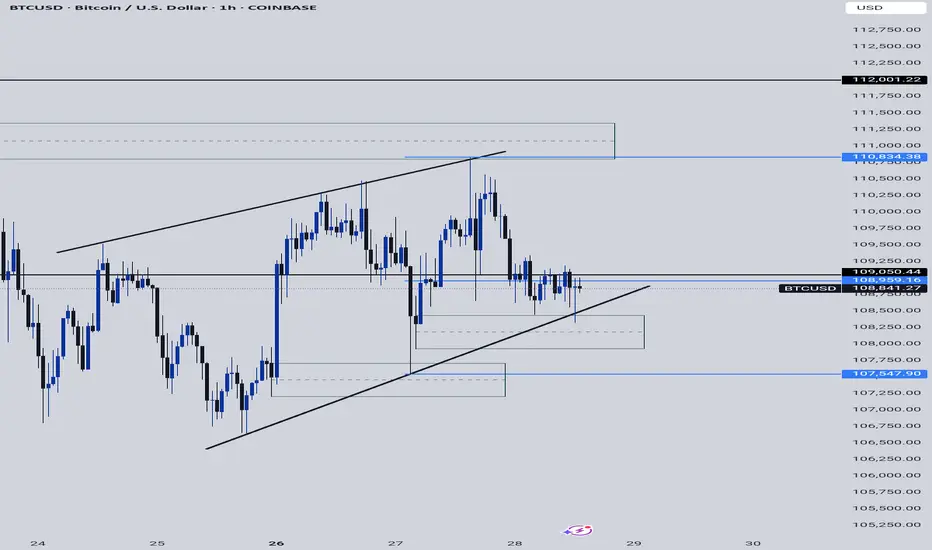
BTCUSD Bearish?We currently seeing the market accumulate orders, some good structure broken to the downside, do we continue bearish or we continue bullish as the major trend on btcusd?
What's your thought?
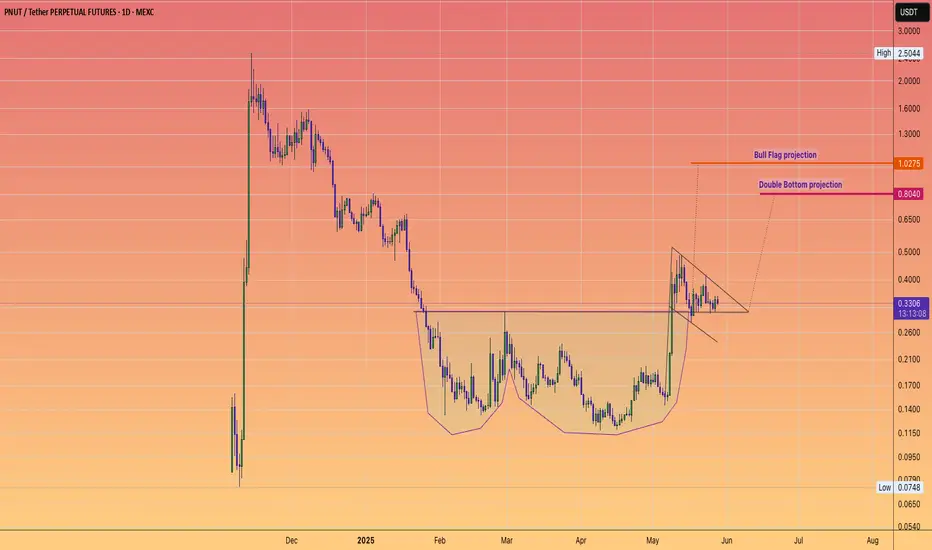
PNUT projects to a Dollar.TWO Clear patterns
Double bottom
and a Bull Flag.
Two respective Log Projections for you to consider.
This suggest strong Solana performance is incoming and another round of #Memecoin frenzy.
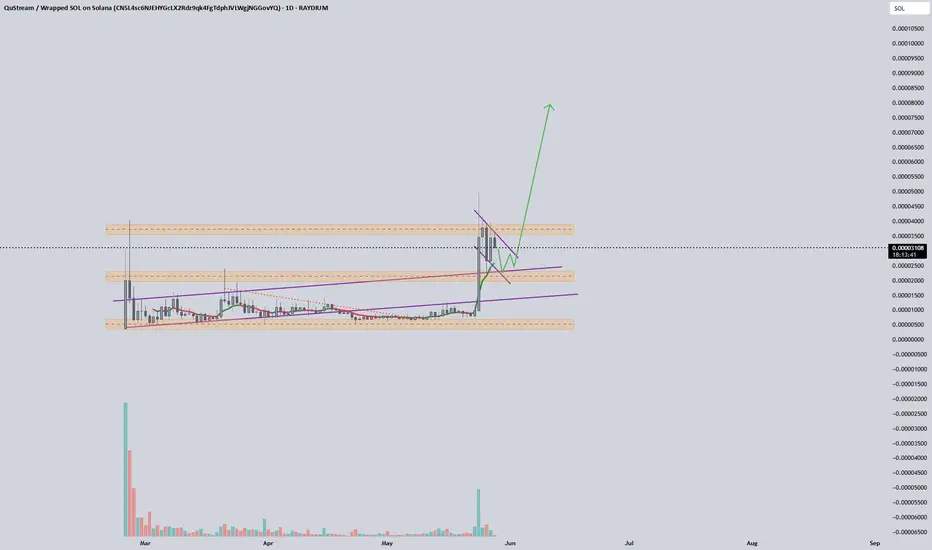
$QST Bullish flag QST QuStream shows strong bullish momentum on crypto market. It s based on Quantum Encryption narattive. Next month will be the testnet and will migrate to 1:1 own token on their network. Keep the eyes on it ...
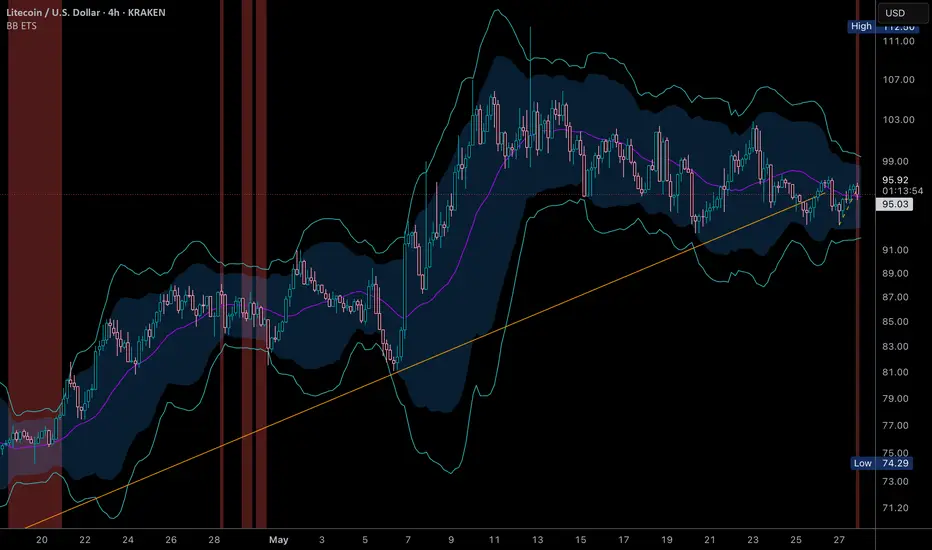
LTC 4h LTC 4h chart ETS BBands are staring to get tight, if price starts from the low + plus the D chart bull flag, this will be a long.
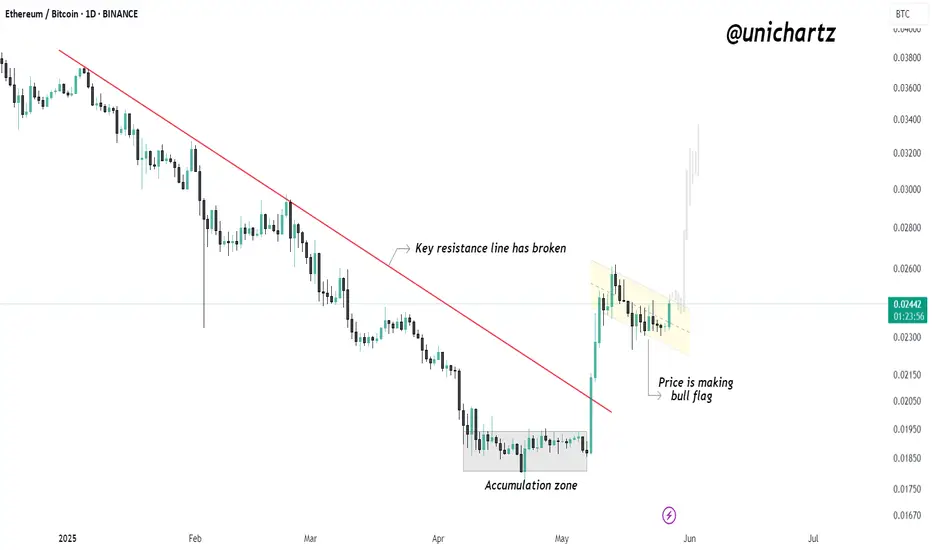
Bull Flag Forming on ETH/BTC – Altcoins About to Explode?$ETH/BTC just broke a key resistance line and is now forming a bullish flag — this is big for altcoins.
Why? Because when ETH starts gaining strength against BTC, it often signals the beginning of an altcoin rotation. Ethereum usually leads the pack — and when its BTC pair is bullish, altcoins tend to follow with strong momentum.
The breakout followed by a bull flag consolidation suggests continuation is likely. If ETH/BTC pushes higher from here, we could see capital flow from Bitcoin into altcoins, igniting the next leg of altseason.
Altcoins may be gearing up — stay sharp.
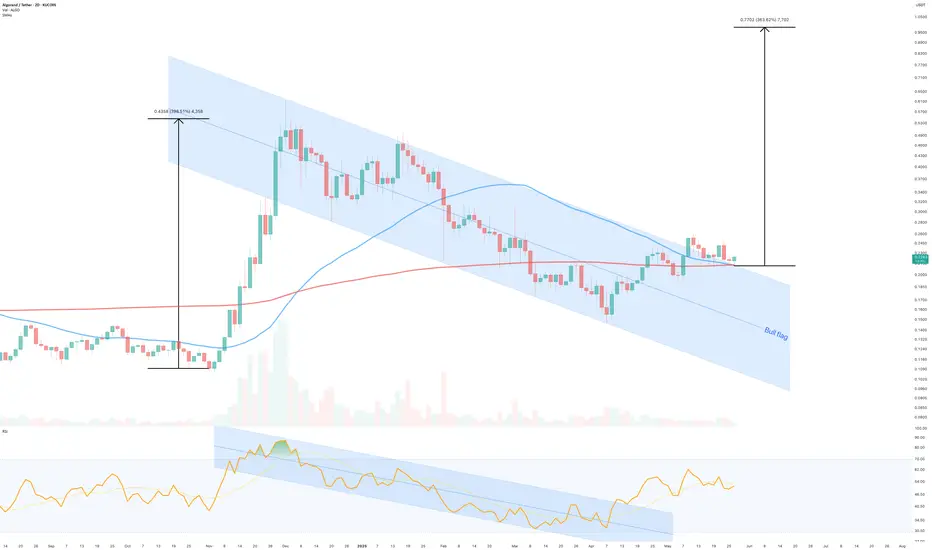
Algorand to $1Pattern Overview
A textbook bull flag formation has materialised and appears to be have confirmed support on past resistance. The pattern shows the classic characteristics of a strong impulse move followed by a controlled consolidation phase.
Key Technical Elements
Flag Formation Structure:
Initial strong bullish impulse creating the "flagpole"
Orderly consolidation within a defined channel (the "flag")
Decreasing volume during consolidation phase
Recent breakout above flag resistance with volume confirmation
Moving Average Support: Price action has found support at both the 50-day (blue line) and 200-day (red line) moving averages.
Recent price action bouncing cleanly off these dynamic support levels
RSI Confirmation: RSI showing healthy momentum without being overbought
The oscillator pattern mirrors the flag consolidation, suggesting controlled profit-taking rather than distribution
Technical Outlook
Bull flags are typically measured by adding the height of the flagpole to the breakout point. . The next impulsive wave forecasts price action to $1
Risk Management
While the technical setup appears strong, proper risk management remains essential. A break back into the flag structure, especially below the moving average support zone, would warrant reassessment of the bullish thesis.
Ww
___________________________________________________________________________________
This analysis is for educational purposes and represents technical observations based on price action and indicators shown on the 2-day timeframe.
TSLA: Break-out above bull flag, possible cup and handle?So, a few days ago, I posted about a bull flag forming on the daily chart for Tesla. This flag pattern was a period of consolidation following an incredibly whooping rally from the $270 mark to around $350 (around a 30% or so gain).
Today, we have a new break-out from this consolidation period, and as of writing right now, Tesla is up 7%. It has now breached the $350 resistance level.
If you look more closely, the chart pattern resembles something close to a cup and handle pattern. You have the cup base going from the 20th of Feb 2025 all the way to the 14th of May 2025. Our bull flag which lasted between the 14th of May until the 23rd of May (last Friday), could as well be a handle for the cup base.
A break-out from not only the bull flag but the cup and handle could signal a massive move towards $400, however $375 and $390 could be points of resistance, and it would be wise to watch for a cooldown in the short-term.
Upcoming this week, it might worth mentioning that NASDAQ:NVDA earnings could have a strong impact on tech and affect Tesla - even if Tesla isn't much exposed to AI as the semiconductors.
To conclude, target is $390-$400 however as we all know, nothing is guaranteed :)
Note: Not financial advice. My analysis is not advice, rather just an idea. Please do your DD as well.

$NVDA bull flag potentialNASDAQ:NVDA setting up with a bull flag formation on the daily. A strong ER with good guidance can get us to 140-145. A less than stellar guidance can break the bull flag thesis and send it back to the 120-125 range, with some gaps below.
TSLA bull flagTsla is ramping up here with a daily flag as we sit in the middle of the range between supply and demand zones on the weekly. There is plenty of room for BBWP and stochastic RSI to expand on the weekly chart.
Near term target 400$
My plan:
Buy some TSLL and sell CSP

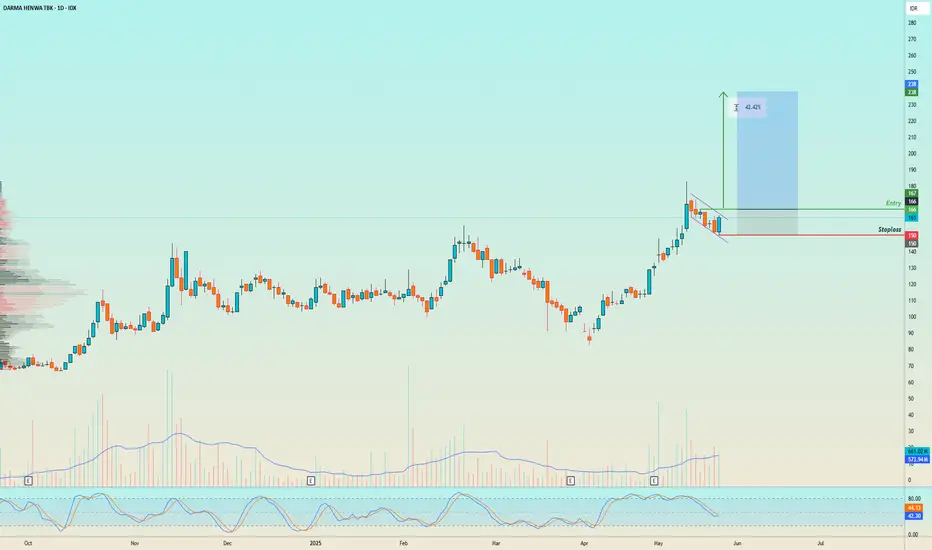
Waiting Break Off - DEWA1. Nice bullish flag pattern in bullish trend.
2. Volume above average vol 20 days
3. Stochastic ready for Golden Cross
4. Put Buy stop at Entry line
5. Nice Risk Reward Ratio