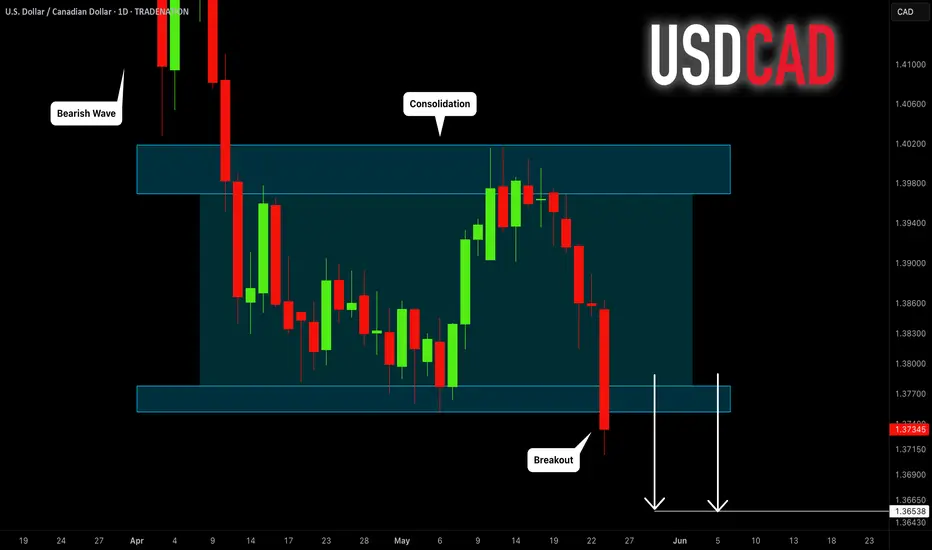
USDCAD: Bearish Continuation Ahead 🇺🇸🇨🇦
USDCAD completed a consolidation within a horizontal range.
A violation of its support and a daily candle close below that
is a strong bearish signal.
I believe that the price may drop lower next week
and reach at least 1.3655 level.
❤️Please, support my work with like, thank you!❤️
I am part of Trade Nation's Influencer program and receive a monthly fee for using their TradingView charts in my analysis.
Flag
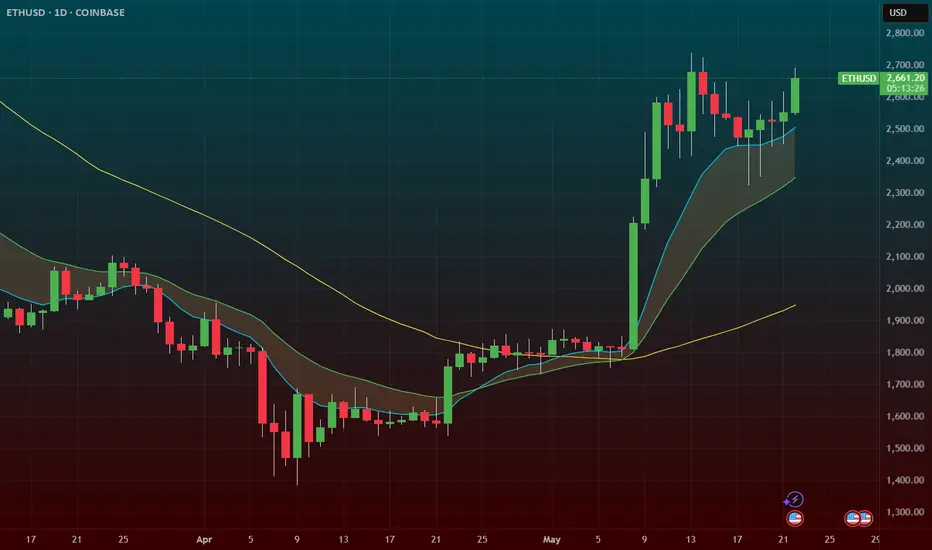
ETH (ethereum) – Massive Flag Pattern After 100% RunCRYPTOCAP:ETH – Bullish Flag After Monster Run
Ethereum ( CRYPTOCAP:ETH ) has nearly doubled since April, and now it’s cooling off — but in the best way possible: a bullish flag consolidation.
🔹 After a nearly 100% move, ETH has been consolidating tightly for two weeks — textbook flag behavior.
🔹 The trend remains strong, and this type of structure often leads to another leg higher.
🔹 Volume has tapered off during the flag — exactly what you want to see before a breakout.
Setup Overview:
Pattern: Large bull flag
Support/Risk: Defined risk to the $2500 zone
Measured Move Target: Breakout could push to $3100–$3500 based on the prior leg
Why I like this setup:
Healthy consolidation after a parabolic run
Risk/reward is favorable with structure and measured target
Potential breakout fuel from the ETH ETF narrative + BTC dominance rotation
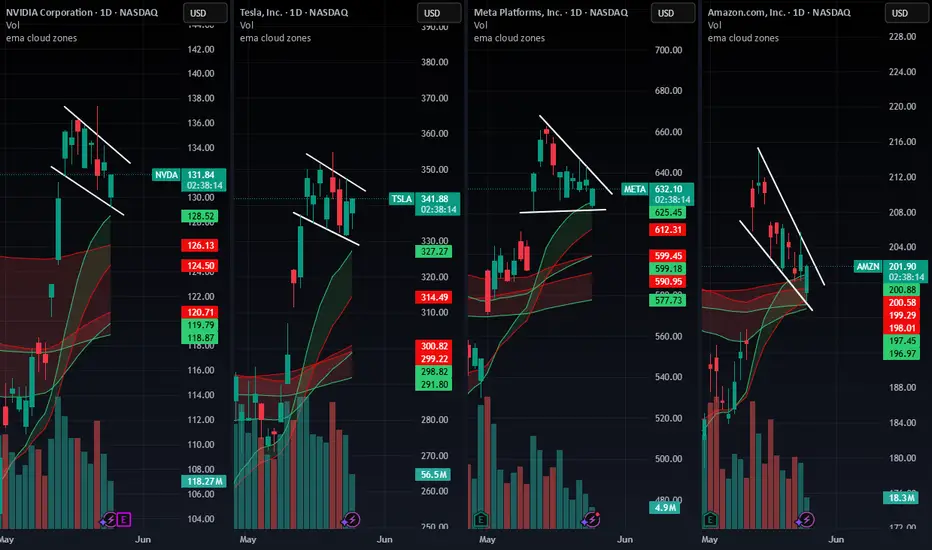
$NVDA $TSLA $META $AMZN – Triangle Squeeze Incoming?📊 Symmetrical triangle formations are building across these tech giants — and volatility is compressing.
🔍 What to watch:
📈 Breakout above upper trendline = bullish momentum
📉 Breakdown below lower trendline = bearish confirmation
📉 RSI on NASDAQ:NVDA is at 73.04 = overbought warning
⚠️ NASDAQ:NVDA earnings drop May 28, could be a trigger for resolution
These coils don’t last forever. Price is building pressure — and one strong candle could break the dam.
Stay sharp, and tighten your stops.
This is where risk management matters most.
👇 Which side are you betting on — breakout or breakdown?
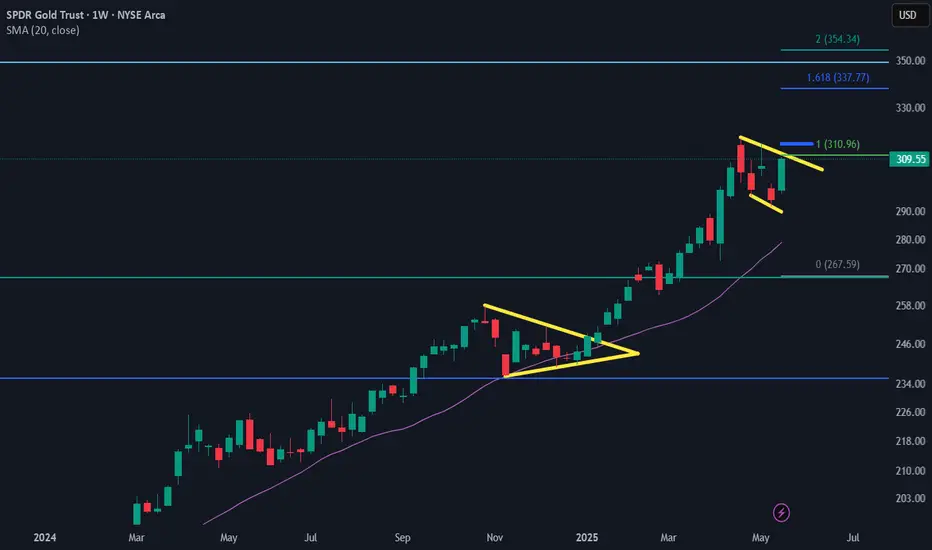
As Trump Destroys America Gold SoarsGold may be forming a bullish flag which has the price objective of $354.34. Additionally the anti-American policies enacted by Trump should continue to support bullish Gold market
AMEX:GLD
COMEX:GC1!
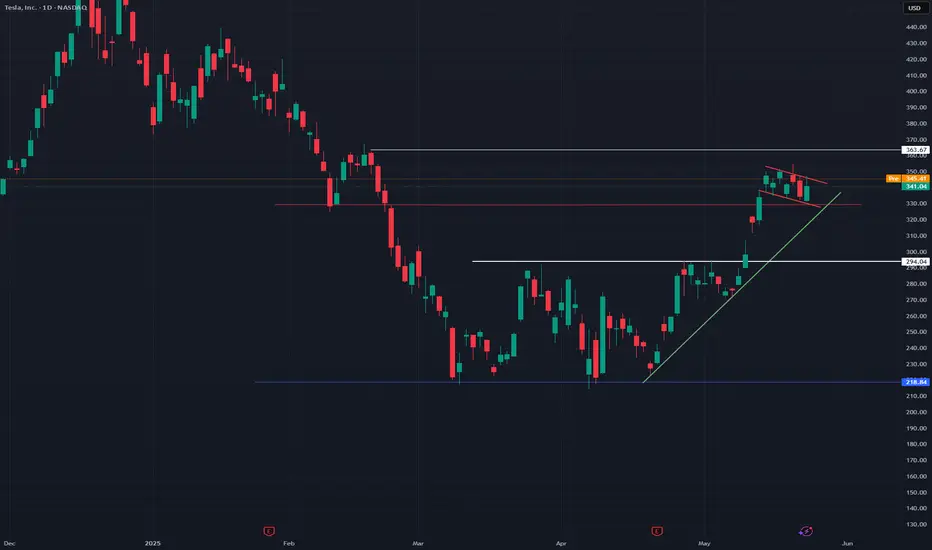
Tesla (TSLA): Daily uptrend support and potential bull flagHey guys/gals,
Today, I am showing you the daily chart of Tesla ( NASDAQ:TSLA ), which provides an idea of where this stock may be heading next.
As you can see, the support trendline from the 21st April low is still well intact. Currently, Tesla is holding this line very well and over the past few days, it's clear that it has also been in consolidation mode. Taking a deeper look, the consolidation period seems to be forming a potential bull flag pattern. Minus the upper wick which could be a price anomaly due to a fake-out, a real actual breakout from the bull flag in combination with a bounce from the support trendline could help Tesla reach $365 as the next resistance point.
On the contrary, and it does depend strongly on what the broader market does next (as Tesla is a high beta stock), its flag pattern may not play out and a break below the support line could send the stock all the way to first support at £325.
This wholly depends on the wider market. On my other posts, I've made it clear that S&P 500 AMEX:SPY is also forming a flag pattern, with many other indices following suit.
Note: Not financial advice.
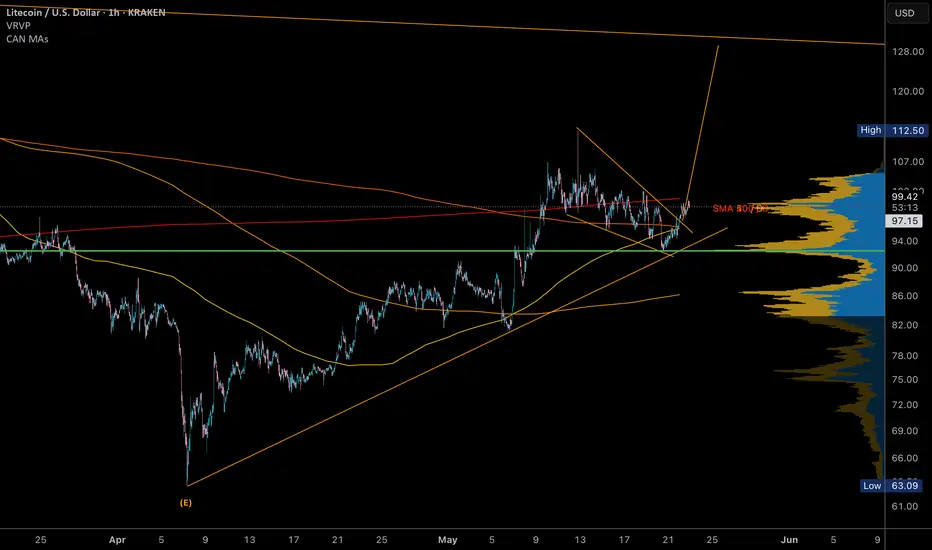
LTC - bull flag LTC (litecoin) breakout of the bull flag and getting on top of sma200D. Target 129 for long position.
S&P 500: Consolidating & forming bull flag on support trendlineSo, we all know that the market is taking a breather, and the past week has been mostly flat (kind of). There have been plenty of headlines, some good, some bad. Most notably, the news about the Moody's US credit downgrade. I woke up one morning, took a look at LinkedIn and saw all the CFA-certified investing experts expecting a massive game-changing moment, potentially a market crash.
Except, the market hasn't responded so negatively. In fact, I'd say that while long-term yields have been rising, the market has been doing its own thing .
For instance, taking a look at the daily chart of the S&P 500 paints a different picture of the doom and gloom that I've been hearing ALL weekend and ALL week long. As you can see, the index is currently sitting on the daily support trendline which goes back to the 7th April low.
On that trendline, taking a closer look, it seems the flat price action has been forming a bull flag. It's quite narrow and tight. But it certainly is a fine-looking bull flag. And a break above that would take the S&P 500 even higher.
This would also likely have a positive effect on other indices. Furthermore, it might be worth keeping an eye on the big S&P 500 stocks that are high-beta and like to follow the market.
So, to my point about how the market has been doing its own thing...seems that the Moody's downgrade could have possibly been already priced-in. I could be wrong, of course, as markets are still quite volatile and fragile to any sort of macro and global developments about trade and conflicts around the world.
Thank you for reading.
Note: not financial advice

NAS100 Sell TradeAfter Yesterday free fall NAS100 Took Support at 21021 level and formed a bearish Flag Pattren, we will take a sell stop entry after the breakout of Pole at 20970 level with SL of LH 21175 our 1st TP will be at 20790 right up side of 1st support and 2nd TP at 20610 2nd Support

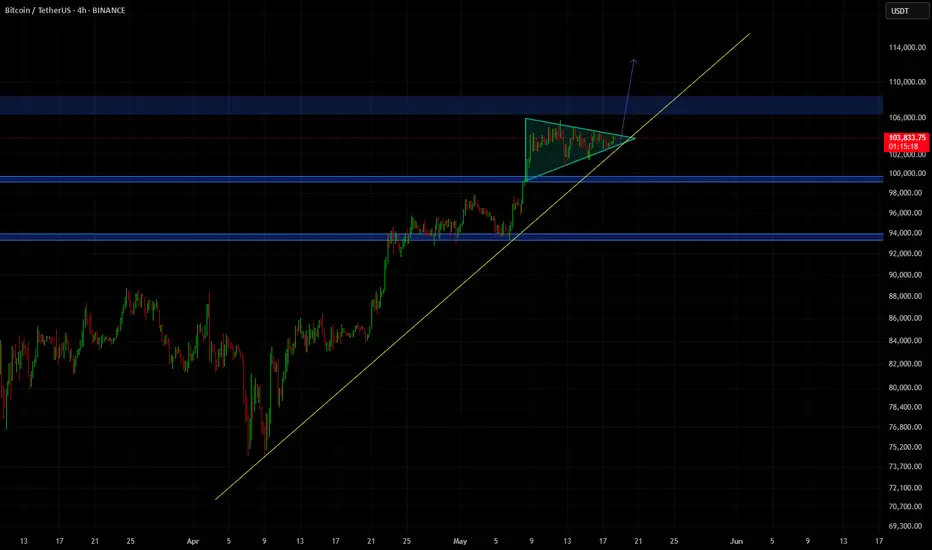
BTC is in an ascending triangle and we are an upward movement.Bitcoin is currently in an ascending triangle pattern, which is a bullish continuation pattern in technical analysis. This suggests that buyers are gaining strength and there is a high probability of an upward breakout. The fact that we're already seeing an upward movement supports the idea that a new uptrend may be starting.
In short:
Bitcoin is forming an ascending triangle, and we're witnessing an upward price movement, which could signal the beginning of a stronger bullish trend.
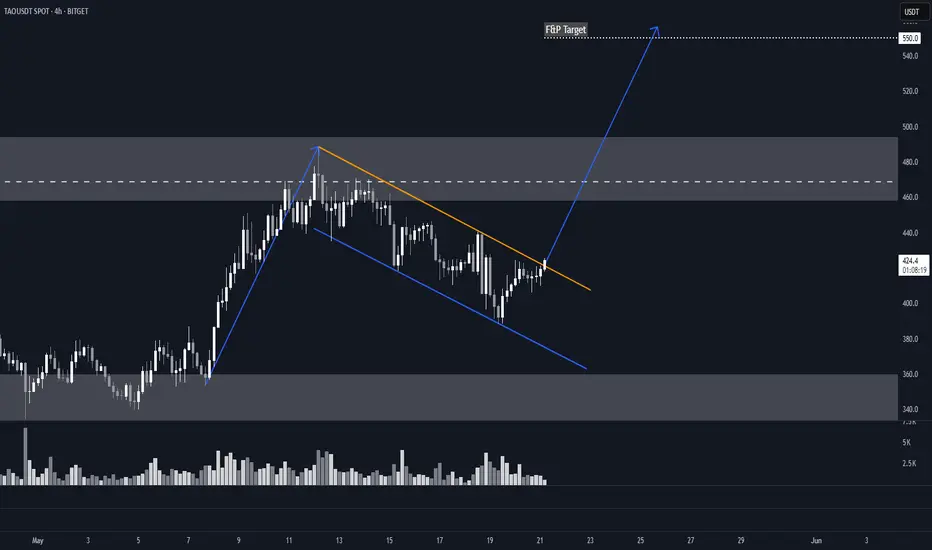
TAO Potential 4H Flag & PoleBITGET:TAOUSDT has printed a clean impulsive move followed by a descending consolidation channel — resembling a bull flag or falling channel continuation.
The retracement went deeper than usual (down to ~$388, ~75% of the pole), which softens the textbook bull flag narrative — but doesn't invalidate the setup.
Key Elements
• Pole: ~$354 → ~$489
• Flag Low: ~$388
• Retracement: ~75% of the pole — a deep pullback, but still valid.
• Target: ~$550 — measured from breakout point, equal to the pole’s height projected upward.
Keep in mind that $460-$490 is a key S/R and the midline of a longer-term rectangle, so it could offer resistance. See here .
Volume Note
No clear volume contraction during consolidation, which weakens the classic flag interpretation. That said, volume could still confirm strength if it expands on a breakout.
Target Logic
Measured move from pole height points to ~$550 — only in play if a full breakout with strong volume follows.
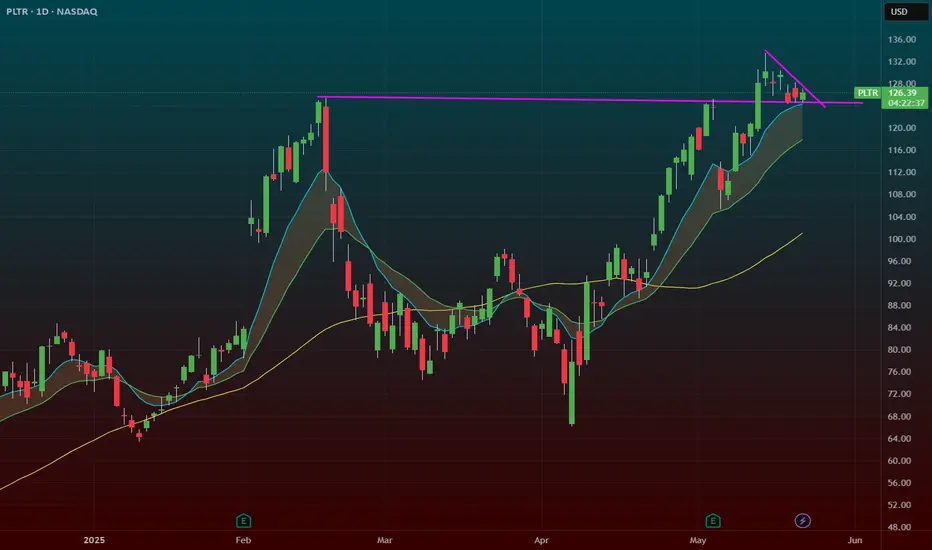
PLTR – Flag Breakout Above All-Time HighsPalantir is printing a bullish flag pattern right above its all-time highs — this is a textbook continuation setup that often leads to explosive upside.
🔹 After a strong breakout to ATHs, NASDAQ:PLTR has been consolidating in a tight range — a healthy pause.
🔹 Flags that form above prior resistance often act as launchpads when volume comes in.
🔹 Break over the flag highs could open the door to a new leg higher.
Setup Notes:
Watching for a breakout over the flag with volume confirmation.
Tight stop under the flag base keeps risk defined.
Price action remains bullish as long as it holds above previous ATHs.
🧠 This is one of my favorite setups — strong stock, strong base, strong trend.
this is the first pull after this initial thrust. The pullback has been boring and orderly too which i think is bullish for the stock
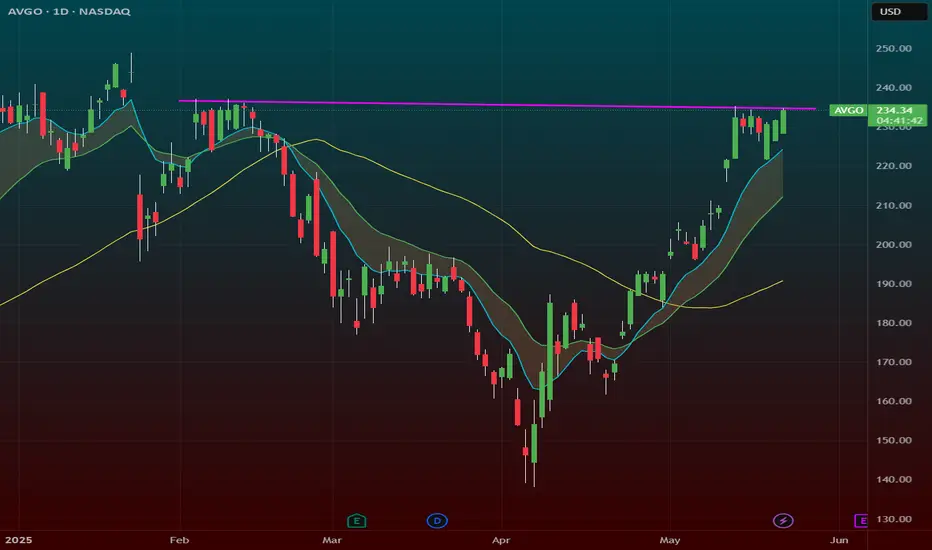
Broadcom (AVGO) is triggering a powerful breakout todayNASDAQ:AVGO – High Tight Flag + Range Breakout Setup
Broadcom ( NASDAQ:AVGO ) is triggering a powerful breakout today with two bullish patterns stacking up — a high tight flag and a larger range breakout.
🔹 High Tight Flag Breakout
Price action has been coiling tightly just under recent highs — a textbook high tight flag formation.
These setups often lead to strong continuation when they break with volume.
🔹 Range Break in the Works
We're now pushing through the $233–$234 zone, a key resistance level that has capped price recently.
A breakout here opens the door for a major trend continuation.
🔹 My Trading Plan:
1️⃣ Position: I’m playing the $235 calls for next week.
2️⃣ Entry Trigger: Breakout through the $234 level with volume.
3️⃣ Stop Loss: Stop will be based on intraday price action — likely below the 9 EMA or breakout level to manage risk.
🔹 Why This Setup Has Juice:
Strong consolidation near highs is a sign of strength, not weakness.
This is the kind of pattern where institutions start piling in.
Dual setup (flag + range breakout) increases probability of follow-through.
⚠️ Risk Management: Tight stop under breakout zone — manage risk, stay nimble.
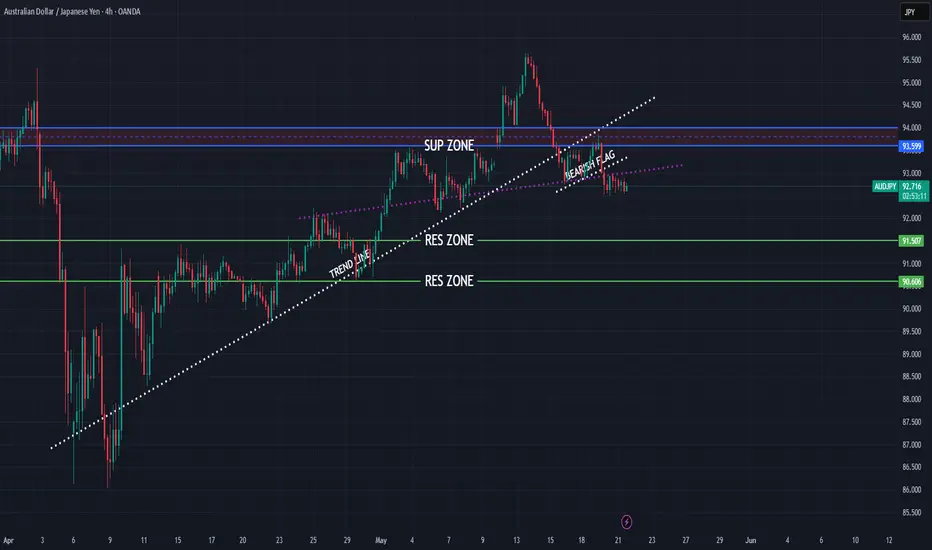
AUDJPY higher bearish for expect
OANDA:AUDJPY interesting structure, trend line is breaked and we can see bearish flag also is breaked.
Currently here expecting to see higher fall.
SUP zone: 93.600
RES zone: 91.500, 90.600
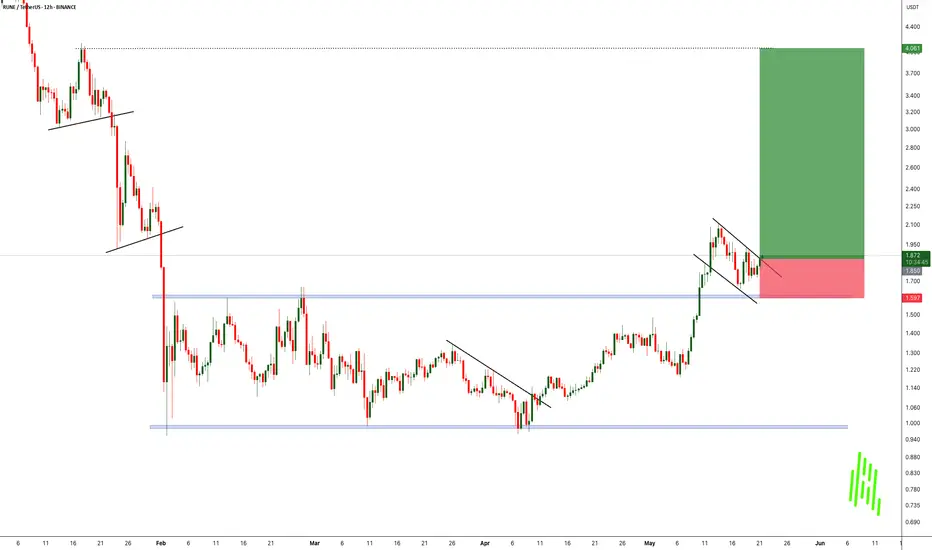
RUNEUSDT Breakout and Bull Flag Forming!!After nearly three months of tight consolidation, BINANCE:RUNEUSDT has finally broken out of its range-bound “box” structure. a powerful sign that the market is ready to move. This type of breakout often signals the end of indecision and the start of a strong directional trend.
What makes this setup even more exciting is the formation of a bull flag pattern right after the breakout. Known as a classic continuation pattern, the bull flag usually signals that the asset is simply pausing before its next leg up. The tight pullback within the flag is showing low-volume correction. A bullish sign that buyers are still in control.
With this confluence of a range breakout followed by a bull flag, BINANCE:RUNEUSDT is flashing all the signs of a potentially explosive move to the upside. However, it’s important to stay disciplined – always manage your risk and keep stop losses in place below the flag structure or previous support levels.
Next move could be strong. Stay sharp and ride the wave!
BINANCE:RUNEUSDT Currently trading at $1.87
Buy level : Above $1.86
Stop loss : Below $1.6
Target 1: $2.2
Target 2: $3
Target 3: $4
Max leverage 3x
Always keep stop loss
Follow Our Tradingview Account for More Technical Analysis Updates, | Like, Share and Comment Your thoughts
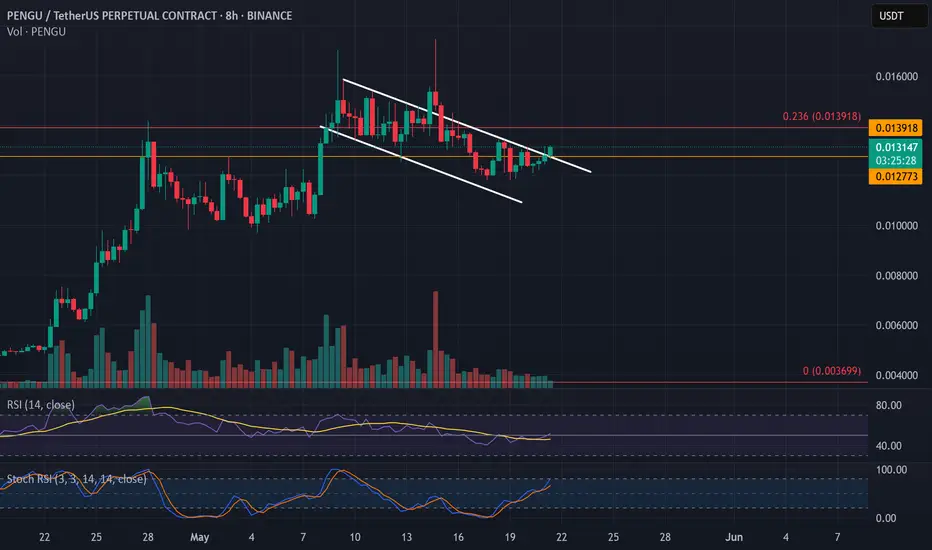
PENGUUSDT Breaking Bullish Flag – Eyes on 0.03PENGUUSDT is breaking out of a bullish flag pattern, a classic continuation signal in an uptrend. The breakout is occurring with strong momentum, supported by the RSI crossing above the 50 zone on the 8H timeframe, adding further confidence to bullish bias.
📊 Key Levels:
TP1: 0.382 Fibonacci – $0.020
TP2: 0.5 Fibonacci – $0.025
TP3: 0.618 Fibonacci – $0.030
Stop Loss: $0.012 (below recent swing low)
This breakout may mark the beginning of a new bullish leg. Keep an eye on volume for confirmation and adjust risk accordingly.
Trade safe and always use proper risk management.
#PENGUUSDT #Crypto #BullishFlag #RSI #Fibonacci #Breakout #Altcoins
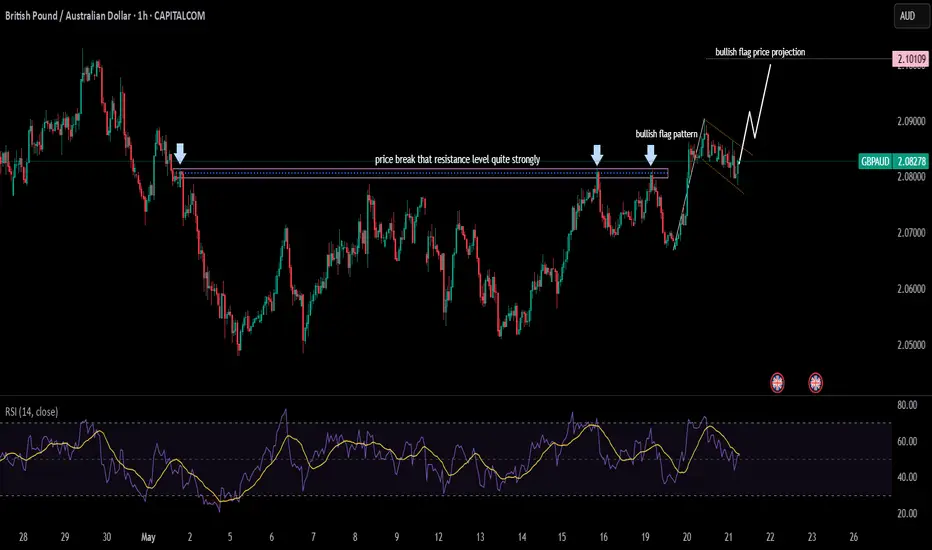
GBPAUD looks good for a bullish ridewith a bullish flag pattern and upward price action with no major reversal signs, all these confluences indicate that the price will hit the projection price of the flag. Buy stop order when the price breaks where the pole and the flag are meeting can be placed
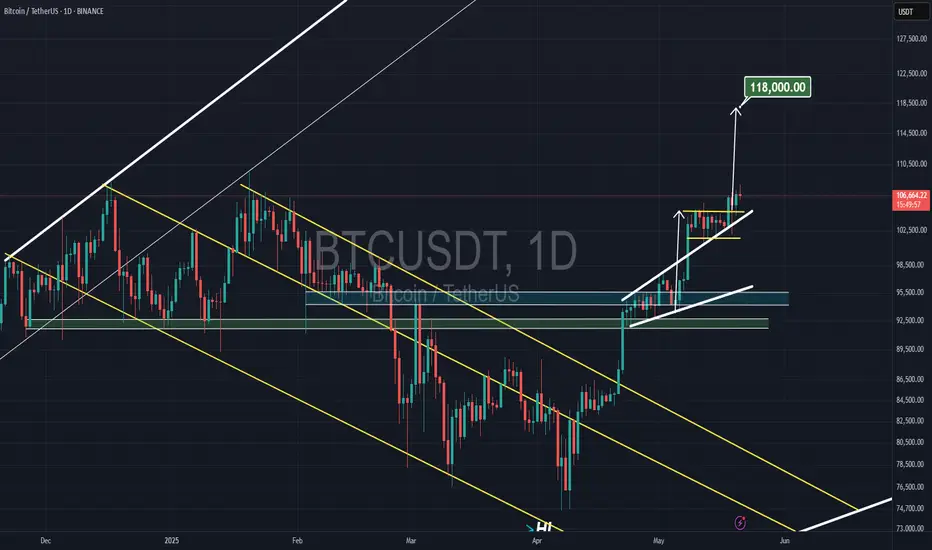
Bitcoin BULLFLAG on daily ( 21MAY2025 )It looks like Bitcoin has bull-flag on daily time frame and the yellow resistance line already has broken.
Now the target of this bull-flag is about $118k so far.
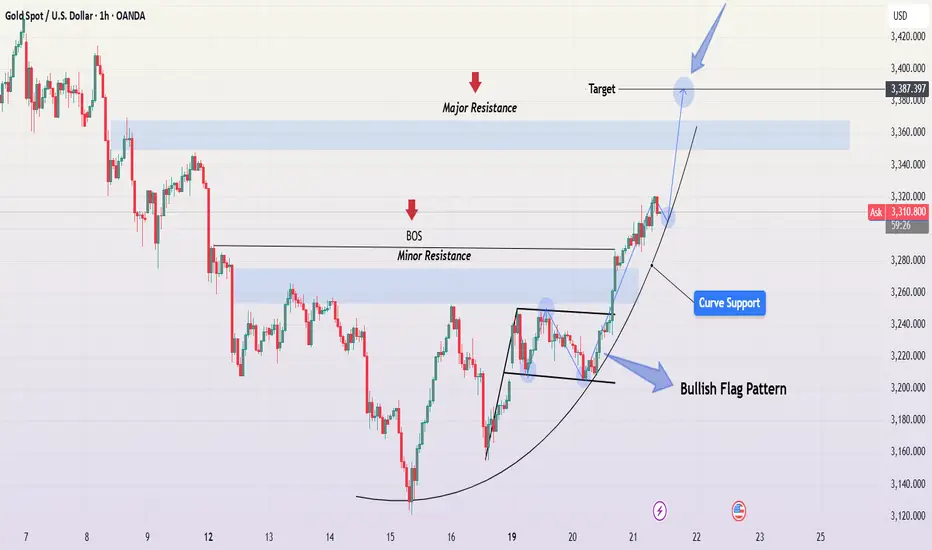
XAUUSD Breakout from Bullish Flag – Eyes on $3,387Gold (XAUUSD) on the 1H timeframe is exhibiting a strong bullish continuation setup, supported by multiple confluences that suggest the uptrend is far from over. The chart clearly shows the market breaking out from a Bullish Flag Pattern, respecting curve support, and targeting the major resistance zone near $3,387.
🔍 Technical Breakdown:
1. Bullish Flag Pattern Formation
After a sharp bullish impulse, price consolidated in a tight downward-sloping channel — the classic bullish flag. This pattern typically appears mid-trend and signals a healthy pause before the next leg higher. The breakout from the flag confirms bullish continuation, often offering a high-probability trade entry.
2. Break of Structure (BOS)
The breakout above minor resistance marked a Break of Structure (BOS), which is a key bullish signal. It indicates a shift in market sentiment and validates the end of the corrective phase (flag) and beginning of the next impulse wave.
3. Curve Support (Parabolic Trajectory)
A parabolic curve support is now guiding price upward, showing increasing bullish pressure and higher lows forming consistently. This type of dynamic support often appears in strong trending markets where buyers step in aggressively at every pullback.
4. Liquidity Sweep & Smart Money Behavior
Before the breakout, price dipped below recent lows within the flag, likely sweeping liquidity and triggering stop-losses. This move provided institutional players with the liquidity needed to push price higher — a classic smart money trap-and-break scenario.
5. Volume & Momentum Confirmation
The breakout occurred with strong bullish momentum and rising volume (if checked on the volume profile), reinforcing the credibility of this move. A momentum-based continuation is likely as long as price remains above previous resistance (now support).
🎯 Target & Resistance Levels:
Short-Term Target: $3,387 — aligned with the previous major resistance area
Support Zone: $3,260–$3,275 (previous flag breakout + structure support)
Major Resistance Zone: Around $3,360–$3,387 (historical supply zone)
🧠 Trade Idea / Strategy:
As long as price holds above the curve support and retests the previous breakout zone (flag top or minor resistance), bullish entries on pullbacks are favored.
✅ Buy on dips into curve support or minor resistance retests.
❌ Avoid shorting into a strong parabolic structure unless signs of exhaustion appear.
🎯 Potential RR setups: 1:2 and beyond if entry is timed well.
💬 Conclusion:
The market structure, pattern confirmation, and strong bullish momentum all point toward a continuation move toward the $3,387 level. This setup provides a solid technical case for bullish trades with multiple entry options and well-defined risk levels. Keep an eye on curve support and potential higher timeframe resistance reactions for dynamic trade management.
Trxusdt ,,,, technical analyst Tron has formed a bullish flag pattern, and it can go up as high as the length of the flag bar. Please trade with your own analysis. I am not responsible for your losses or losses. because this analysis is a personal guess and analysis.

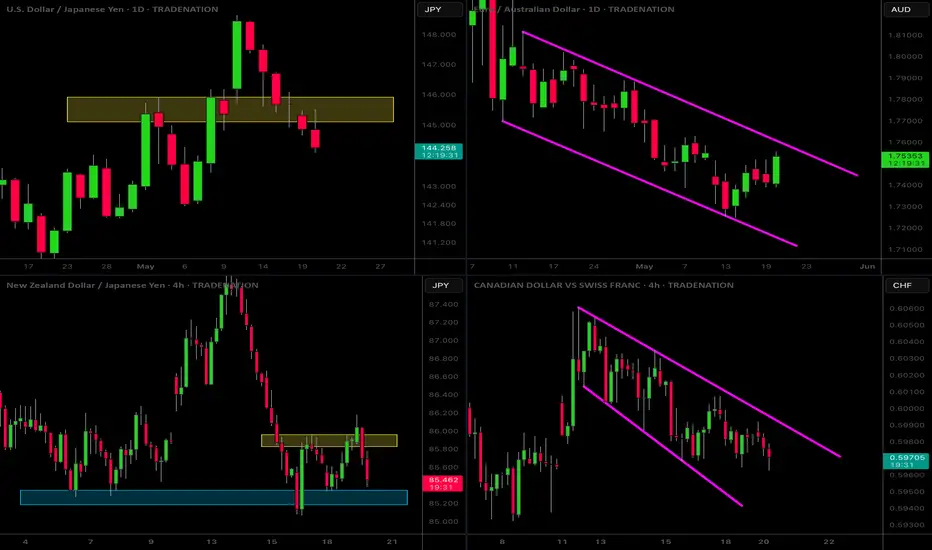
MarketBreakdown | USDJPY, EURAUD, NZDJPY, CADCHF
Here are the updates & outlook for multiple instruments in my watch list.
1️⃣ #USDJPY daily time frame 🇺🇸🇯🇵
The pair demonstrates clear strength of the sellers.
The price went way below a recently broken resistance.
With the absence of impactful fundamental news,
the market may continue falling for now.
2️⃣ #EURAUD daily time frame 🇪🇺🇦🇺
The market is trading within a wide falling parallel channel on a daily.
Its upper boundary is a strong vertical resistance.
I will look for selling from that.
Alternatively, its bullish breakout may push the prices much higher.
3️⃣ #NZDJPY 4H time frame 🇳🇿🇯🇵
Before an Australian interest rate decision at night,
the pair acted strongly bullish, following our plan.
I see a nice double bottom pattern and a confirmed bullish Change of Character CHoCH.
I think that growth will resume soon
4️⃣ #CADCHF 4H time frame 🇨🇦🇨🇭
The price formed a nice bullish flag pattern.
I am waiting for its bullish breakout to confirm a start
of a new bullish wave.
A candle close above its upper boundary will validate the violation.
Do you agree with my market breakdown?
❤️Please, support my work with like, thank you!❤️
T Bond Futures Quarterly chart targets the LOWSDebt levels are increasing
There is insufficient demand to soak issuance.
Interest rates need to increase.
The value of bonds is expected to decline down to the bear flag target.

NZDJPY: Another Bullish Confirmation 🇳🇿🇯🇵
If you remember, I already posted a bullish outlook for NZDJPY on Friday.
This morning, I spotted one more intraday bullish confirmation.
I see a breakout of a resistance line of a bullish flag pattern on an hourly time frame.
I expect a bullish movement at least to 85.9 level soon.
❤️Please, support my work with like, thank you!❤️
I am part of Trade Nation's Influencer program and receive a monthly fee for using their TradingView charts in my analysis.

gold is ready for continuation to the upper sidegold has already done its retracement and successfully cover the value gap and now is ready to climb back up to first retest 3500. and potential to 3700.
