BTC/USDT 4H – Bull Flag Breakout SetupA symmetrical triangle has resolved to the upside, confirming a bull flag breakout in line with the prior uptrend. Current momentum is supported by:
* RSI breakout above 60
* Price above mid-Bollinger Band and 55 SMA
* Breakout candle closing above triangle resistance (Yet to confirm)
**Targets:**
TP1: 108,000 – nearest horizontal resistance
TP2: 112,700 – flagpole projection from 104.5K breakout
TP3: Trailing target with 1.0% callback from breakout zone
**Stop Loss:**
Below triangle apex (\~103,000) or 55 SMA (\~103,480), depending on which is closer
**Volume:**
Still below average but RSI confirms bullish momentum. Watching for volume follow-through to confirm strength.
**Wyckoff context:**
Potential Phase D in a re-accumulation range, with breakout as Sign of Strength (SOS) after a spring-like consolidation.
This breakout is being monitored as part of a continuation setup toward 112.7K with proper risk management in place.
Flag

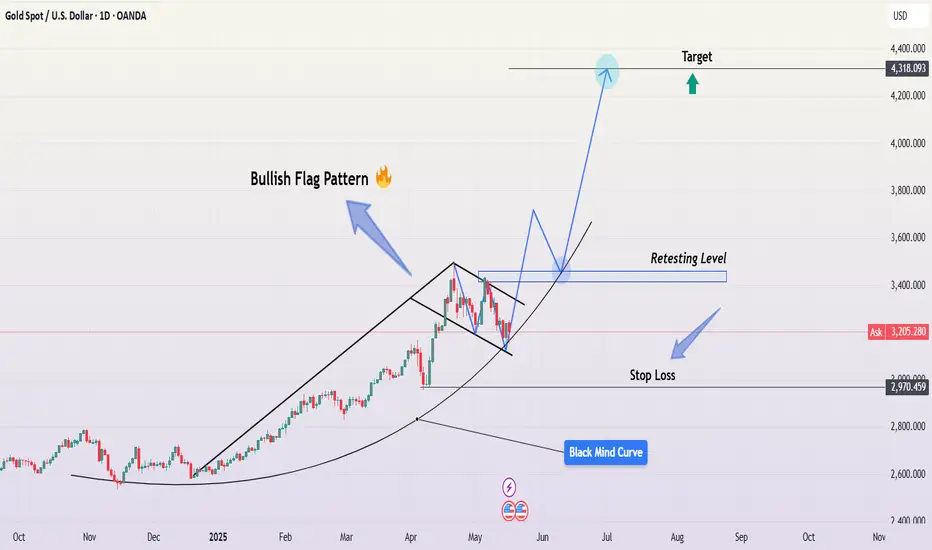
XAUUSD – Bullish Flag Breakout & Black curve Line | Target Gold (XAUUSD) is currently shaping a textbook bullish flag pattern on the daily chart, signaling a potential continuation of the strong uptrend that started late last year. This setup, when combined with the custom-drawn Black Mind Curve, provides a structured and disciplined approach for identifying entry, retest, stop loss, and profit targets. Let’s break it down in detail:
🔍 1. Flagpole: The Impulse Move
The rally from around $2,550 in December 2024 to nearly $3,330 in April 2025 formed a steep and aggressive uptrend, which now serves as the flagpole of our pattern.
This impulsive wave represents strong buying momentum and is the backbone of the entire bullish flag structure. It shows institutional interest and heavy volume participation in gold, likely driven by macroeconomic factors such as inflation hedging, USD weakness, or geopolitical uncertainty.
🔷 2. Bullish Flag: The Consolidation Zone
Following the peak, gold entered a consolidation phase, forming two parallel descending trendlines, indicating healthy profit-taking and temporary market indecision. This is not a reversal but rather a pause in the trend, often seen before the next leg higher.
This down-sloping consolidation resembles a flag pattern—a reliable bullish continuation formation where the price temporarily contracts before a breakout.
The flag pattern is still valid as long as price remains inside or breaks above the upper boundary with momentum.
📈 3. Breakout Signal and Retesting Level
As of now, price is testing the upper boundary of the flag. A bullish breakout is anticipated once price closes above the $3,300–$3,350 resistance zone.
Following the breakout, a pullback to retest this same level is expected, forming a new support zone—a classic "breakout–retest–rally" setup.
💡 Retest Zone:
$3,300 to $3,350
This is your key zone to watch for confirmation. A bounce here could offer the best risk-reward entry.
🛡️ 4. Stop Loss Placement: Protecting Your Capital
To manage risk effectively, the stop loss should be placed below the lower boundary of the flag, and ideally just under the psychological round number at $2,970.
This protects your trade from a false breakout or sudden trend reversal while keeping the risk/reward ratio favorable.
🎯 5. Target Projection: Measured Move Strategy
We use the height of the flagpole (approximately $750) and project it upward from the breakout point to estimate the target price.
📌 Target Level:
$4,318 (approx.)
This aligns with technical confluence and psychological resistance above the $4,300 level.
If momentum remains strong and the macro environment continues to support gold prices, this level is a very realistic short-to-medium-term target.
🧠 6. The Black Mind Curve: A Unique Trend Framework
The chart features a custom “Black Mind Curve”, a smooth parabolic line following the overall trend structure. This curve acts as a visual guide for trend strength, suggesting that gold is respecting a higher time frame uptrend trajectory.
It helps reinforce that the bullish structure is still intact—even during short-term pullbacks—by mapping the psychological rhythm of market participants.
This curve is especially useful for swing traders who need to maintain conviction during consolidations.
🧠 Trading Psychology (Mind Framework):
"Charts show the facts; your mind interprets the truth."
Here’s the psychological approach for this trade:
Recognize the Setup: Bullish flag is forming—observe, don’t rush.
Wait for Confirmation: Let price break out and retest—avoid FOMO.
Act on Logic: Enter with defined stop and target—keep emotions out.
Stay Disciplined: Don’t move stop loss irrationally—trust your setup.
Let the Market Work: Once the trade is active, manage it calmly.
🔁 Summary of Trade Plan:
✅ Entry: On confirmed breakout and successful retest of $3,300–$3,350
✅ Stop Loss: Below $2,970
✅ Target: $4,318
✅ Pattern Type: Bullish Flag + Trend Curve Support
✅ Risk-Reward Ratio: ~1:3+ (Ideal setup)
📝 Final Thoughts:
This is a high-probability bullish continuation pattern supported by strong technical structure and psychological market behavior. The breakout is likely to attract institutional flows, especially if it aligns with fundamental tailwinds like falling interest rates or rising inflation.
Stay patient, wait for the retest confirmation, and trade with discipline. Gold is poised for a potential new leg higher—and this setup provides a structured roadmap to ride that move confidently.
Bearish Flag continuation Price breaks down the formed a bearish flag sideways once it breaks the lower line of the flag is the entry entry , may be can wait for retesting for extra confirmation but if it breaks with high volume , big engulfing bearish candle is the trigger , stop loss at the last swing high and take profit is 1:1.5 RR for the 1st Target 2nd target take profit @ 1:2 RR

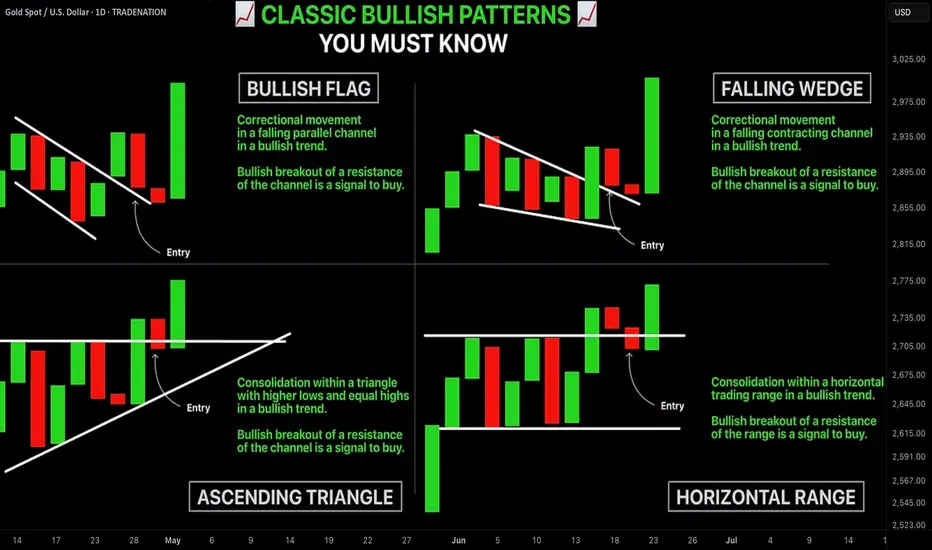
4 Profitable Bullish Patterns EVERY TRADER Must Know Forex, GOLD
In the today's post, we will discuss accurate bullish price action patterns that you can apply for trading any financial instrument.
1️⃣Bullish Flag Pattern
Such a pattern appears in a bullish trend after a completion of the bullish impulse. The flag represents a falling parallel channel. The market corrects itself within.
Bullish breakout of the resistance line of the channel is a strong bullish signal that can be applied for buying the market.
Best entries should be placed immediately after a breakout or on a retest.
Safest stop loss is below the lows of the flag.
Target - the next key resistance.
Here is the example of a bullish flag pattern that was formed on Gold on a 1H time frame. As you can see, after the breakout of the resistance of the flag, a strong bullish rally initiated.
2️⃣Ascending Triangle
Such a pattern forms in a bullish trend on the top of the bullish impulse. The market starts consolidation, respecting the same highs and setting higher lows simultaneously.
The equal highs compose a horizontal resistance that is called the neckline.
Its breakout is an important sign of strength of the buyers.
Buy the market aggressively after a violation, or set a buy limit order on a retest.
Stop loss should lie at least below the last higher low within a triangle.
Target - the next strong resistance.
Take a look at that ascending triangle formation on EURUSD.
Bullish breakout of its neckline was a perfect bullish signal.
3️⃣Falling Wedge
That formation is very similar to a bullish flag pattern.
The only difference is that the price action within the wedge is contracting so that the trend line of the wedge are getting closer to each other with time.
Your signal to buy is a bullish breakout of the resistance of the wedge.
Stop loss is strictly below its lows.
Target - the next key resistance.
GBPUSD formed a falling wedge on a 4H time frame, trading in a strong bullish trend.
You can behold how nicely the price bounced after a breakout of its upper boundary.
4️⃣Horizontal Range
Similarly to the ascending triangle, the horizontal range forms at the top of a bullish impulse in a bullish trend.
The price starts consolidation , then, setting equal highs and equal lows that compose a horizontal channel.
Breakout of the resistance of the range is a strong trend-following signal.
Buy the market aggressively after a breakout or conservatively on a retest.
Stop loss will lie below the lows of the range.
Target - the next strong resistance.
Dollar Index formed a horizontal range, trading in a strong bullish trend.
Breakout of the resistance of the range triggered a bullish rally.
The best part about these patterns is that they can be applied on any time frame. Whether you are a scalper, day trader or swing trader, you can rely on these formations and make consistent profits.
❤️Please, support my work with like, thank you!❤️
I am part of Trade Nation's Influencer program and receive a monthly fee for using their TradingView charts in my analysis.
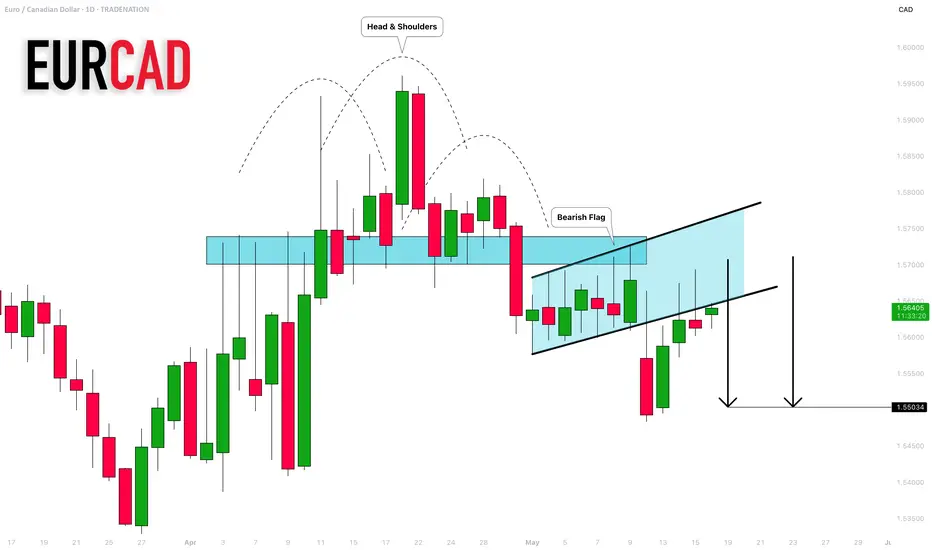
EURCAD: Another Bearish Pattern 🇪🇺🇨🇦
Earlier, we spotted a head & shoulder pattern on EURCAD on a daily
and a confirmed breakout of its neckline.
Analysing a price action, I spotted another bearish formation today.
The price formed a bearish flag pattern, and it is retesting a broken
trend line at the moment.
I think that the pair may drop lower soon.
Next support - 1.5503
❤️Please, support my work with like, thank you!❤️
I am part of Trade Nation's Influencer program and receive a monthly fee for using their TradingView charts in my analysis.
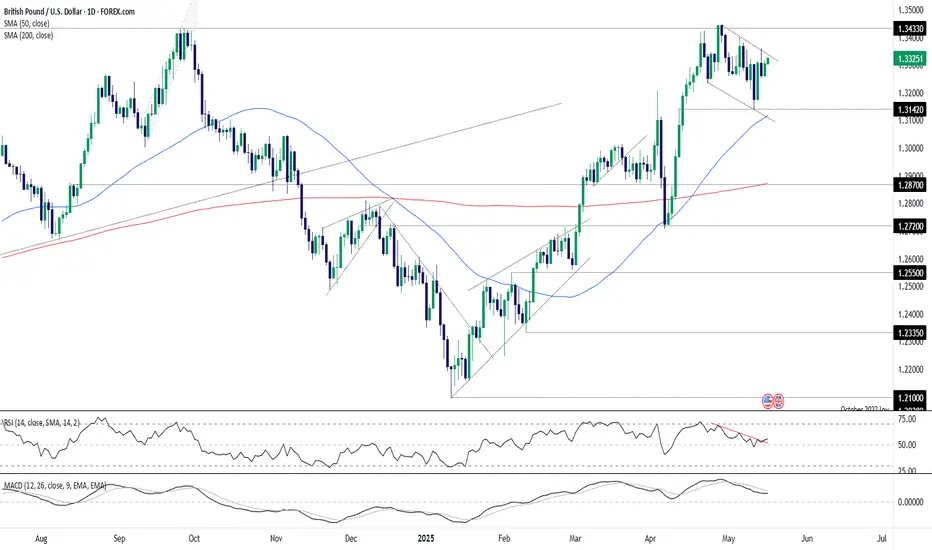
GBP/USD: Bull Flag Watch as Momentum Builds for Topside BreakGBP/USD traders should be on alert for a potential topside break, with price action resembling a bull flag formation.
Downtrend resistance comes in near 1.3340 today—a key level to watch for those considering bullish setups.
A break above that trendline would shift focus to the April 29 high at 1.3444. If cleared, there's not much standing in the way until 1.3644.
Momentum signals are also starting to turn more constructive, with the 14-day RSI breaking its recent downtrend and MACD curling back towards the signal line above zero. Taken together, the setup favours buying dips and trading in line with any upside break.
Good luck!
DS
GOLD support @ $3100There are a lot of things that show the price about $3100 for Gold is a really important & strong support for now.
We have 61% & 70.2% of Fibonacci retracement about this area.
The bear flag target on 4H TF is at $3100.
Even the target for double top is at that area.
In the past the price of $3100 was a support as well.

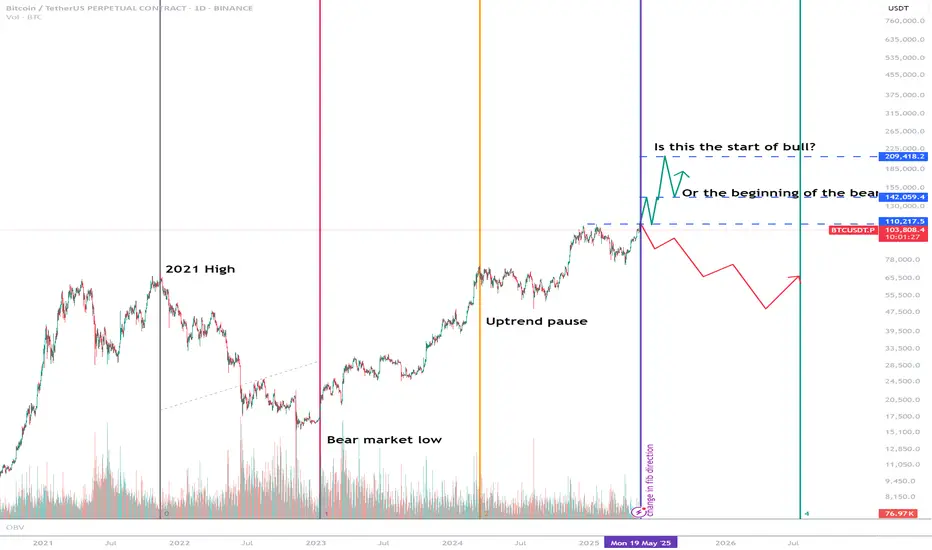
BTC decision time (16th-19th May)Its as simple as this. Fib Time Zone has accurately picked high, low, pause and now comes to a critical juncture. Could we finally be seeing the beginning of a bull run for all crypto assets or will we begin a bear market.
Note time until end is in 460 days from May.
My view
End of May, June, July heavy upside for crypto.
BTC up till $140-145k (may wick to 150k)
July, Aug - The whales party in Europe again and expect a 30-35% drop - potentially back to $100k.
Sept - Dec - Pumpamentals. Everyone is happy. Expect another 30% dump and a final blow out top (the one where you see thousands of posts on Instagram, X etc that they have their lambos.
If my thesis is correct, bull market ends March-June 2026.
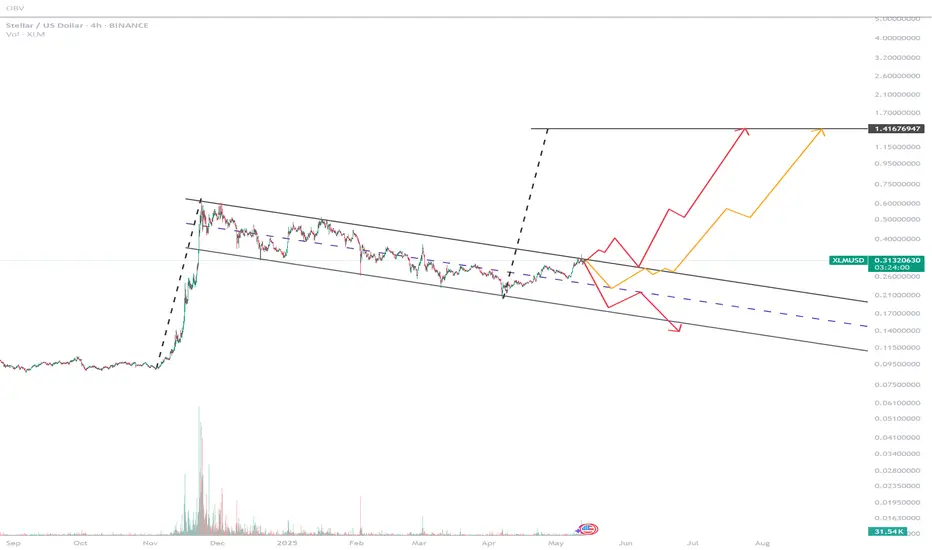
XLM: The bull flag that wants $1.50Time Frame: Midterm (expect to close before end of 2025
Entry point: 19-33c
Exit: $1.40-$1.50
Stellar, often seen as a younger brother of XRP, hasn’t seen much of the spotlight from its more well known older brother, but has performed better than almost all major currencies since the Trump election win in November 2024. Where as ETH and other currencies are performing poorly since Trump’s election win, Stellar has performed amazingly and still 200% up from Nov 5th 2024. So with that great gain already, why does Ralfetto believe there is more to come?
So what is XLM?
XLM, is an open-source, decentralized payments network. It uses blockchain technology to allow users to transfer funds quickly and at a very low cost. The payments network does not show preference to any national currency; instead, the network has its own native cryptocurrency, Stellar Lumens.
So why is XLM worth investing in?
Firstly, at Ralfetto, our views are our own and we are just providing our thesis why we like it, your investment decisions are your own. We are of the belief that XLM will be part of the new X/Grok ecosystem as its payment option. We see alot of evidence pointing to it (alongside XRP). XLM is also ISO compliant which makes it one of a few that supports this technology.
What is the chart telling us?
XLM looks like a bull flag with a target to push it to $1.5. With that type of move, we do expect some fall back given a 5x return.
How we are investing
We believe XLM/Stellar will reach two major targets within 3 years. The first in 2025 of $1.40-150 which is our take profit level 2. After that we expect some volatility before it reaches its final destination of $4.50. There may be further upside but we will be having moving stops once it hits both targets.
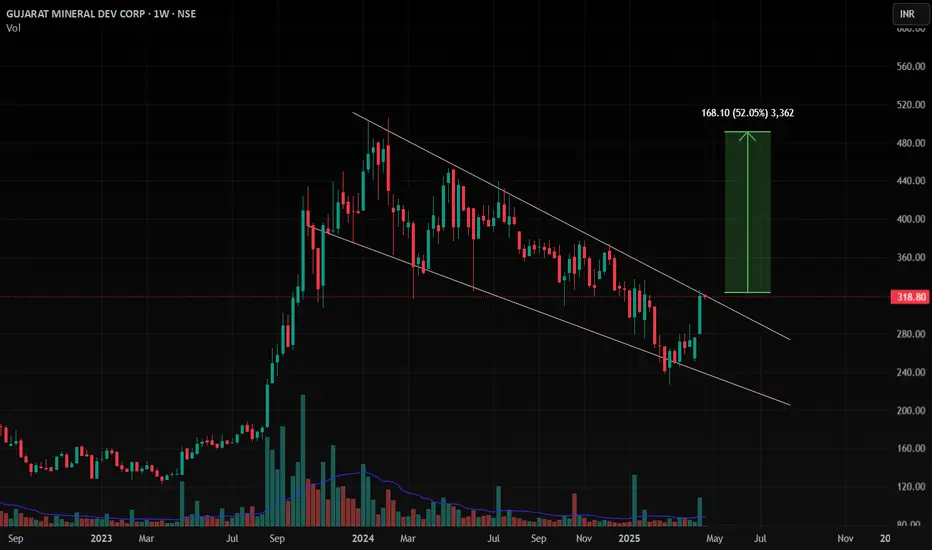
GMDC , 1WPattern is Looking very Great and is Ready to Breakout ,
if it broke the upper trendline with Good Volume then we can consider it is the best breakout
Follow for more Swing Ideas Like this
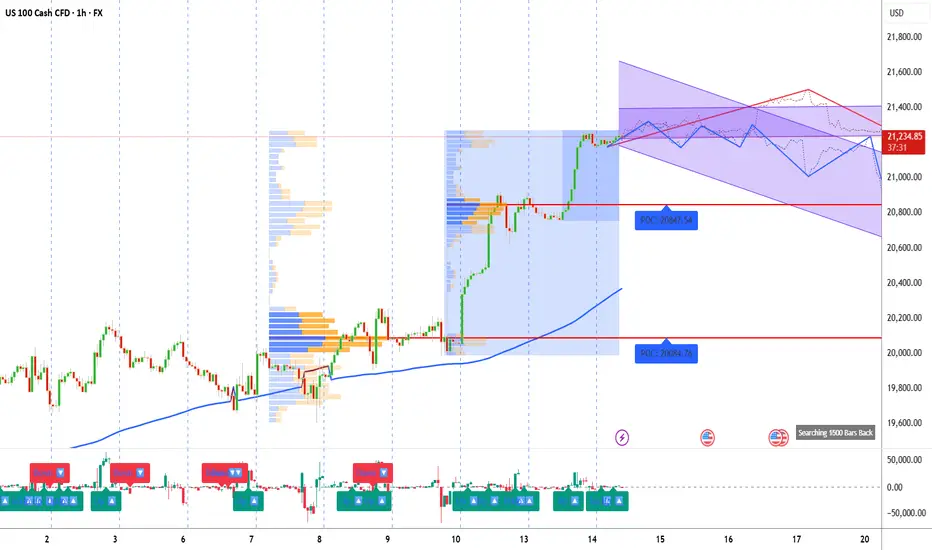
Technical Breakdown on US 100 | 1H TimeframeTechnical Breakdown on US100 Cash CFD – 1H Chart Analysis using Volume Profile, Gann, and CVD + ADX
1. Key Observations (Volume, Gann & CVD + ADX Focused)
a) Volume Profile Insights:
Value Area High (VAH): 21,250
Value Area Low (VAL): 20,850
Point of Control (POC): 20,847.54 (Previous), 20,084.76 (Earlier POC)
High-volume nodes:
Strong cluster near 20,850–21,000: confirmed price acceptance.
Minor node around 21,235–21,250: current area being tested.
Low-volume gaps:
Between 21,050 and 21,150 – fast move area if price breaks.
b) Liquidity Zones:
Upside:
21,250 (new high, recent wick rejection) – likely stop clusters above.
Downside:
21,000 – last breakout consolidation zone.
20,850 – absorption and prior POC zone.
Absorption Zones:
Significant delta volume activity near 20,850 – signs of large orders being filled.
c) Volume-Based Swing Highs/Lows:
Volume spike reversal high: 21,250 (upper wick + rejection)
Volume spike reversal low: 20,850 (strong bounce)
d) CVD + ADX Indicator Analysis:
Trend Direction: Confirmed uptrend, now showing signs of range-bound behavior post-breakout.
ADX Strength:
ADX > 20, DI+ > DI- earlier = strong uptrend.
Currently flattening, indicating possible transition to range/consolidation.
CVD Confirmation:
Rising CVD during breakout leg, now diverging (sideways/slight dip) = demand exhaustion possible.
2. Support & Resistance Levels
a) Volume-Based Levels:
Support:
VAL: 20,850
POC: 20,847.54
Psychological & structural: 21,000
Resistance:
VAH: 21,250
Previous intraday top: 21,243–21,250
b) Gann-Based Levels:
Swing High: 21,250
Swing Low: 20,084
Key retracement levels (from 20,084 to 21,250):
1/2: 20,667
1/3: 20,472
2/3: 20,889
3. Chart Patterns & Market Structure
a) Trend:
Bullish overall, transitioning into range-bound consolidation at the top.
b) Notable Patterns:
Channel/Wedge forming above 21,000 with downside risk to mid-level support.
Potential double top near 21,250 with divergence in CVD.
Volume gap retest likely if price slips below 21,100.
4. Trade Setup & Risk Management
a) Bullish Entry (If CVD + ADX confirm uptrend continuation):
Entry Zone: 21,000–21,030 (retest support + consolidation base)
Targets:
T1: 21,200
T2: 21,250
Stop-Loss (SL): 20,850
RR: Minimum 1:2
b) Bearish Entry (If CVD + ADX confirm trend reversal):
Entry Zone: 21,240–21,250 (supply zone + divergence)
Target:
T1: 21,000
Stop-Loss (SL): 21,300
RR: Minimum 1:2
c) Position Sizing:
Risk 1–2% of trading capital per trade for optimal capital preservation.
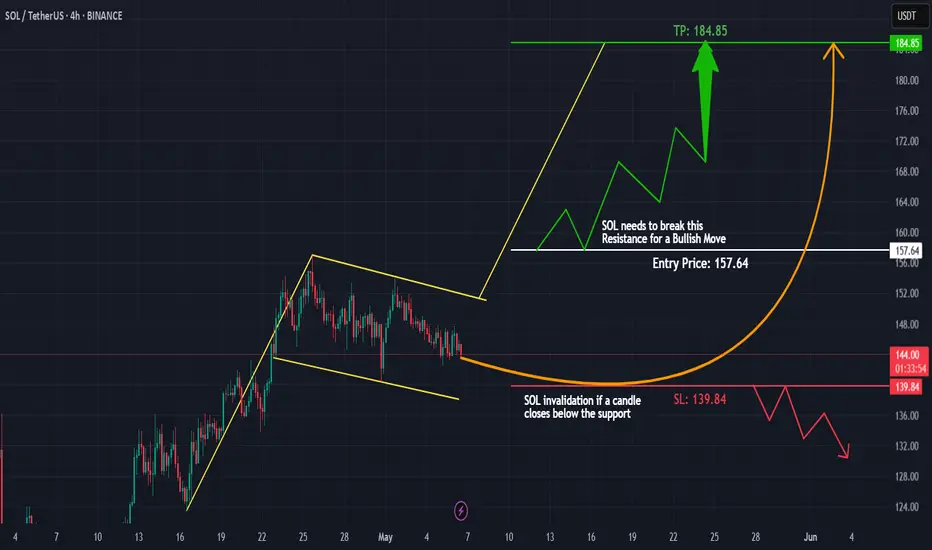
SOLANA (SOL/USDT) – Bullish Flag Forming on 4H!Hey traders!
#SOLANA is currently consolidating sideways and printing a bullish flag pattern on the 4-hour timeframe – a classic continuation signal after a strong upward move! 🚀
Here's the plan:
Wait for a clean breakout above the flag's resistance
Enter on the retest of the breakout level to confirm support
Apply strict risk management and target the next major resistance zone
Watch for increasing volume to validate the move
Why this matters?
The bullish flag often leads to explosive moves when confirmed properly. Don’t chase the breakout — let price come to you. Patience = profits. 🧘♂️
Key Levels & Entry Plan marked on chart
Drop your thoughts below – do you agree with this setup or see it differently?
Like & Follow for more clean, no-hype trade ideas!
#Solana #SOL #CryptoTrading #BullishFlag #TradingView #TechnicalAnalysis #Altcoins #CryptoSetup #BreakoutTrade
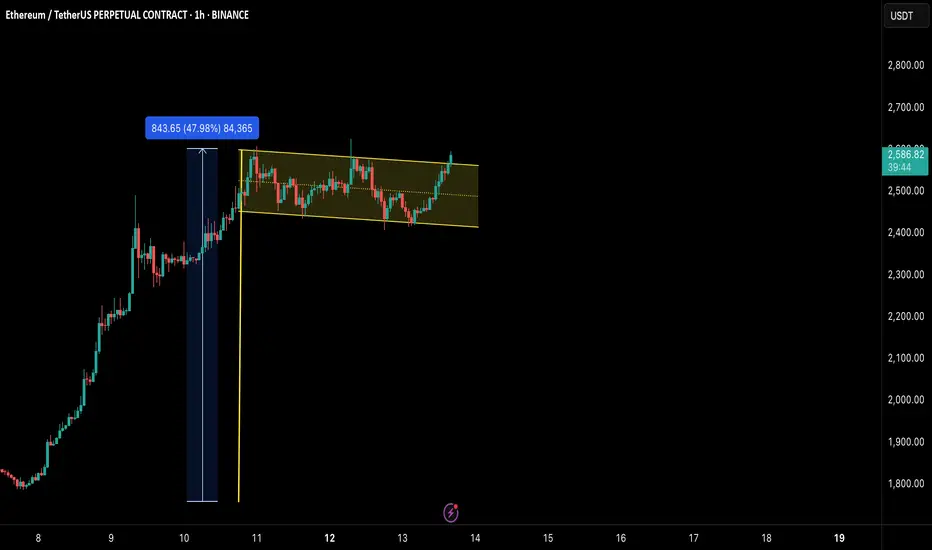
ETH/USDT: BULL FLAG BREAKOUT!!🚀 Hey Traders! 👋
If you’re finding value in this analysis, smash that 👍 and hit Follow for high-accuracy trade setups that actually deliver! 💹🔥
🔥 #ETHUSDT UPDATE – Ready for the Next Leg?
ETH surged nearly 48% recently and is now consolidating inside a clean parallel channel. After a healthy sideways move, price is starting to push the upper resistance again — a breakout from here could trigger the next rally phase! 🚀
🔸 Pattern: Bullish Flag/Parallel Channel
🔸 Current Structure: Post-pump consolidation
🔸 Watch for: Break above the upper yellow line for confirmation
🔸 Targets: $2,750 – $2,880+
🔸 Invalidation: Break below channel support and $2,430
📈 If bulls hold this zone, we could witness another explosive move! Keep it on your radar.
💬 What do you think? Is ETH gearing up for a breakout? Drop your thoughts below!
📌 Follow for more high-probability setups!
Is .21 cents the make or break for doge. Firstly doge coin is the worlds first functional meme coin way before Elon had ever took notice. Lots of traders are trapped in this trade for many years now. Eventually a recovery to .40 will occur to allow trapped traders to recoup this pos manipulated coin. I had high hopes for doge but Elon totally ruined this trade. You can exit this trade forever around .40 or pray a miracle drives it over $1.

EURCAD no3 view, bearish continuation still to expect
OANDA:EURCAD last two analysis on EURCAD doing, going good, will be attached, having now one more update and new view.
Price at end is break RAISING WEDGE and BEARISH FLAG, pushing strong bearish, strong volumem and momentum is gathered and still here having strong bearish expectations.
SUP zone: 1.57200
RES zone: 1.53000, 1.51600

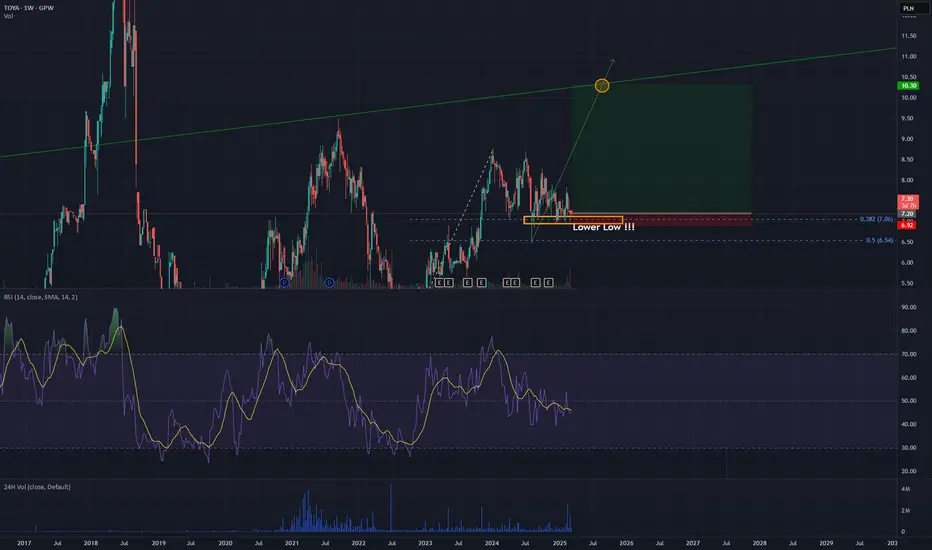
Toya LongLower low after double bottom with high volume, finally ready to fly on this one.
We did reach 0.5 Fibo with strong resistance in August and now 0.382 is resisting sellers for prolonged time.
We will go to higher band of the channel, while actually finalising a flag pattern.
We will enter 10.0 and then get a trailing stop, any pullback after reaching 10.0 is our take profit.
Getting below 7.0 invalidates the idea, because we have no lower low on resisting 0.382 then.
Bullish Flag pattern on NEIROETHUSDT forming on 12h time frameNEIRO/ETH is currently showing signs of a classic Bullish Flag pattern on the 12-hour timeframe, suggesting the potential for a continuation of the uptrend.
🔹 Pattern: Bullish Flag
🔹 Timeframe: 12H
🔹 Structure: Strong impulse move followed by a tight, downward-sloping consolidation channel
🔹 Breakout Potential: A breakout above the flag resistance could ignite the next bullish leg.
🎯 Trade Setup:
Entry: On confirmed breakout above flag resistance
Stop Loss: Around 0.06200 – below the flag’s support and key local structure
Take Profits: Based on the Fibonacci Extension levels from the previous impulse:
0.382 – First conservative target
0.618 – Mid-term target
1.000 – Full measured move of the flagpole
⚠️ Risk Management:
Always confirm the breakout with volume and candle structure before entering. Keep risk exposure within safe limits and consider scaling out profits at key Fibonacci levels.

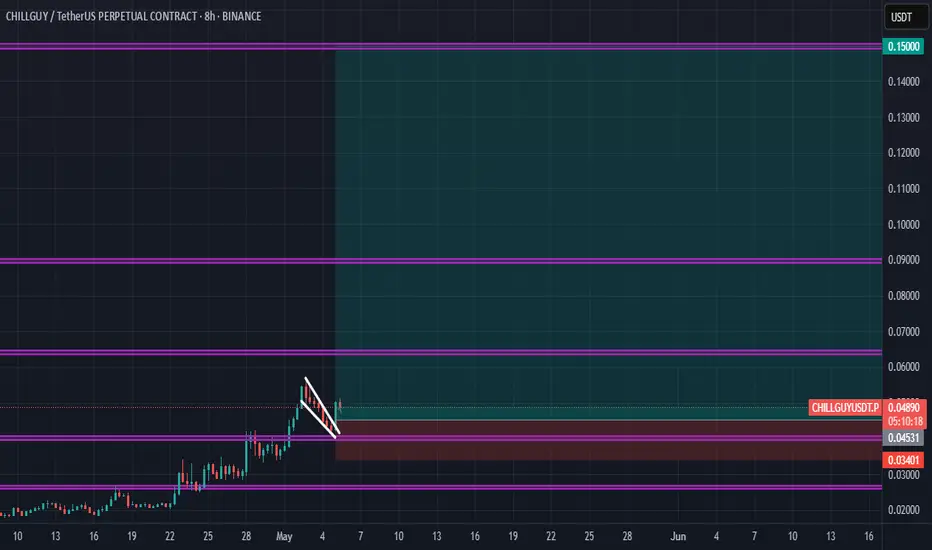
$CHILLGUY/USDT ready for a massive pump to $0.15BYBIT:CHILLGUYUSDT has been showing bullish signs, and is earing up for a big bullish push. Having broken and retested the $0.045 resistance zone, and also a break out rom the bullish flag formed. I believe we are about to see a huge rally up to $0.15 region, but then some resistance zones should not be overlooked as price usual bounce off from such support & resistance zones.
So prices is expected to push to;
TP1: $0.063
TP2: $0.09
TP3: $0.15
Expect minor retracements along the way.
Long-Term Analysis of SUII've used multiple timeframes — from 15-minute to 4-hour, 1-day, and 1-week charts — to create a comprehensive technical analysis. Based on my observations, there's a high probability that SUI is forming a “castle” structure (likely referring to a complex correction or distribution phase), but I don't expect it to reach the top of the previous high. The presence of large candles and significant gaps in the past suggests that the move was driven by momentum rather than sustainable trend, and such impulsive moves usually don't last long.
I've identified the key order blocks and marked the FVGs (Fair Value Gaps) for you. Elliott Wave structures are also drawn. I even placed a sample order for beginners or those who don't want to spend too much time analyzing.
In summary, we're currently in an Elliott Wave correction phase.
That's it for now — I’m tired and heading for my afternoon nap.
پ

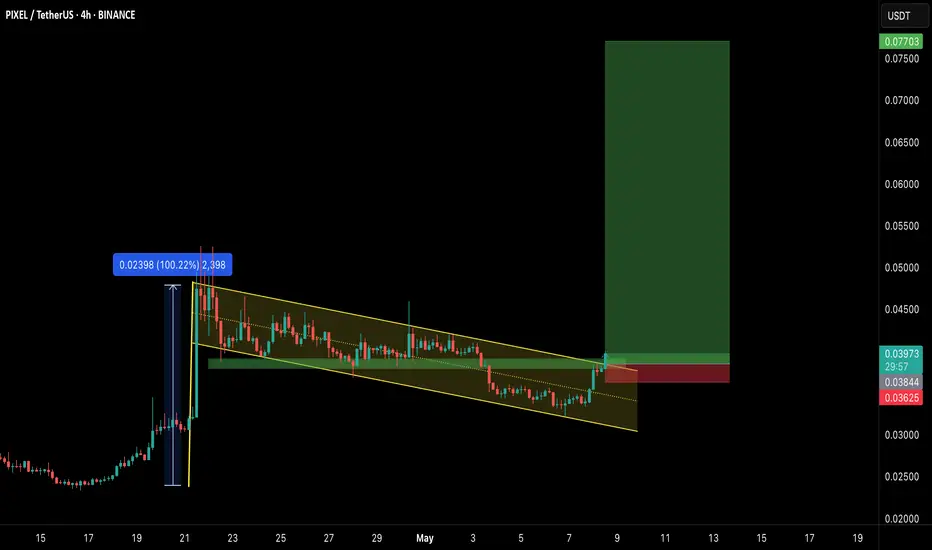
PIXEL Breakout Alert: Ready for the Next Leg Up?🚀 PIXEL Breakout Alert – 100% Potential Incoming?! 👀🔥
Hey Traders! If you're all about high-conviction plays and real alpha, smash that 👍 and tap Follow for more setups that actually deliver! 💹💯
PIXEL has broken out from a bull flag on the 4H timeframe after consolidating for weeks. This clean breakout signals a potential trend reversal with strong upside momentum building. 💥
Trade Setup:
👉 Entry: $0.0380–$0.0400 (post-breakout zone)
🎯 Targets:
$0.0455
$0.0520
$0.0630
$0.0770
🛡 Stop-loss: $0.0360 (below channel re-entry)
Why I Like It:
Clear breakout of the falling channel
Strong volume surge confirms momentum
Previous 100% move shows solid potential
If BTC stays stable, this one looks set for a strong run! 🚀 Keep it on your radar.

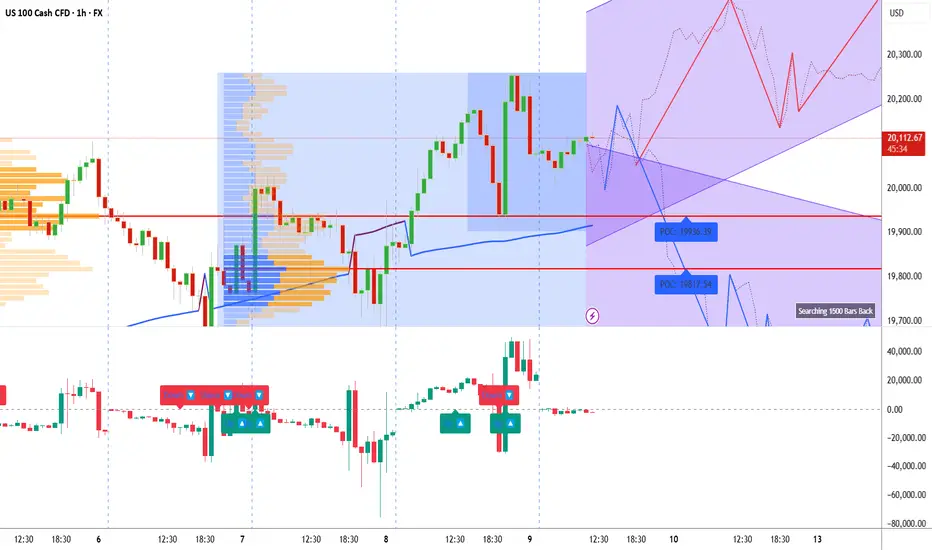
Technical Breakdown on US 100 | 1H TimeframeTechnical Breakdown on US100 Cash (NASDAQ CFD) – 1H Timeframe using Volume Profile, Gann, and CVD + ADX
1. Key Observations (Volume, Gann & CVD + ADX Focused)
a) Volume Profile Insights:
Value Area High (VAH): 19,964.8
Value Area Low (VAL): 19,799.3
Point of Control (POC): 19,936.4 (current session), 19,817.5 (previous session)
High-volume nodes: 19,850 – 19,950 (sustained consolidation and acceptance)
Low-volume gaps: 20,000 – 20,070 (inefficient move up; could act as a magnet on retrace)
b) Liquidity Zones:
Stop clusters likely at:
Above 20,125 (recent high and breakout level)
Below 19,800 (previous rejection and consolidation)
Absorption zones: Near 19,820–19,850, where strong wicks and CVD upticks indicated passive buyers stepping in
c) Volume-Based Swing Highs/Lows:
Swing High: 20,125.8 (sharp rejection, low follow-through volume)
Swing Low: 19,713.4 (high absorption, spike in CVD)
d) CVD + ADX Indicator Analysis:
Trend Direction: Bullish (CVD rising, price confirming higher highs)
ADX Strength: ADX ~22, DI+ > DI- → Confirmed uptrend
CVD Confirmation:
Rising CVD + rising price = strong demand
Momentum stalling near 20,125, signaling potential short-term pullback
2. Support & Resistance Levels
a) Volume-Based Levels:
Support:
VAL: 19,799.3
POC: 19,936.4
Swing low: 19,713.4
Resistance:
VAH: 19,964.8
Swing high: 20,125.8
b) Gann-Based Levels:
Recent swing low: 19,713.4
Retracement levels (from 20,125.8 high to 19,713.4 low):
1/3: 19,850.9
1/2: 19,919.6
2/3: 19,988.3
3. Chart Patterns & Market Structure
a) Trend: Bullish (ADX > 20 with CVD and price agreement)
b) Notable Patterns:
Bullish channel breakout forming
Retest of 19,936 POC aligning with previous breakout level
Potential continuation pattern (ascending wedge forming within purple projection channel)
4. Trade Setup & Risk Management
a) Bullish Entry (CVD + ADX confirm uptrend):
Entry Zone: 19,925 – 19,940 (POC + Gann midpoint)
Targets:
T1: 20,070 (gap fill)
T2: 20,125 (recent high)
Stop-Loss (SL): Below 19,799 (VAL / swing low)
RR: Minimum 1:2
b) Bearish Entry (If rejection near swing high + falling CVD):
Entry Zone: 20,120 – 20,125
Target:
T1: 19,936 (POC)
Stop-Loss (SL): Above 20,150
RR: Minimum 1:2
c) Position Sizing:
Risk only 1-2% of capital per trade
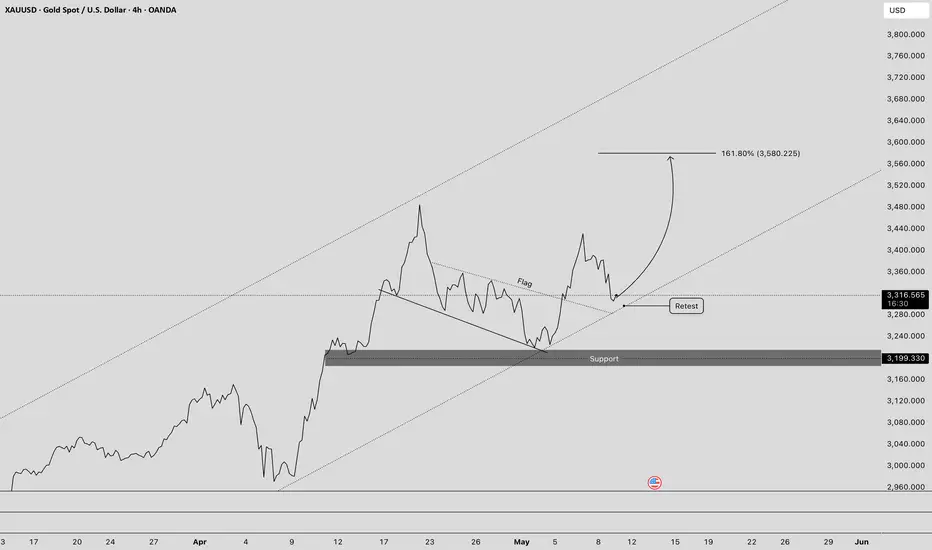
Bullish Airlines Cleared for Altitude!After squinting at the 4H chart like Sherlock with a caffeine addiction, I’ve confirmed: our price broke out of a flag pattern like it was tired of napping. It even did the polite thing—came back to retest—like, “Excuse me, just checking if I actually broke out. Yep. Cool.”
Now it’s back on its bullish treadmill, charging uphill like a gym bro after pre-workout.
As long as we’re above 3200, this beast might just pump harder than Bitcoin on caffeine and hopium.
🎯 Final destination? 161.80% Fib extension at 3580.22—aka “Mount Take Profit.”
Pack snacks. It’s a climb.