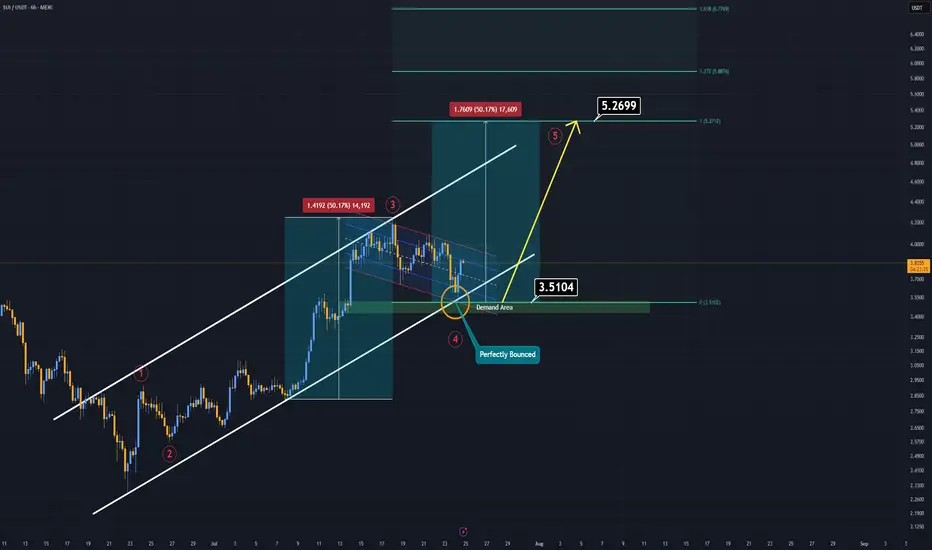
SUI Analysis (6H)If you're on the hunt for extreme risks and potentially high rewards — SUI might be calling your name.
Currently, SUI is trending within a well-respected ascending channel, and just today, it tapped both the demand zone and the lower boundary of this channel.
That’s what we call a double support, and it often signals a strong potential bounce.
SUI now appears to be forming a bullish flag pattern. If this formation breaks to the upside, it could trigger the fifth impulsive wave in line with Elliott Wave Theory.
In such a case, the main target is projected around $5.00–$5.20.
Extreme setups demand extreme conviction.
Good luck.
Flag
Spot Ether ETFs Log $453M in Inflows, Extend Streak to 16 DaysThe momentum behind Ethereum continues to build as spot Ether exchange-traded funds (ETFs) in the United States and abroad recorded another impressive influx of capital, attracting $453 million in net inflows over the past week. This marks the 16th consecutive day of inflows, underscoring a growing institutional appetite for the second-largest cryptocurrency by market capitalization.
While Bitcoin has long dominated the digital asset ETF landscape, Ether is increasingly capturing the attention of sophisticated investors. Analysts attribute the sustained interest to a combination of macroeconomic factors, evolving regulatory clarity, and Ethereum’s unique position within the decentralized finance (DeFi) ecosystem.
Institutional Endorsement Grows
Several major asset managers, including BlackRock and Fidelity, have reported increased client demand for Ether exposure in recent months. According to data compiled by Bloomberg, the $453 million inflow in Ether ETFs this week is the largest since the products launched, bringing total assets under management (AUM) across major Ether funds to $3.2 billion.
“These consistent inflows are a clear sign that Ether is becoming institutional-grade,” said Mira Taylor, head of digital asset research at Keystone Capital. “It reflects a shift in how the market perceives Ethereum—not just as a tech platform, but as a core financial infrastructure.”
This shift comes amid Ethereum’s continued progress toward scalability, including its transition to proof-of-stake (PoS) and the implementation of Layer-2 scaling solutions such as Optimism and Arbitrum. These upgrades improve network efficiency and reduce gas fees, making Ethereum more attractive for enterprise-level use cases.
Regulatory Developments Provide Tailwind
The surge in investor confidence is also linked to increasing regulatory clarity. The SEC’s tacit approval of spot Ether ETFs in key jurisdictions, including the United States and Europe, has provided the legitimacy many institutions required before allocating capital.
Moreover, Ethereum’s perceived decentralization and utility have helped it avoid the same level of scrutiny that other altcoins have faced. While Ripple’s XRP and Solana remain entangled in legal ambiguities, Ethereum benefits from its early position as a non-security in the eyes of regulators.
Market Outlook
Despite recent volatility in the broader crypto markets, Ethereum has shown resilience. ETH is currently trading around $3,550, up nearly 12% month-over-month. Analysts suggest the inflows into spot Ether ETFs could act as a support mechanism for price, dampening downside volatility.
“ETF inflows often act as a price stabilizer, particularly in a risk-on environment,” said Noah Wexler, macro strategist at Apollo Digital. “If inflows persist, Ethereum could revisit the $4,000 level by Q4.”
Investors and analysts alike will be watching closely to see whether the inflow streak continues into a 17th day. Regardless of short-term price action, the structural trend appears clear: Ethereum is solidifying its role as an investable, institutional-grade asset.

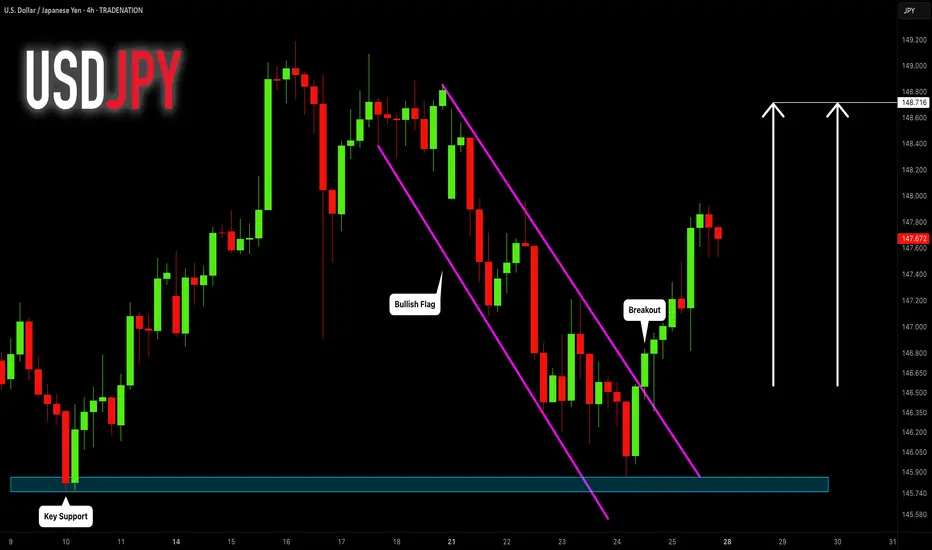
USDJPY: Bullish Move From Support Ahead! 🇺🇸🇯🇵
I think that there is a high chance that USDJPY will continue growing
next week.
A bullish breakout of a resistance line of a flag pattern that occurred
after a test of a key support provides a strong bullish signal.
Goal - 148.7
❤️Please, support my work with like, thank you!❤️
I am part of Trade Nation's Influencer program and receive a monthly fee for using their TradingView charts in my analysis.
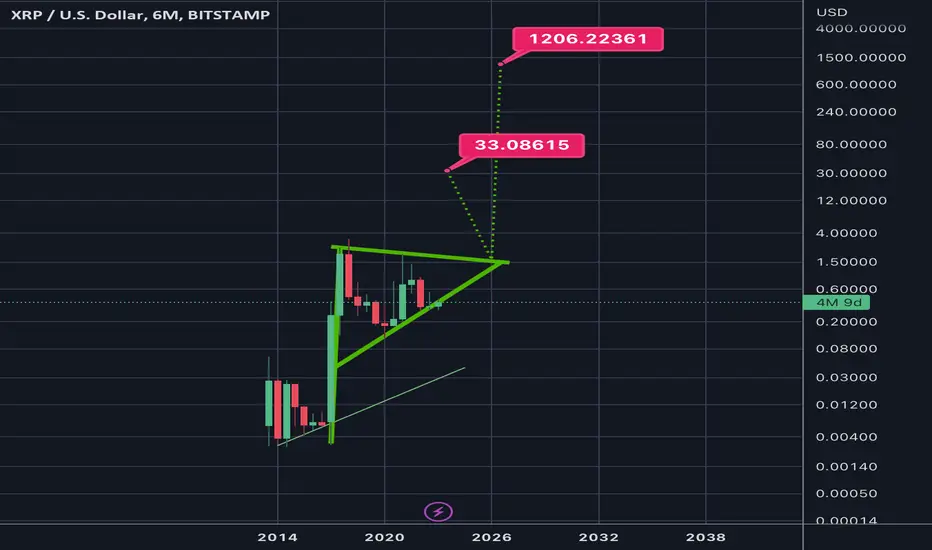
6month log chart on xrpusd suggests crazy potential targetsThe bull pennant we are in shown here on the 6month time frame seems to have a symmetrical triangle for its flag. The breakout target for just the symmetrical triangle is in the $33 range. Factor in the pole of the flag and the potential target skyrockets to 1.2k. Definitely not financial advice and certainly no guarantee it will hit either target as it’s still up in the air if log chart targets reach their full target as reliably as linear chart patterns do. Even if it does hit these targets you can see the apex of the pennant in its current trendline trajectories doesn’t occur until 2026. The only way I see price remaining inside this triangle for that long is indeed if the SEC ripple case is extended through appeal and taken to the Supreme Court. Hopefully not but it isnt impossible. If this were to occur I would simply keep dollar cost average accumulating until it was to break out from the triangle which would give me more opportunity to take some profit at the first target but then also hold onto some of the asset in case it does indeed reach the full bullflag breakout somehow all the way up at 1.2k. Simply posting this hear so I can see how well price action chooses to follow this pattern over the next year or few. Once again *not financial advice*
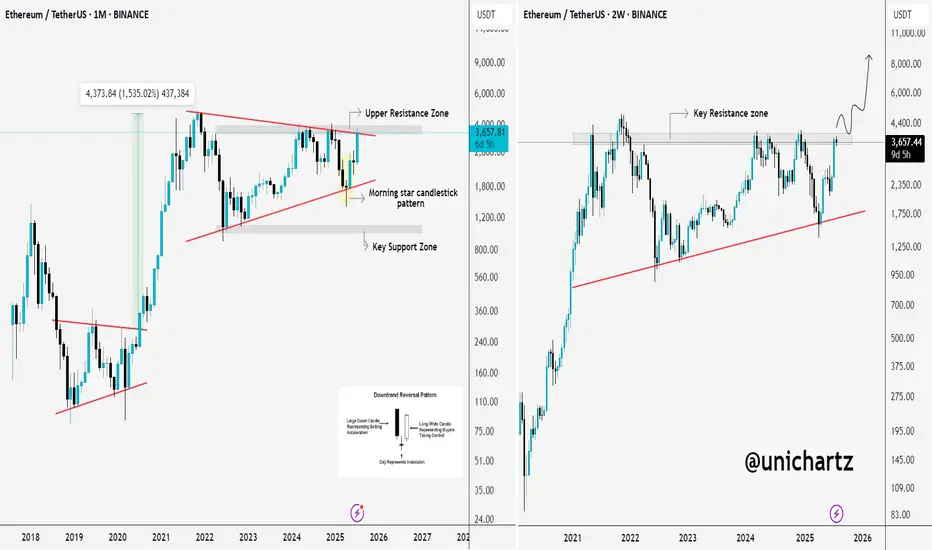
Ethereum Charts Aligning for a Major BreakoutI analyzed Ethereum on both the monthly and 2-week timeframes, and the structure looks strong.
On the right side, we have the monthly chart, where ETH has printed a bullish Morning Star pattern right off the key support trendline.
This is a classic reversal signal, and price is now approaching the upper resistance zone. A breakout from here could trigger a major rally, similar to what we saw in 2020.
On the left side, the 2-week chart shows CRYPTOCAP:ETH pressing into a critical resistance zone after a strong bounce. If price breaks and holds above this zone, it could open the doors to $6K–$8K targets in the coming months.
ETH is showing strength, now we wait for confirmation from the breakout.
Thanks for reading!
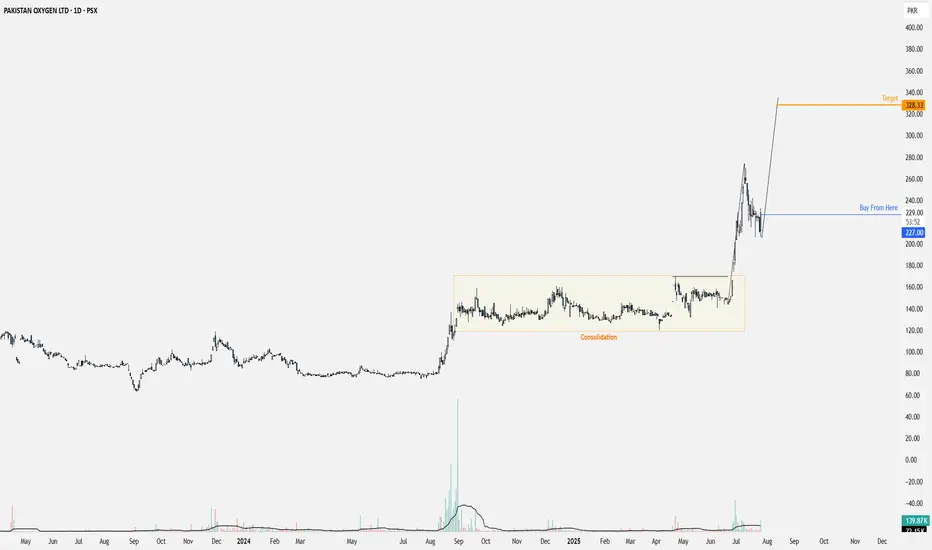
PAKOXY is forming ABCD PatternAfter the longest consolidation, PAKOXY has given a breakout and is now forming an ABCD Pattern.
Handsome ROI.
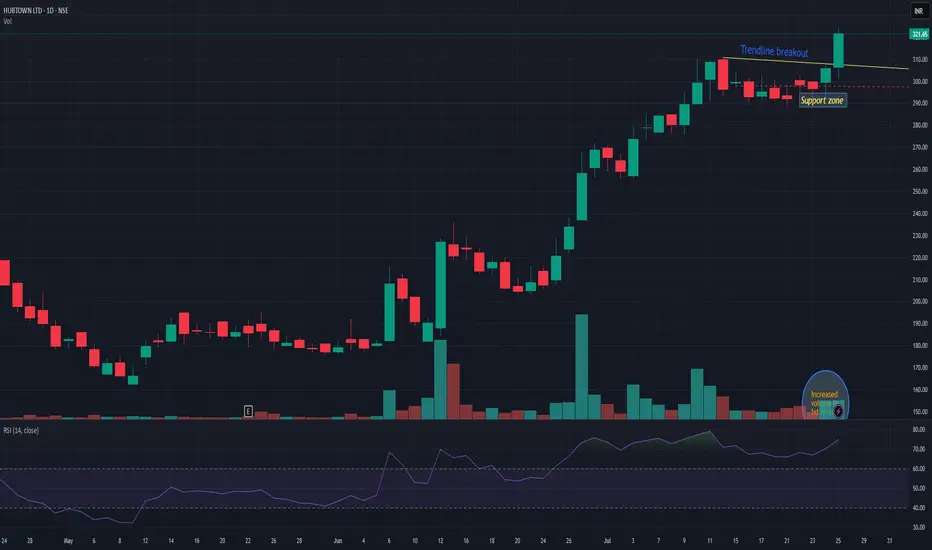
HUBTOWNHUBTOWN giving trendline breakout with decent volumes. Support can be seen near 301-2 level. On upper side resistance may be nr 342-365. Stock has given around 80% return in last 1.5 months. So strong momentum is observed. Keep it on radar
NovoCure Limited (NVCR) to rally 100% ??** short term forecast, days and weeks ahead **
On the above 10 day chart price action has crashed 95% since support failed. Today sellers are trying to push that correction to 100%, are they right?
Unlikely.
1) Price action (not visible on LOG) and RSI resistance breakouts.
2) Support on past resistance confirms.
3) Trend reversal. Higher lows print.
4) Bull flag confirmation forecasting a 100% move to mid 30’s.
Is it possible price action corrects further? Sure.
Is it probable? No.
Ww
Type: trade
Risk: you decide
Timeframe for long: Yesterday
Return: 100%
Stop loss: Will say elsewhere

Is this a Bull Flag forming on the XRP daily timeframe?Although sentiment for XRP is strong and recent trend has been sharply upwards. I'm wondering if this is a bear flag forming on the daily?
Given the sharp rise it could be and may not be a negative signal as it could give the opportunity for a healthy pull back before rising again to new all time highs.
Let's watch how it progresses over the next few days. I will not be jumping into a trade until it confirms.

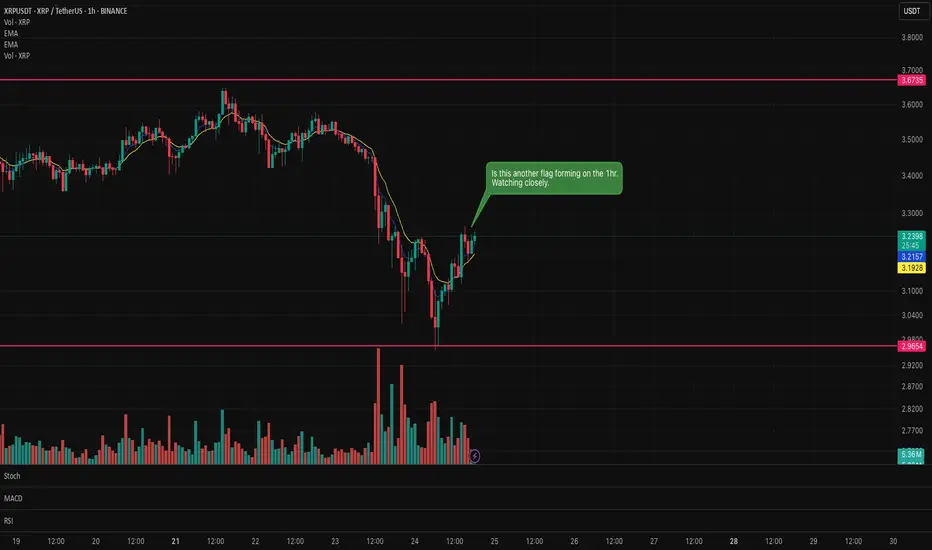
Is there another XRP flag forming on the hourly chart?Could be another flag forming on XRP. Waiting for the formation to prove confirmation as to whether it will be a bull or bear flag.
News of large amounts of XRP entering the exchanges from the CEO could mean a bear flag?
It's only appearing on the hourly so it could be a false flag.
Let's what and see what forms on the hourly candle.
Continuation flag ?Looks like a continuation flag, thoughts?
ETH is in a pullback, BTC didnt have one,
looks like a strong bullish flag

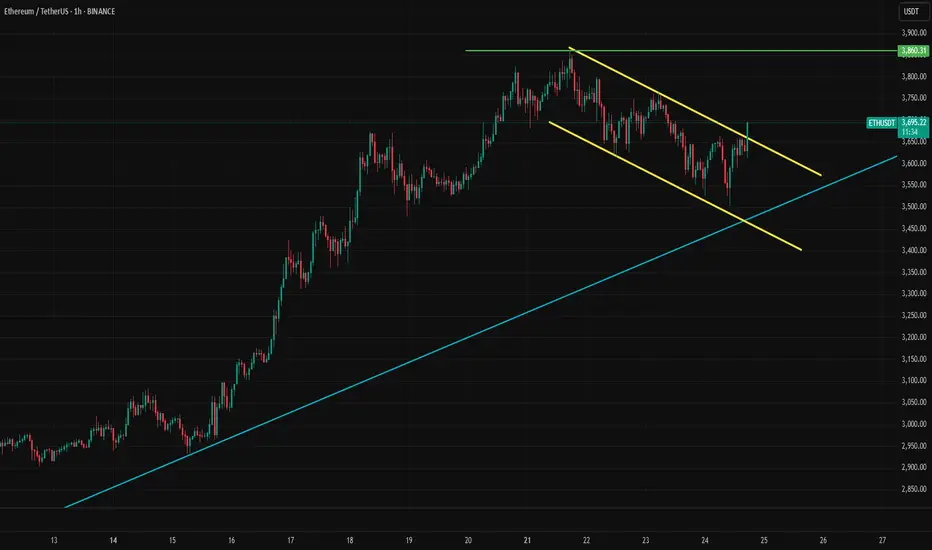
Ether is About to Break the FlagETH is making an attept to break flag formation. 3860 top could be the short term target for upward moves. Over the medium term, 4100 could be the main target. Our bull cycle top target is 6830 for the moment. This was a quick update,please check our earlier post for details.
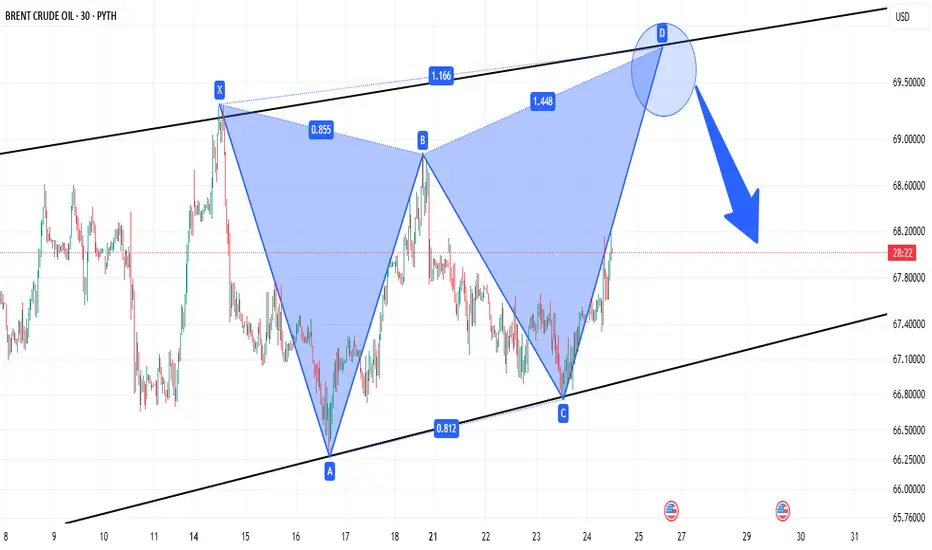
RANGING OIL PRICE HEADING FOR RESISTANCE.Price has been stuck in consolidation mode
Currently heading for resistance levels where we expect a decline
Backed-up by a bearish harmonic pattern
and a bear flag clearly visible on the 4HR time interval
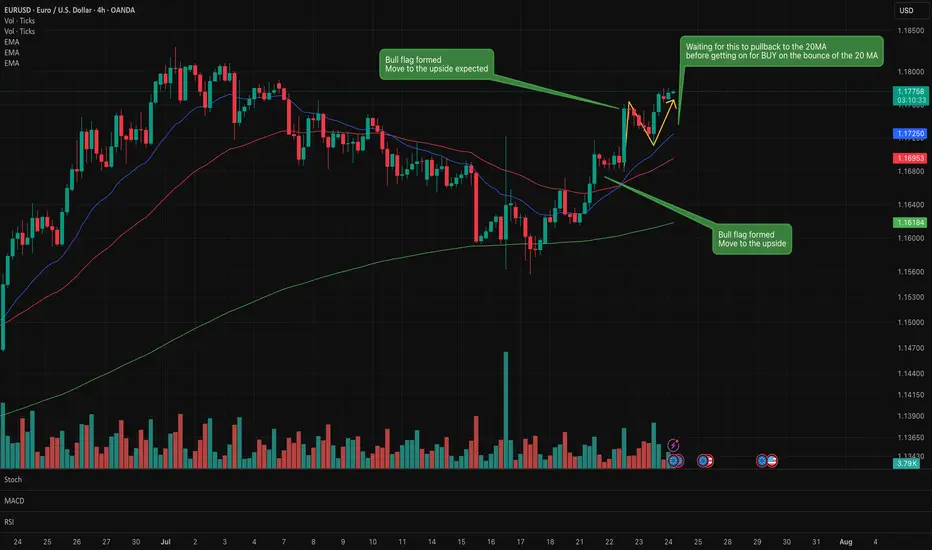
EUR/USD Lots of bull flags formed on the recent chart. Buy/Long Lots of bull flags on this chart which confirmed a move to the upside.
Waiting for a little pullback to the 20MA before considering a buy long order
Waiting to see if this small bear flag forms.
A very interesting instrument to watch at the moment. Full of various signals.
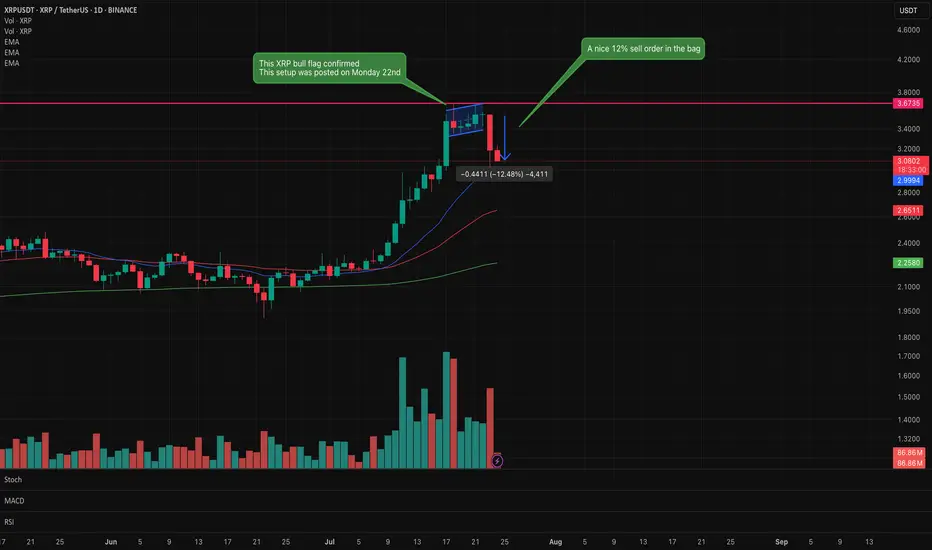
XRP Bear flag confirmed. Looking for support in the decline.XRP bear flag identified on Monday 22nd has now confirmed with a nice 12% short sell.
This signals do not always confirm but when they do it is satisfying that the analysis and patience has paid off.
Trading is all about controlling emotions and being patient. Wait for the confirmation before executing.
2025 YTD Consolidation Hop-Out with Conviction - Metallicus $XPRCRYPTO:XPRUSD : You need to look back to 2021-2022 to see $XPR at these price levels to estimate resistance ranges: $0.0075, $0.008, and $0.01 but without good volume metrics it's difficult to substantiate other than using price alone.
But this YTD pennant/triangle's consolidation "hop-out" with conviction suggests, using the flagpole, a price target of $0.01, which is deemed conservative compared to bullish estimates (per @Grok : digitalcoinprice.com).
NASDAQ:LOAN is on its own trajectory, behaving with higher gamma than $XPR this year.

Bull Flag on BTCDecent sell-off today has been bought up nicely, my bullish thesis of
BTC and US equities remain.
- Bull Flag pattern forming on the daily
- Holding the 117k Support/FVG nicely
- Expecting some continued range-bound PA before the next leg-up begins

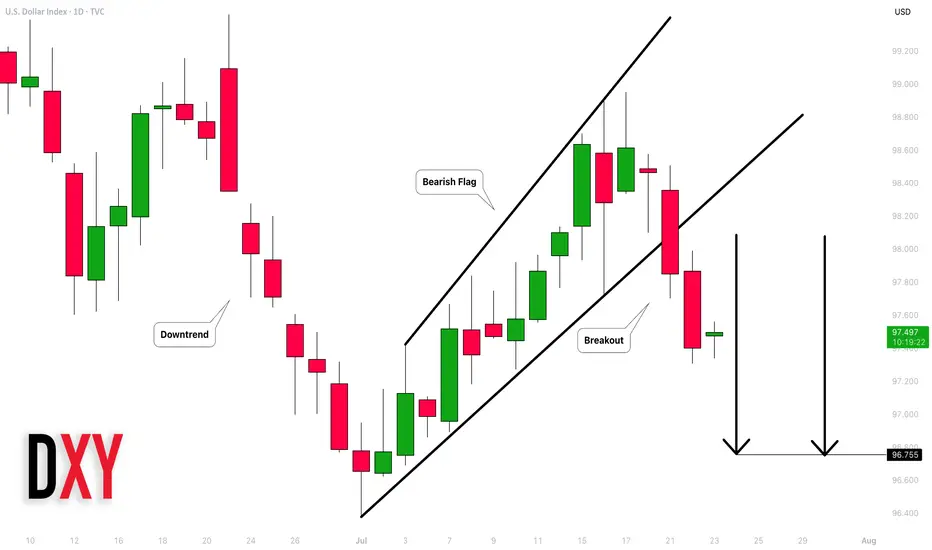
Dollar Index (DXY): Strong Bearish Price Action
Dollar Index broke and closed below a support line
of a bullish flag pattern on a daily.
Because the market is trading in a bearish trend,
this violation provides a strong bearish signal.
I expect a bearish movement to 96.75
❤️Please, support my work with like, thank you!❤️
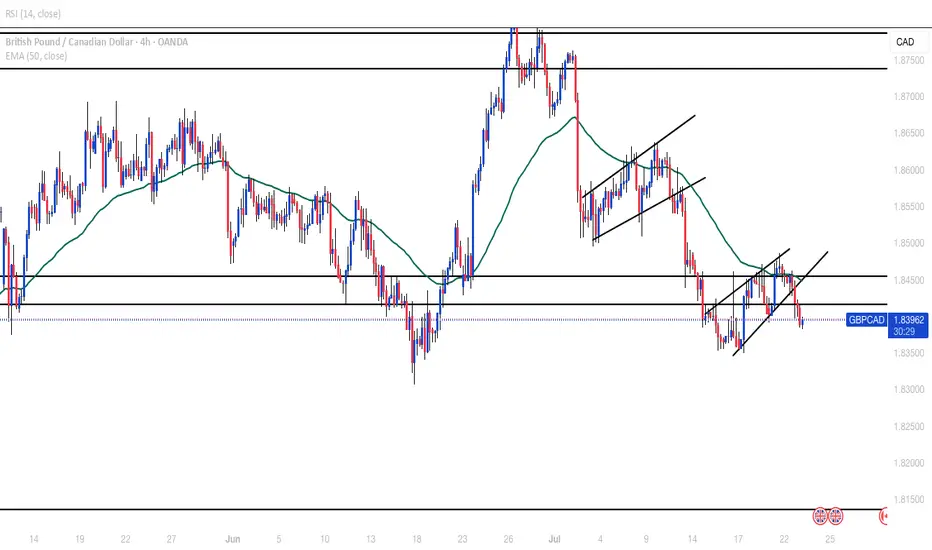
GBPCAD SELLSH4 double top with broken neckline at a strong daily zone, bearish flag was also formed. Looking at next daily support around 1.81500
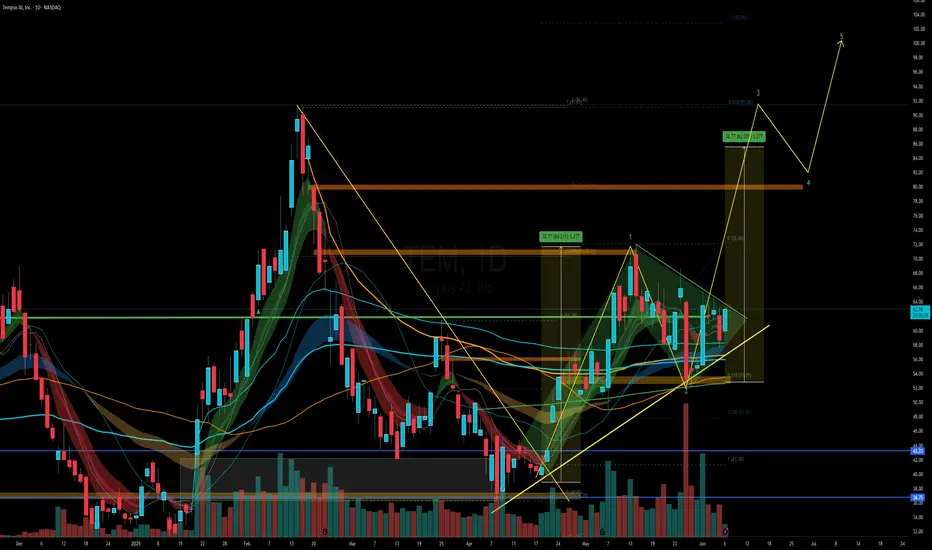
TEM - what do you see ?I love this stock, so much momentum and good follow through.
I see it's ready for a strong rally. I've huge position via shares and Aug calls
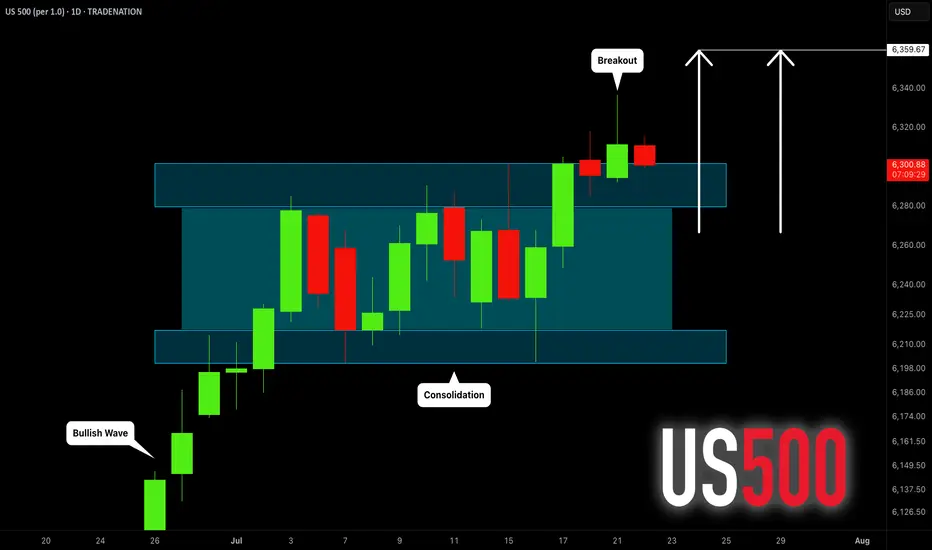
S&P500 INDEX (US500): Bullish Trend Continues
US500 updated a higher high this week, breaking a resistance
of a bullish flag pattern on a daily time frame.
I think that the market will rise even more.
Next goal for the bulls - 6359
❤️Please, support my work with like, thank you!❤️
I am part of Trade Nation's Influencer program and receive a monthly fee for using their TradingView charts in my analysis.
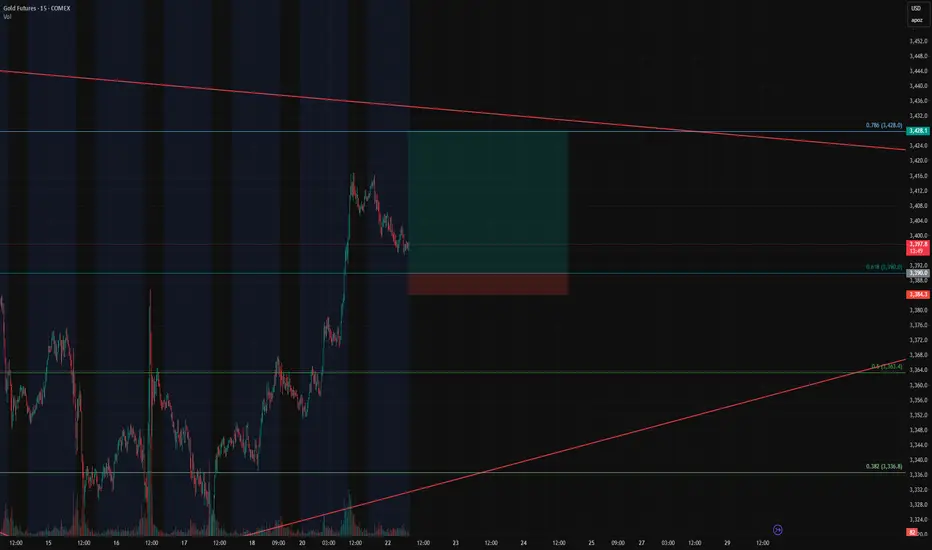
Gold Futures Long Setup – Breakout Continuation off the 0.618 FiGold Futures Long Setup – Breakout Continuation off the 0.618 Fib
Instrument: Gold Futures – COMEX ( COMEX:GC1! )
Timeframe: 15-Minute
Trade Type: Long – Breakout Continuation
Entry Zone: 3390 (0.618 Fibonacci retracement)
Take Profit: 3428 (0.786 Fib)
Stop Loss: 3384
Risk/Reward Ratio: 6.68
Setup: Bullish Flag on Retest
🔍 Trade Thesis
This trade is part of an ongoing breakout continuation strategy we've been trading, and now we're eyeing a pullback entry as price returns to a key retracement level.
Price nearly exploded through the 0.618 Fibonacci level (3390) during the prior breakout.
Now it's pulling back in a textbook bullish flag formation, suggesting healthy consolidation before the next leg.
The 0.618 retracement is aligning with previous intraday structure and trendline support — making this an ideal level to scale in.
This is a high R:R continuation play, with targets set at the 0.786 Fib level (3428) — right before macro resistance kicks in.
🎯 Entry & Exit Strategy
Entry: As price touches 3390 or forms bullish confirmation at the level.
Stop Loss: 3384 – tight and below key fib/flag structure.
Target: 3428 – based on 0.786 Fib extension and breakout continuation projection.
📊 Why This Works
Breakout behavior: Price respected the breakout impulse and retraced cleanly into a bull flag.
Fib confluence: 0.618 pullbacks are a classic entry in trending markets.
R/R of 6.68: Excellent reward profile vs. limited risk.
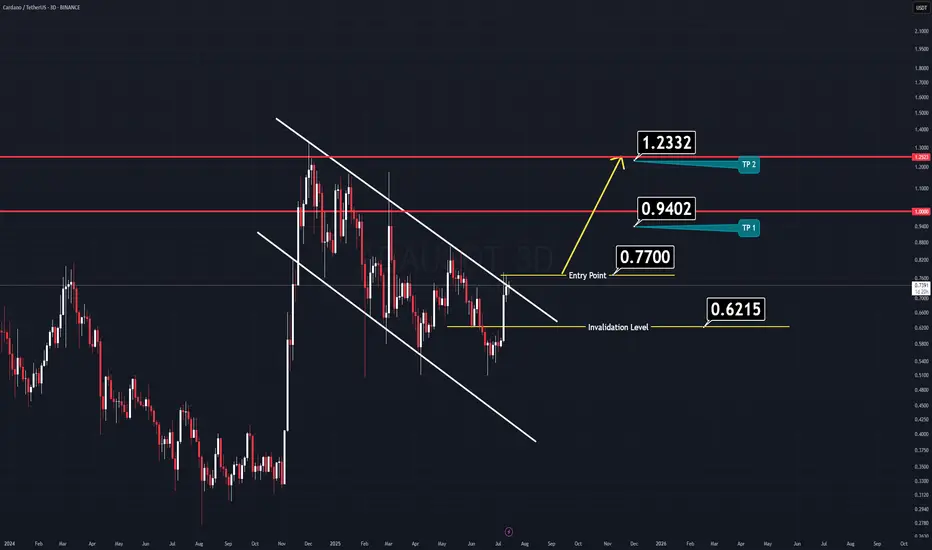
ADA Analysis (3D)Here’s another clean and straightforward chart, this time on Cardano (ADA).
ADA has formed a large flag pattern, which looks poised for a breakout soon.
Just like the previous setup, nothing complicated here.
✅ Entry Idea:
Consider entering when the price breaks above the previous daily candle’s high.
All the key levels are already marked on the chart for easy reference.
Keep it simple,
Good Luck.