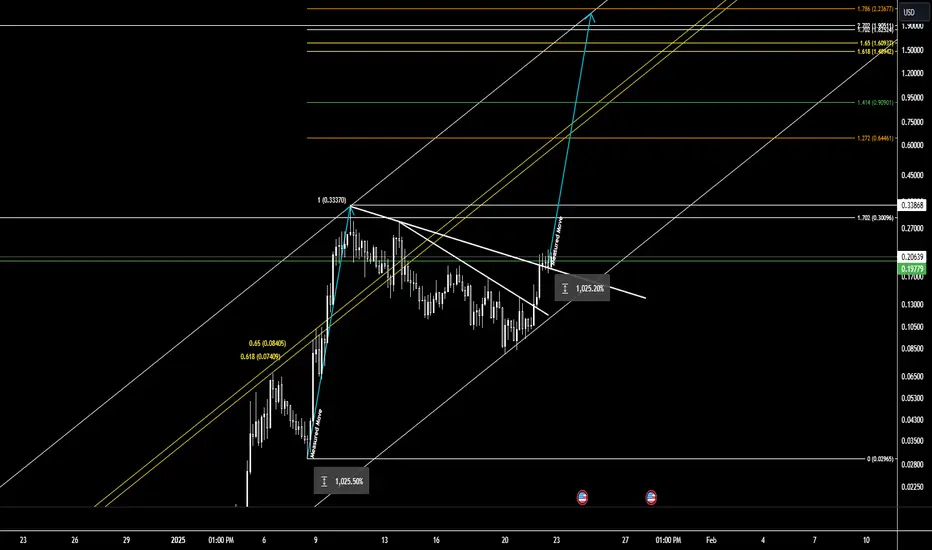
ADA breaking up from bullflag/handle targets= 1.88 & 2.40Unless this is some sort of strange bull trap. The recent declaration o Trump’s Truth Social page that he will be including ADA in the Strategic reserve has resulting in a major pump for cardano here which will likely confirm the breakout of both this bull flag its currently above and the cup and handle it’s about to be above (yellow line) *not financial advice*
Flag

$UPS - strong come back plus gap fill on the wayUPS - stock coming back strong after earnings gap down. Stock is currently in the gap to $132. Looking for calls above $120.50 for move towards $128 and $132. Stock is decent on indicators. On high watch.

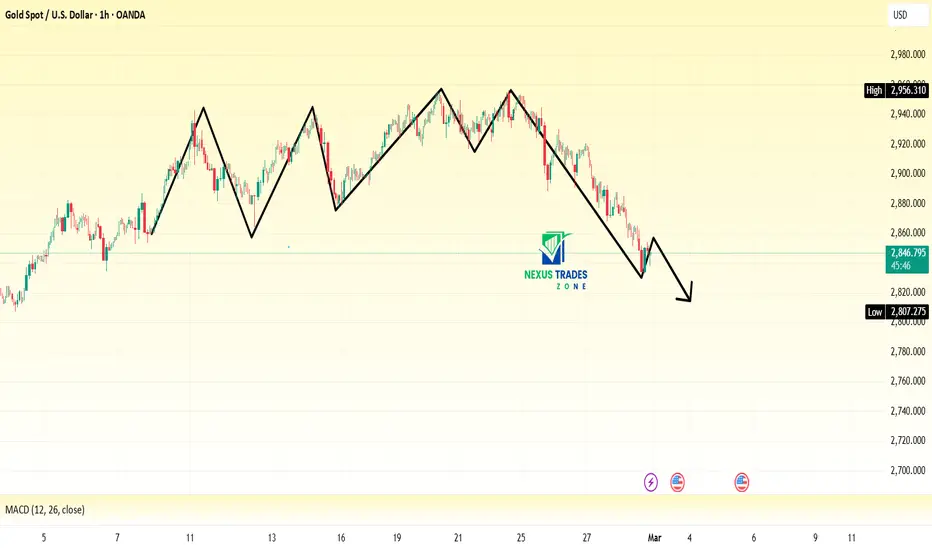
GOLD | Bearish Reversal Pattern – More Downside Ahead?### **Analysis & Description:**
This is a **1-hour chart of XAU/USD (Gold vs. U.S. Dollar)** from TradingView, highlighting a **bearish trend reversal pattern**. The price action forms a series of **lower highs and lower lows**, indicating a clear **downtrend formation**.
#### **Key Observations:**
1. **Lower Highs & Lower Lows:**
- The chart outlines a classic **bearish market structure** with multiple rejection points.
- Each bullish rally is met with strong selling pressure, leading to a downward continuation.
2. **Momentum Weakness (MACD Indicator):**
- The MACD at the bottom indicates **bearish momentum**, with both the MACD line and Signal line in negative territory.
- This suggests that selling pressure dominates and further downside movement is likely.
3. **Price Projection:**
- The final arrow suggests **further downside movement**, possibly breaking below key support zones.
- If price breaks below the **$2,807 support**, it could accelerate selling toward **$2,780 – $2,750 zones**.
4. **Possible Trading Strategy:**
- **Bearish Confirmation:** Traders should watch for a breakdown below **$2,807** for a short-selling opportunity.
- **Bullish Reversal?:** If price forms a strong support at **$2,807**, we may see a bounce before further downside.
### **Conclusion:**
Gold is currently in a **short-term downtrend**, and traders should be cautious of potential bearish continuation. However, **fundamental news events** could also impact price action, so it's essential to monitor economic data and market sentiment.
#### **Key Levels to Watch:**
- **Support:** $2,807 – $2,780
- **Resistance:** $2,846 – $2,880
📉 **What do you think? Will gold continue to drop, or will we see a reversal soon? Drop your thoughts below!** 🚀
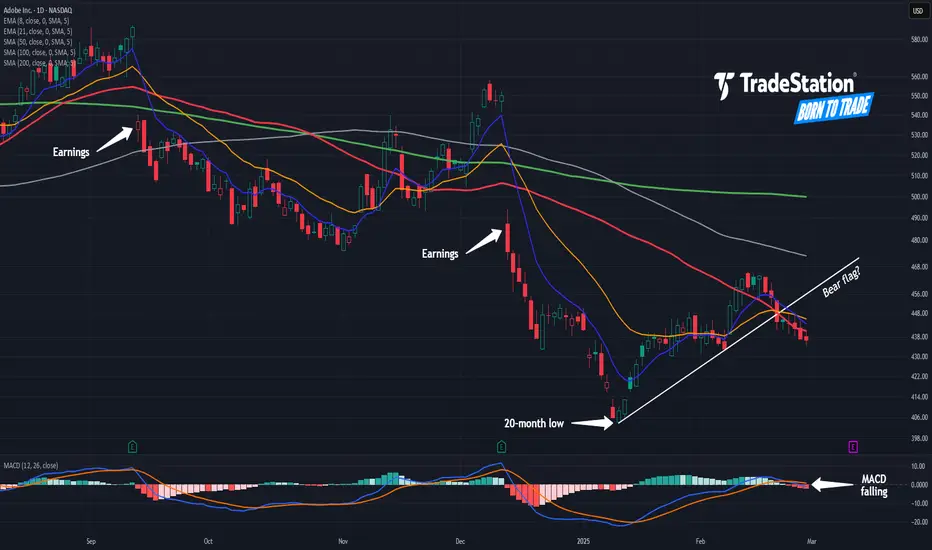
Bear Flag in Adobe?Adobe trended lower most of 2024, and now some traders may expect another push to the downside.
The first pattern on today’s chart is the series of higher lows since mid-January. The software company recently slid below that line, which may be viewed as a bear flag breakdown.
Second, bearish gaps after the last two earnings reports could reflect weak sentiment.
Third, ADBE has been unable to get above its falling 50-day simple moving average (SMA). That may indicate a negative intermediate-term trend.
Also notice how the 50-day SMA is under the 100-day SMA and both are below the 200-day SMA. That configuration, with faster SMAs below slower ones, may indicate a negative long-term trend.
Next, the 8-day exponential moving average (EMA) just crossed below the 21-day EMA. MACD is falling as well. Those patterns may be consistent with bearishness in the short term.
TradeStation has, for decades, advanced the trading industry, providing access to stocks, options and futures. If you're born to trade, we could be for you. See our Overview for more.
Past performance, whether actual or indicated by historical tests of strategies, is no guarantee of future performance or success. There is a possibility that you may sustain a loss equal to or greater than your entire investment regardless of which asset class you trade (equities, options or futures); therefore, you should not invest or risk money that you cannot afford to lose. Online trading is not suitable for all investors. View the document titled Characteristics and Risks of Standardized Options at www.TradeStation.com . Before trading any asset class, customers must read the relevant risk disclosure statements on www.TradeStation.com . System access and trade placement and execution may be delayed or fail due to market volatility and volume, quote delays, system and software errors, Internet traffic, outages and other factors.
Securities and futures trading is offered to self-directed customers by TradeStation Securities, Inc., a broker-dealer registered with the Securities and Exchange Commission and a futures commission merchant licensed with the Commodity Futures Trading Commission). TradeStation Securities is a member of the Financial Industry Regulatory Authority, the National Futures Association, and a number of exchanges.
TradeStation Securities, Inc. and TradeStation Technologies, Inc. are each wholly owned subsidiaries of TradeStation Group, Inc., both operating, and providing products and services, under the TradeStation brand and trademark. When applying for, or purchasing, accounts, subscriptions, products and services, it is important that you know which company you will be dealing with. Visit www.TradeStation.com for further important information explaining what this means.
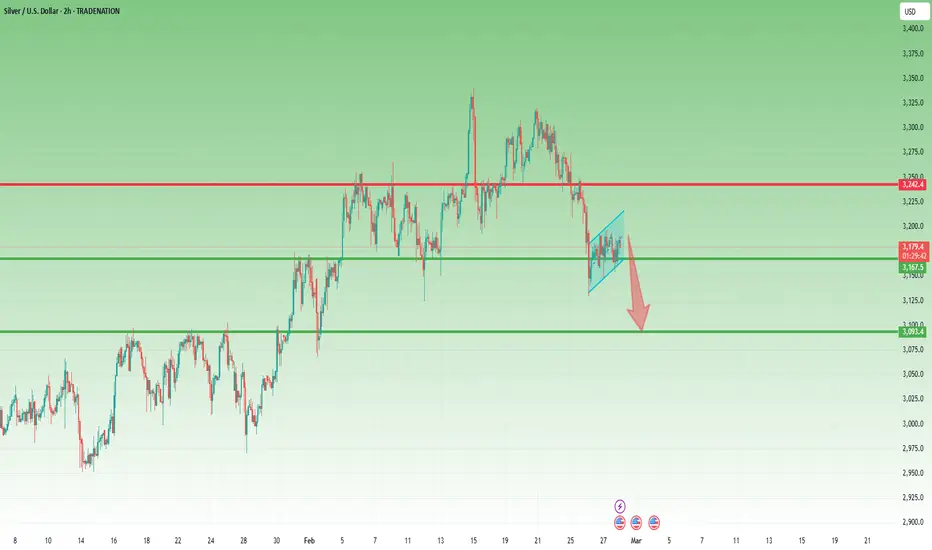
Silver’s Price Action Hints at Further Decline After reaching a high in mid-February, Silver formed a lower high on the 25th, even as Gold hit a new all-time high.
Following the recent decline in both metals, this pattern repeated itself—Silver did not make a new low, whereas Gold did, but found support in a key zone.
However, analyzing the price structure, Silver’s chart remains bearish. In recent trading hours, a small flag continuation pattern has formed, signaling potential further downside.
Given this setup, I expect Silver to break the pattern and continue its decline, with 31 as the next key support level.
Disclosure: I am part of Trade Nation's Influencer program and receive a monthly fee for using their TradingView charts in my analyses and educational articles.
A big move is brewing on this AI CoinAI the hypest narrative in the space today.
This coin has an interesting use case.
But most of all, the market cap is low enough for it to rip up.
The chart looks extremely bullish.
And perpetual funding rates keep oscillating into negative territory, possible due to large amounts of shorts piling in - meaning, a short squeeze is inevitable.
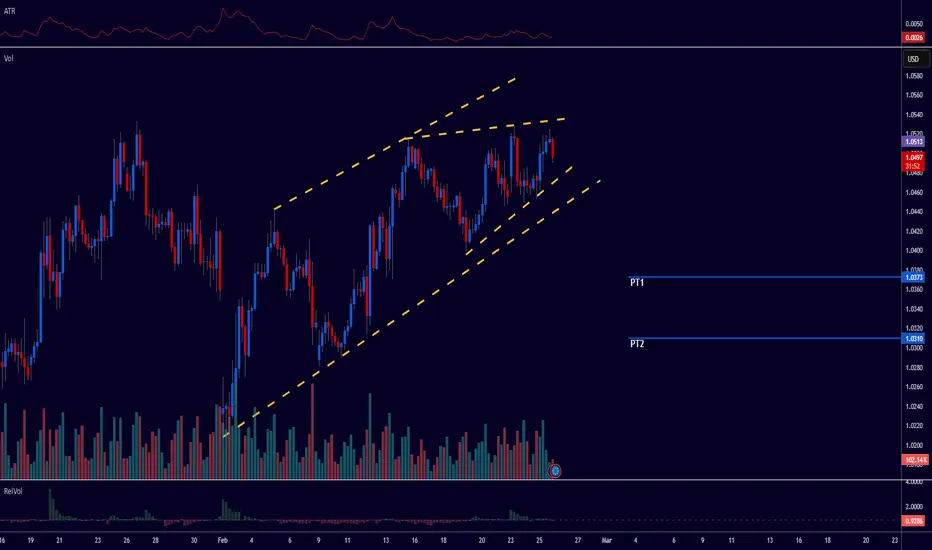
bearish swingsimple TA. bear flag, rising wedge within flag, calculating move via pattern range and key support levels. Price targets posted on chart.
side note, ATR ready for a move, volume showing some decent reliability at previous reversal.
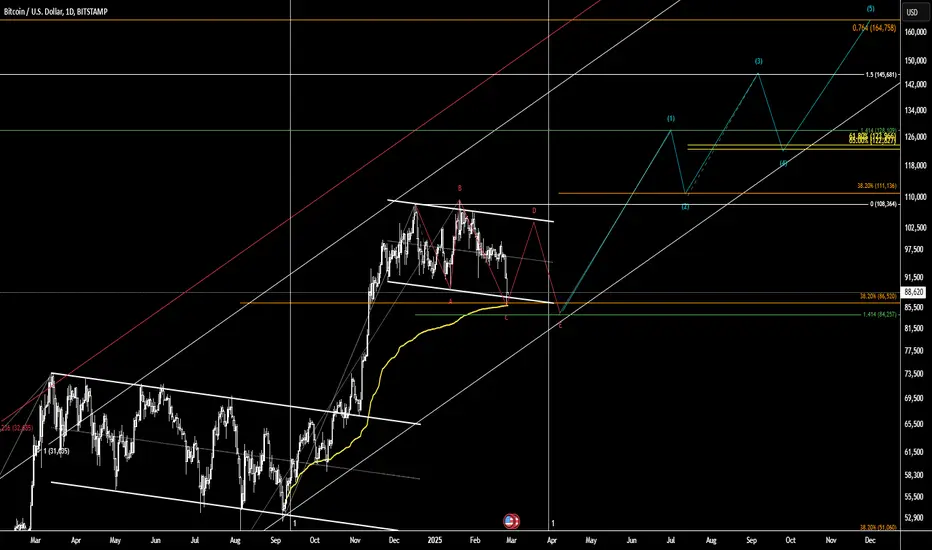
What's next for Bitcoin? Chop into end of March, then 165kI believe we are in the last leg of the cycle here.
I expect another sideways chop to form a bull flag pattern into end of march, then a 3 wave move up to tap 164-165k before entering a 12month + bear market.
Fear is at an all time high, alt coin traders are completely obliterated (I have been through it too, a lot of my previous attempts to call bottoms on some coins were invalidated due to a weaking broader market), however, I believe many alts now have put in bottoming structures such as POPCAT, FARTCOIN, MOG etc.
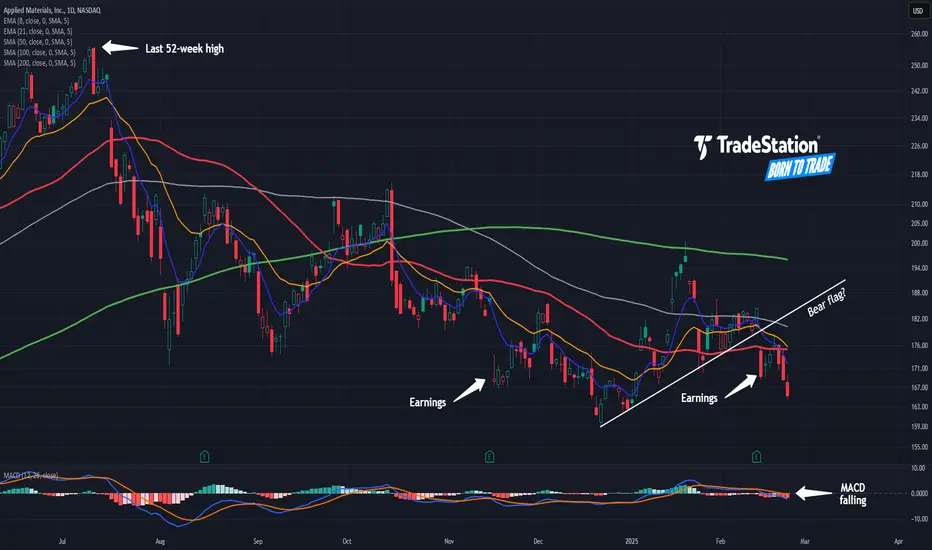
Downtrend in Applied Materials?Applied Materials has struggled since the summer and some traders may see further downside in the provider of chip equipment.
The first pattern on today’s chart is the series of higher lows between late December and mid-February. Earnings beat estimates on February 13, but conservative guidance pushed the stock below that line. The result is a potential bear-flag breakdown.
Second, short- and long-term moving averages may show bearish trends. The 50-day simple moving average (SMA) crossed under the 100-day and 200-day SMAs in September. Two months later, the 100-day SMA slid below the 200-day SMA.
The 8-day exponential moving average (EMA) crossed under the 21-day EMA two weeks ago. MACD has also been negative.
Finally, you have the big event of NASDAQ:NVDA Nvidia earnings tomorrow afternoon. Given its importance to the entire semiconductor industry, AMAT could be especially volatile around the news.
TradeStation has, for decades, advanced the trading industry, providing access to stocks, options and futures. If you're born to trade, we could be for you. See our Overview for more.
Past performance, whether actual or indicated by historical tests of strategies, is no guarantee of future performance or success. There is a possibility that you may sustain a loss equal to or greater than your entire investment regardless of which asset class you trade (equities, options or futures); therefore, you should not invest or risk money that you cannot afford to lose. Online trading is not suitable for all investors. View the document titled Characteristics and Risks of Standardized Options at www.TradeStation.com . Before trading any asset class, customers must read the relevant risk disclosure statements on www.TradeStation.com . System access and trade placement and execution may be delayed or fail due to market volatility and volume, quote delays, system and software errors, Internet traffic, outages and other factors.
Securities and futures trading is offered to self-directed customers by TradeStation Securities, Inc., a broker-dealer registered with the Securities and Exchange Commission and a futures commission merchant licensed with the Commodity Futures Trading Commission). TradeStation Securities is a member of the Financial Industry Regulatory Authority, the National Futures Association, and a number of exchanges.
TradeStation Securities, Inc. and TradeStation Technologies, Inc. are each wholly owned subsidiaries of TradeStation Group, Inc., both operating, and providing products and services, under the TradeStation brand and trademark. When applying for, or purchasing, accounts, subscriptions, products and services, it is important that you know which company you will be dealing with. Visit www.TradeStation.com for further important information explaining what this means.
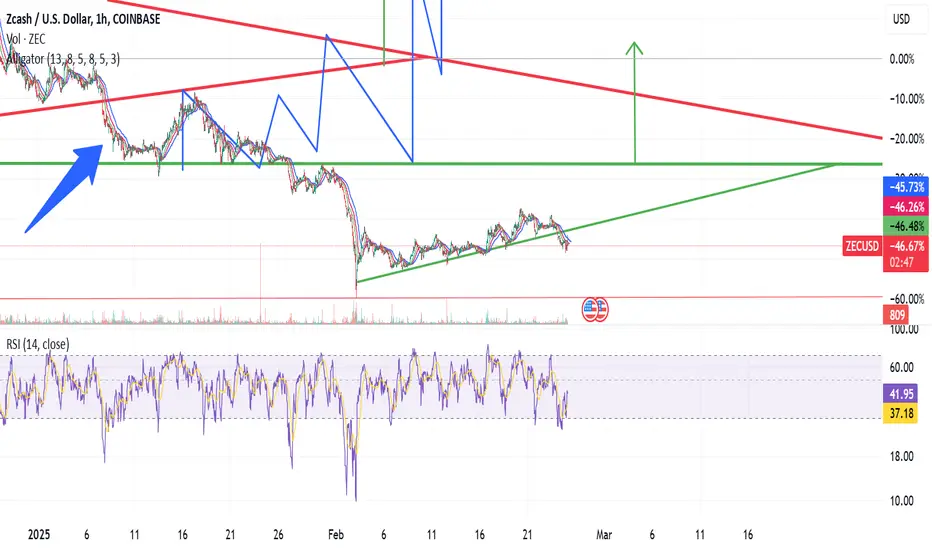
Ascending Triangle pattern for Zcash or Hidden Bear Flag!!!??!?!It appears as though Zcash is forming an ascending triangle pattern, but often this can be confused with a bear flag depending on the Macro Trend of the asset.
The rsi is in a great place for the price to pump.
We have seen the price of Zcash touch the upward sloping support of the pattern over half a dozen times, this is the first time the price have dipped below the upward sloping support.
The price is going to need to rebound immediately if we're going to see a continuation of the pattern.
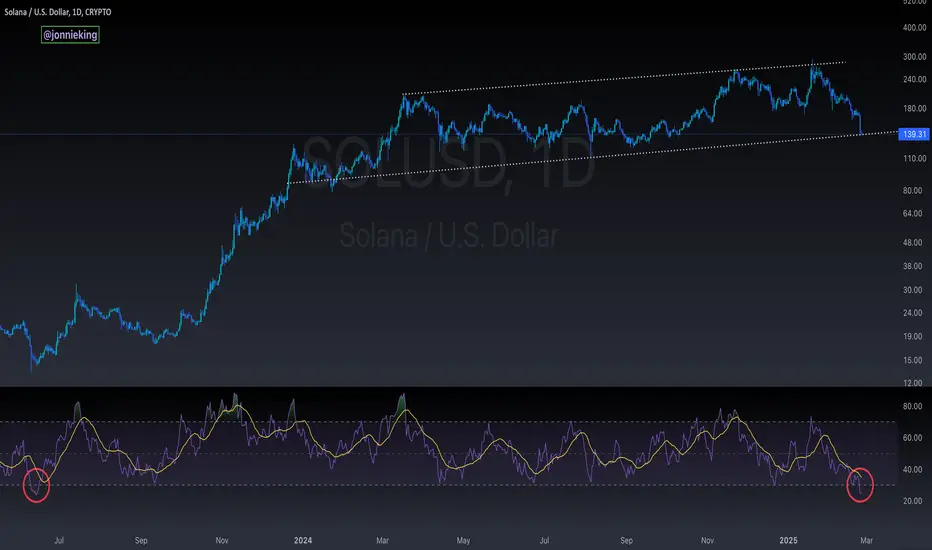
$SOL When in Doubt, ZOOM OUT! BULL FLAGHere's a better look at the RSI being the most OVERSOLD since JUNE 2023.
Obvious Bull Flag.
New ATH should be coming in ETHBull FLAG, Respect of Bullish Trend.
Everything else in the chart. Nothing much to glorify.
Great setup, beware of your risk appetite and manage your risk and position well.
FYI, This is an educational post and nothing else.
Do Your Own Research. This is not an financial advice.
Good Luck.

Bullish on RIOT for short term to medium Term.This is a Monthly chart.
Fair value Gap between $24.75-$27 on Monthly chart.
Price action suggests RIOT is Bullish for short to medium term.
P.S. This is not a financial advice. This is an educational and speculative post only. Do your own research.

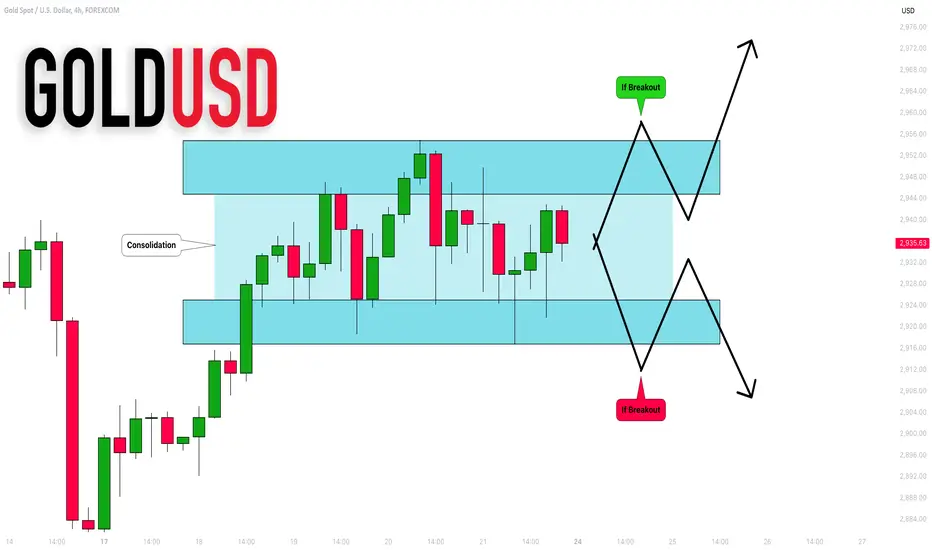
GOLD (XAUUSD): One More Consolidation
Since Wednesday, Gold started to consolidate within a horizontal
channel on a 4H.
To buy Gold with a confirmation next week, wait for a breakout of
the resistance of the channel. It will initiate a movement higher at least to 2975.
Alternatively, a bearish breakout of a support of the channel can trigger
a local correctional movement at least to 2906.
Wait for a breakout, it will provide a reliable confirmation.
❤️Please, support my work with like, thank you!❤️
AUD/USD Bullish Breakout Signals Further UpsideAUD/USD has broken out of a bullish flag pattern on the 4-hour timeframe, suggesting continued upward momentum. A buy entry is recommended at a retest of the former resistance level near 0.63700, now acting as support, aligning with a key bullish trendline.
Technical Observations:
Higher High Formation: The AUD/USD pair has established a higher high on the 4-hour chart, confirming an ongoing bullish trend.
Bullish Flag Breakout: Price has decisively broken above a well-defined bullish flag pattern, typically a continuation pattern that signals further upside.
Support Confirmation: The 0.63700 level, previously acting as resistance, is anticipated to act as support upon a retest.
Trendline Confluence: A bullish trendline further reinforces the support zone near the 0.63700 level.
Trading Recommendation:
Entry Point: Buy AUD/USD near the retest of the 0.63700 level.
Stop Loss: Place a stop loss at 0.63200 to manage risk.
Take Profit 1: 0.64200
Take Profit 2: 0.64700
Disclaimer:
This analysis is for informational purposes only and does not constitute financial advice. Trading involves risk, and you should carefully consider your risk tolerance before making any investment decisions.

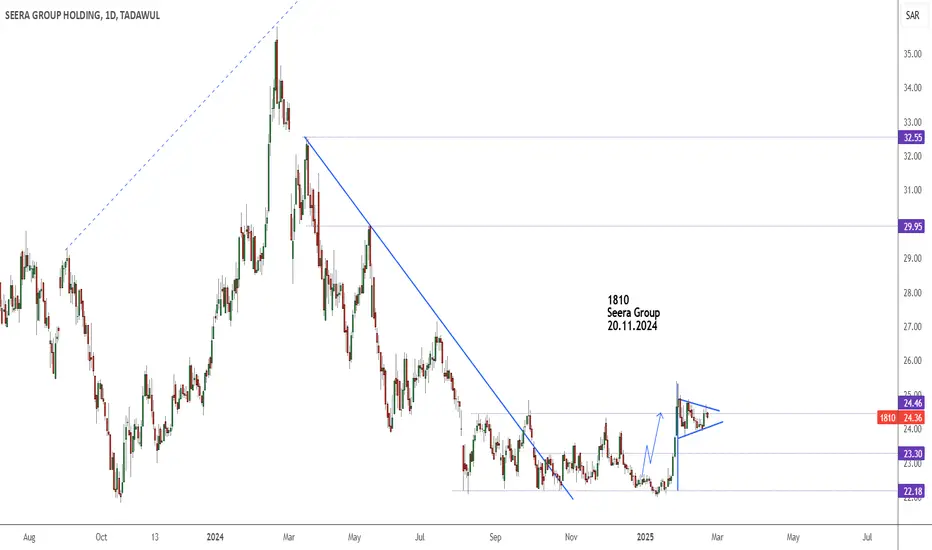
1810 Seera GroupHello traders,
I'm looking for opportunity to re-enter this stock this week.
It's clear it target 26.8
Good Luck for all
The SECRET to BULLISH CHART PATTERNS | EducationBullish chart patterns play out towards the upside... atleast most of the time.
In some cases, a bullish pattern forms - seemingly strong- but ends up going the complete opposite direction. There is a way to navigate this very frustrating outcome - by waiting for confirmation.
Through waiting a little longer, you will surely reduce the profits - but this greatly reduces the risk of playing a "failed" pattern.
Keep a close eye on this bullish chart pattern forming on SUI:
__________________________

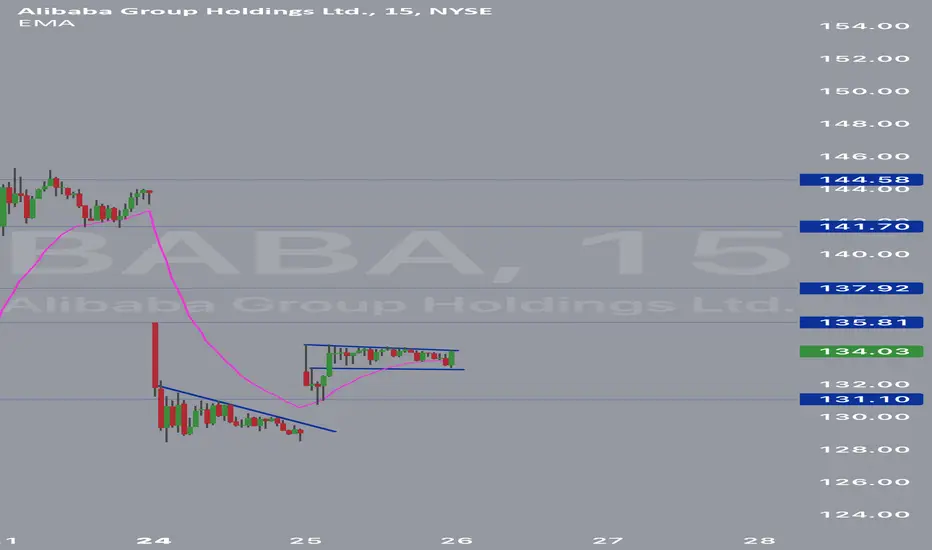
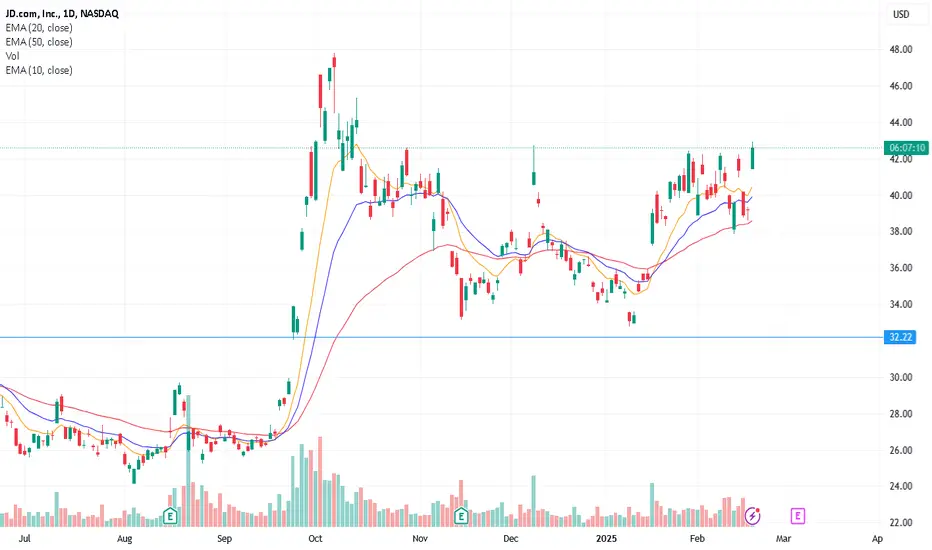
Long JD for another leg up
Long CALL JD 250321C40 @ 4.6
Breakout from Bull Flag, Need follow-through buying over the next several days
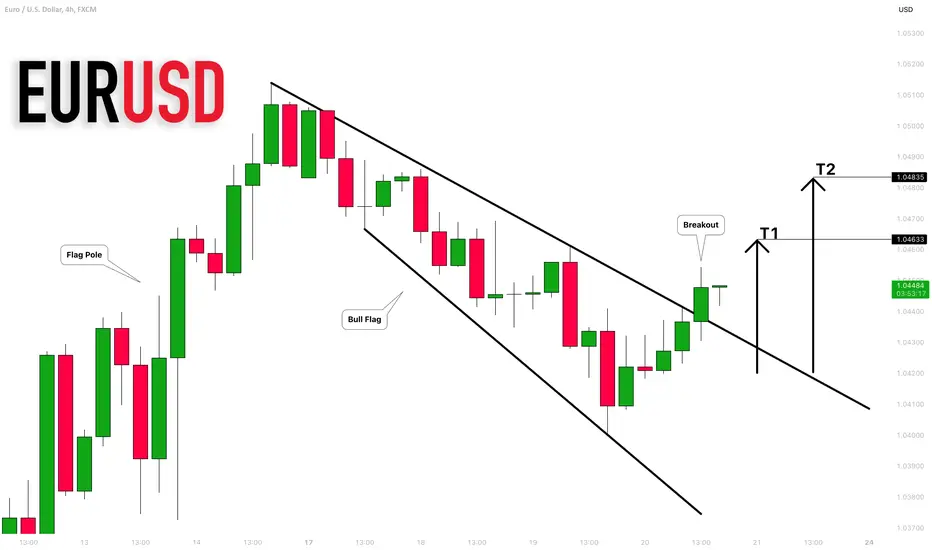
EURUSD: Bullish Continuation Confirmed 🇪🇺🇺🇸
EURUSD successfully broke and closed above a resistance line
of a bullish flag pattern on a 4H.
We can expect a bullish movement at least to 1.0463 level.
❤️Please, support my work with like, thank you!❤️
Bitcoin - No one is expecting this move! (must see)A lot of people are turning very bearish on Bitcoin, but I don't think it's time to be bearish, the bearish trend is not confirmed at all, and the price of Bitcoin should first touch the long-term major trendline (2017 -> 2021 -> 2025). You want to sell at the touch of the trendline. The second option is to use the Fibonacci extension tool and look for the 1.618 FIB. I did it for you, and the 1.618 FIB is exactly at 122,069 USD.
Bitcoin is currently in the final stage of the bullish cycle that started in 2022 (15,632 USDT) and is predicted to end in 2025 (around 125,000 USDT). This was a pretty good investment, but if you are jumping in right now, you will most likely get hurt in 2025 and 2026. Let's take a look at history to see what we can expect in the next few years.
Bitcoin crashed by 84% (in 2018) and 77% (in 2021). These are the classic bear market crises that Bitcoin experiences every 3–4 years. It's because we have halving events (reducing rewards for miners in BTC) every 4 years from a fundamental perspective. You may know that Bitcoin is highly volatile. History is telling us that in 2025/2026 a huge bear market and crisis are ahead.
From the Elliott wave perspective, we are in the final wave (5). We can expect an ABC correction in 2025/2026 which would bring the price down to 50,000. I bring you very strong technical data that you can use on your trading decisions.
In conclusion, I am currently optimistic about the price of Bitcoin for the next weeks and months. I think Bitcoin will hit 120k to 125k before we experience a major drop or flash crash. It's safe to buy/long Bitcoin, but do not forget to take profit!
Write a comment with your altcoin, and I will make an analysis for you in response. Also, please hit boost and follow for more ideas. Trading is not hard if you have a good coach! This is not a trade setup, as there is no stop-loss or profit target. I share my trades privately. Thank you, and I wish you successful trades!

Bitcoin consolidation rangeUnfortunately so far it looks like BTC is forming a bullish consolidation range (bull flag/pennant) on month timeframe. I don't like that scenario as it leads to very choppy and bloody spring and summer, all the way till quarter 4 when BTC finally breakout.
But I still have full confidence in my cycles chart. Forth quarter will be epically bullish .

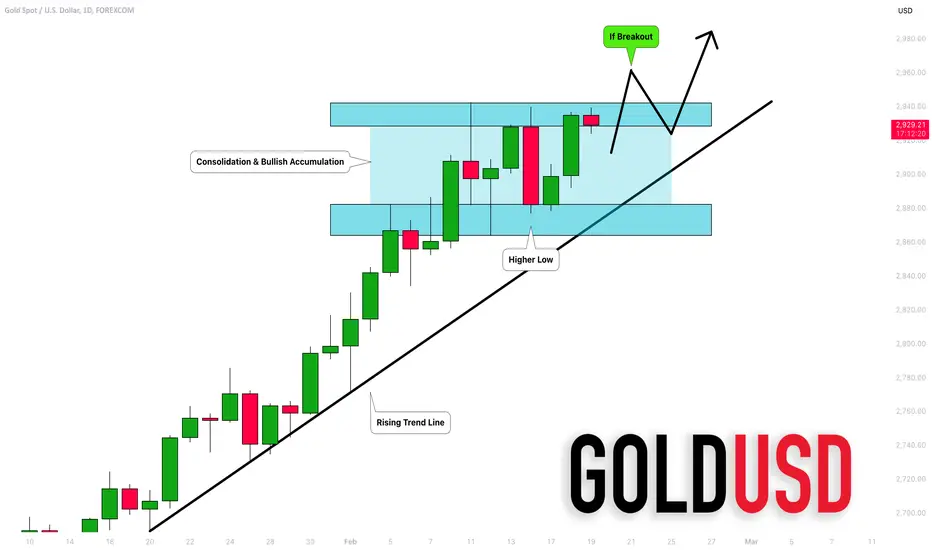
GOLD (XAUUSD): Breakout Soon?!
I see clear signs of a bullish accumulation on a daily.
The recent formation of a higher low and 3 consequent equal highs
indicates a highly probable coming bullish movement.
As always, your perfect confirmation is a breakout.
The violation of the underlined blue resistance will give you a
strong bullish signal.
Growth will be expected then.
❤️Please, support my work with like, thank you!❤️