Pfizer will go to $ 5.05 and then maybe lowerThere is a beautiful Daily Chart bear flag playing out on this play. Plus , yes.
Flag
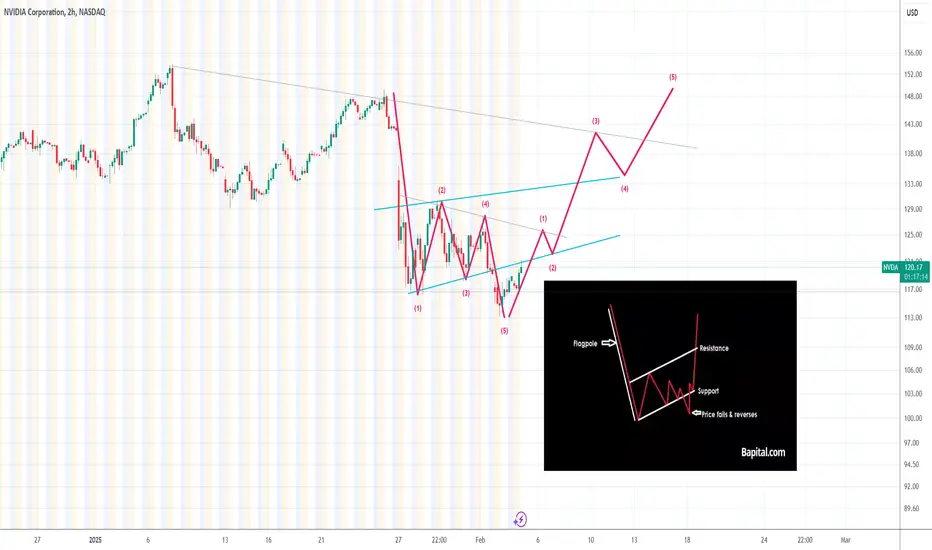
NVIDIA (NVDA) - Failed Bear Flag, Bullish Reversal in Play📉 Failed Bear Flag Pattern
NVDA initially formed a bear flag, with a strong downward flagpole followed by consolidation in an upward-sloping channel. However, instead of breaking down as expected, the price reversed at the lower boundary, signaling bulls absorbing selling pressure.
📈 Breakout Potential
The recent impulse move out of the flag formation aligns with a Wave 1 breakout, confirming a potential bullish trend. If the Wave 2 retracement holds above previous lows, NVDA could see a strong Wave 3 rally towards $130-$140.
🔍 Key Resistance & Confirmation Levels
Immediate resistance around $122-$124 (previous highs & bear flag upper boundary). A break above $124 with volume could trigger further bullish momentum. Downside risk remains if NVDA re-enters the bear flag below $115.
🚀 Bullish Bias Unless Invalidated
Given the failed bear flag breakdown and Elliott Wave structure, the bias shifts bullish towards higher highs. Watch for strong follow-through on Wave 3 to confirm this setup.
📊 Trade Plan:
Entry: On pullbacks above $118-$120
Target: $130-$145
Stop: Below $115
💡 Let me know your thoughts! Do you agree with this bullish outlook?
Don't forget,
Patience is Paramount.
Best Chart Patterns to Buy Gold in Uptrend
One of the proven strategies to safely buy gold in uptrend is to look for THESE chart patterns.
In this article, I will teach 4 best bullish price action patterns for Gold trading.
All the patterns that we will discuss work perfectly on a daily, 4h, 1h time frames.
The first strong bullish pattern, that we will discuss, is a bullish flag pattern.
The pattern is based on 2 important elements:
a bullish impulse leg and a bearish correctional movement afterward.
The highs and lows of a correctional movement should respect 2 falling trend lines: one being a vertical resistance and one being a vertical support.
These 2 trend lines will compose a falling parallel channel.
Your strong bullish signal will be a breakout of the resistance of the flag - a candle close above that.
The trading strategy of this pattern is very straightforward .
After a violation of the resistance of the flag is confirmed , buy the market immediately or on a retest. Place stop loss order below the lowest low of the pattern, initial target - the high of the pattern with a potential bullish continuation to a new high.
Look at a bullish flag pattern on Gold on a 4H time frame. A bullish breakout of its upper boundary was a perfect signal to buy XAUUSD.
The variation of a bullish flag pattern is a falling wedge pattern.
In a wedge pattern, a correctional movement occurs within a contracting channel based on 2 converging trend lines.
The same strategy is applied for buying wedge pattern after a breakout .
Above, you can see a falling wedge on Gold chart on a daily that was formed after a completion of a sharp bullish wave. Bullish violation of the resistance line of the pattern was a strong call to open long position.
Trading hundreds of bullish flags and falling wedges, I noticed that the wedge patter has a little bit higher accuracy.
The next chart pattern for buying Gold is called Ascending Triangle.
After completing a bullish impulse and setting a higher high, the market should start consolidating .
A consolidation should have a specific shape: the price should start respecting a horizontal resistance based on the last high and drop from that, setting equal high and a consequent higher low after every bearish movement.
A reliable bullish signal will be a breakout - a candle close above a horizontal resistance line based on the equal highs.
Buy Gold immediately after a violation, or set a buy limit order on a retest of a broken resistance.
Safe stop loss will be at least below the last higher low.
If you are taking the trade on 1H time frame, set it below the first higher low.
Take profit will be the next potentially strong resistance.
With the absence of historic resistances, your goal can be the next psychological level based on round numbers.
That's a perfect example of the ascending triangle pattern that formed on Gold on a daily time frame. After a breakout of its resistance, a bullish rally initiated.
Usually, the pattern is considered to be completed when the price sets at least 3 higher lows and 3 highers highs.
If only 2 equals highs and 2 higher lows are set, such a pattern will be called Cup & Handle.
Entry, stop loss and target rules are the same as in ascending triangle trading.
That's a nice cup & handle pattern on Gold on a 4H. Violation of its resistance triggered a significant trend-following movement.
The last pattern for buying Gold is horizontal parallel channel.
It should form after a completion of a bullish wave and represent a consolidation and indecision.
The price should set equal highs and consequent equal lows, respecting horizontal support and resistance.
A strong bullish signal to buy Gold will be a breakout of a horizontal resistance of the channel and a candle close above.
The principles of its trading strategy are very similar.
Open long position on Gold immediately after a candle close above the resistance or on its retest.
Stop loss should be placed below the support of the channel.
Take profit will be the next historic or (if there is no) psychological level.
Check this horizontal channel that was spotted on a daily time frame on Gold chart. After quite an extended consolidation within, the price violated its upper boundary and went up.
All these chart patterns have a unique shape and structure and are very easy to recognize. Apply them for trend-trading Gold on any time frame and good luck in your journey.
❤️Please, support my work with like, thank you!❤️
Closing my entire crypto position todayBitcoin prices have been consolidating since December '25 (around 60 days) after multiple failed attempts to continue the uptrend (as indicated by the purple Xs on the chart).
Even though I remain bullish on the asset in the long term, I decided to close all my cryptocurrency positions today and allocate 100% in dollars. From a technical perspective, a double-top pattern has started to form, which is a bearish signal, and I’d rather not risk waiting to see if it gets confirmed or if the asset simply continues moving sideways.
I prefer to watch this consolidation from the sidelines and accept the risk of buying back at a slightly higher price only after a breakout—if it happens. If it doesn’t, closing my positions will have been a successful protective move.
I also acknowledge the formation of a flag pattern near the upper resistance of the range, but again, if it confirms and breaks out, I will re-enter. For now, I’m choosing the more cautious path and prioritizing capital protection.
Part of this position was bought recently, around 100k, speculating on potential euphoria after reaching that price level. Another portion was acquired around 60k in September '24.

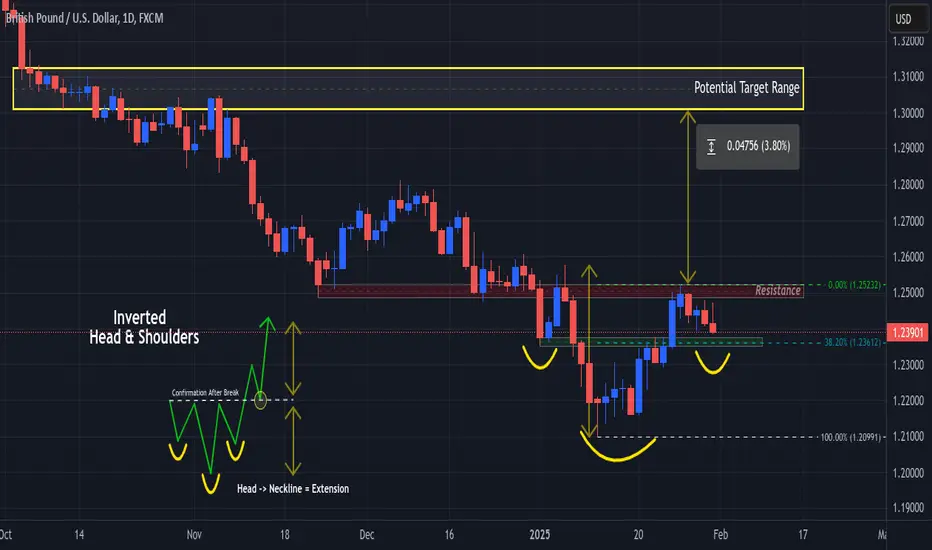
Can Bulls Flip GU "On Its Head" @ 38.2% Level?Last week we saw FX:GBPUSD attempt to Break Above the 1.25 Resistance Zone that its been struggling with since November 2024 and was sent back down underneath following the Fed's decision to Hold Interest Rates.
We can see that Price so far seems to be following a Head & Shoulders layout where Price now is declining down to the Low that formed the "Left Shoulder" @ ( 1.23745 - 1.23518 )
What makes this Price Range so favorable is that if you take the Fib Retracement Tool from the Low of the "Head" @ 1.20991 to the 2nd Touch of the "Neckline" @ 1.25232, the 38.2 % Retracement Level lands right at the potential Support level of the "Left Shoulder"
-If Price finds Support at this level, we can suspect the Low to form the "Right Shoulder" then for Price to work back up to the "Neckline" for a Break and Close for Confirmation of Pattern to then look for more Buying Opportunities!
*Price Breaking and Closing the Neckline, signaling Confirmation of Pattern, will deliver a 90% Success Rate to the expected Bullish outcome.
*Watch for Increase in Volume after Price is Successfully Supported by Low of Left Shoulder and RSI to maintain Above 50!
Fundamentally,
GBP:
Final Manufacturing PMI - Monday
Final Services PMI - Wednesday
Construction PMI/Bank Rate - Thursday
USD:
ISM Manufacturing PMI - Monday
JOLTS - Tuesday
ADP Non-Farm Employment/ISM Services PMI - Wednesday
Unemployment Claims - Thursday
AVG Hourly Earnings/ADP Non-Farm Employment/Unemployment Rate - Friday
Could XRP Reach $4? Factors Pointing to Explosive Growth
The cryptocurrency market has witnessed a rollercoaster ride in recent years, with Bitcoin and Ethereum leading the charge. However, another cryptocurrency is quietly gaining traction and attracting significant attention from investors and analysts alike: XRP.1
XRP, the native token of the Ripple network, has a unique proposition as a bridge currency for facilitating global financial transactions.2 Its speed, low transaction costs, and cross-border capabilities have the potential to revolutionize the way we move money across borders.3
Key Factors Driving XRP's Potential Surge:
Several factors are converging to create a bullish outlook for XRP and potentially propel its price to $4 or even higher:
• Growing Institutional Adoption:
o Ripple's partnerships with major financial institutions worldwide are steadily increasing.4 These partnerships, including collaborations with banks, money transfer companies, and payment processors, demonstrate the growing acceptance and integration of XRP into the global financial system.5
o As more institutions embrace Ripple's technology, the demand for XRP is likely to surge, driving its price upwards.6
• Regulatory Clarity:
o The ongoing legal battle between Ripple and the Securities and Exchange Commission (SEC) has created uncertainty in the market.7 However, recent developments suggest a potential resolution in favor of Ripple.
o A favorable ruling could significantly boost investor confidence and unlock significant pent-up demand for XRP.
o Increased regulatory clarity would pave the way for wider adoption and integration of XRP into various financial applications.8
• Technological Advancements:
o Ripple continues to innovate and enhance its technology, improving transaction speeds, scalability, and security.9
• Growing Global Demand for Faster and Cheaper Cross-Border Payments:
o The increasing globalization of trade and commerce has created a growing demand for faster, cheaper, and more efficient cross-border payment solutions.10
o XRP, with its unique capabilities, is well-positioned to capitalize on this demand by providing a more efficient alternative to traditional banking systems.11
• Increasing Market Capitalization:
o As XRP gains wider adoption and its use cases expand, its market capitalization is likely to increase significantly.
o A larger market capitalization would naturally lead to a higher price per token.
Technical Analysis:
From a technical perspective, several indicators suggest a bullish trend for XRP.
• Breaking Out of Resistance Levels:
o If XRP successfully breaks out of key resistance levels, it could signal a significant upward move.
o Technical analysts are closely monitoring these levels and anticipating a potential breakout.
• Increasing Trading Volume:
o A surge in trading volume often precedes a significant price movement.12
o Increased trading activity indicates growing interest and demand for XRP.13
• Positive Sentiment:
o Positive sentiment among investors and analysts is crucial for driving price appreciation.
o As more analysts and investors express bullish sentiments on XRP, it can create a self-fulfilling prophecy and drive prices higher.
Potential Challenges and Risks:
While the outlook for XRP appears promising, it is crucial to acknowledge potential challenges and risks:
• Regulatory Uncertainty:
o The ongoing legal battle with the SEC continues to pose a significant risk.14
o An unfavorable ruling could severely impact XRP's price and hinder its growth.
• Competition:
o The cryptocurrency market is highly competitive, with numerous other cryptocurrencies vying for market share.15
o Competition from other blockchain platforms and cryptocurrencies could limit XRP's growth potential.16
• Market Volatility:
o The cryptocurrency market is known for its volatility.17
o Sudden market downturns or unforeseen events could significantly impact XRP's price.
Investment Considerations:
Investing in cryptocurrencies carries significant risks, including the risk of losing all or part of your investment.18
• Conduct thorough research: Understand the technology behind XRP, its potential use cases, and the risks involved.
• Diversify your portfolio: Don't invest all your funds in a single cryptocurrency.
• Invest only what you can afford to lose: Avoid investing more than you can afford to lose financially.
• Stay informed: Keep abreast of the latest developments in the XRP ecosystem and the cryptocurrency market as a whole.
Conclusion:
XRP has the potential to disrupt the global financial system and revolutionize the way we move money across borders.19
• Its unique technology, growing institutional adoption, and increasing demand for faster and cheaper cross-border payments create a compelling investment case.
• However, it is crucial to acknowledge the inherent risks associated with investing in cryptocurrencies.
• Investors should conduct thorough research, diversify their portfolios, and invest responsibly.
Disclaimer: This article is for informational purposes only and does not constitute financial advice.
• Investing in cryptocurrencies20 involves significant risks, and you should carefully consider your investment objectives, financial situation, and risk tolerance before making any investment decisions.2122
Note: This article provides a general overview of XRP and its potential.
• The cryptocurrency market is dynamic and subject to rapid change.
• It is essential to conduct independent research and consult with a qualified financial advisor before making any investment decisions.
•
Disclaimer: This article is for informational purposes23 only and does not constitute financial advice.
• Investing in cryptocurrencies24 involves significant risks, and you should carefully consider your investment objectives, financial situation, and risk tolerance before making any investment decisions.

MoonWell - similar bottom and bull flag, breakout = 40%+ profitLadies and gentlemen, we have a bullish reversal pattern forming on the six hour chart for Moonwell, happening inside a larger bull flag on the daily chart. It is currently printing a little flag following a similar price bottom bounce, which may end up being the second portion of a small Adam and Eve reversal. A conservative position stands to make at least 40% profit, selling at $0.057. COINBASE:WELLUSD
-Contingent upon breakout of the flag on the six hour chart-

Solana 4h - Potential second leg down Solana has the potential for a second leg down. It can get close to it's Moving Average again

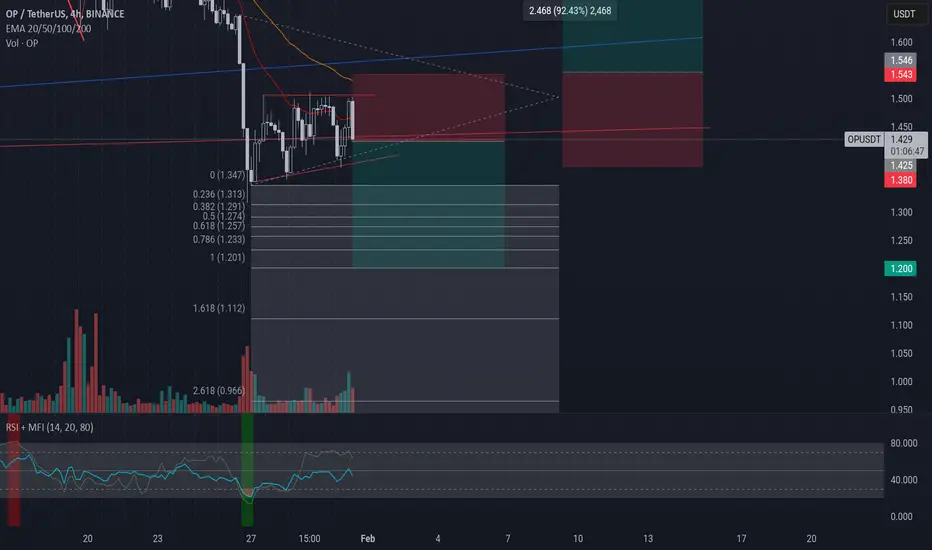
OP 4h - The last candleIf the last candle closes in a bearish breakout, %70 chance for a second leg down, if reverse, back to the previous high
AT&T Macro Bull FlagLots of potential upside for this telco. Potentially forming a massive bull flag.
Do you see a different pattern forming?
I suppose this would be a buy and hold as this would take 10 years to play out.
Time in the market is better than timing the market.

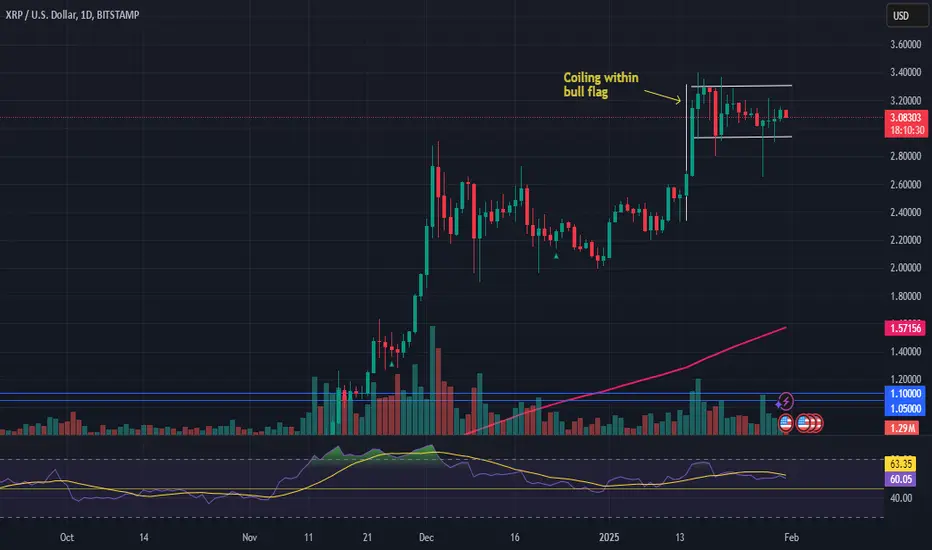
XRP/USD – Technical OverviewCurrent Price Action:
XRP has recently surged from $2.40 to highs near $3.40, forming a bullish flag pattern. This pattern indicates a consolidation phase within a broader uptrend, suggesting a potential continuation after the pause.
Key Levels to Watch:
Support (Lower Trendline):
$2.90: Critical support level near the flag’s lower trendline. A breakdown below this zone could indicate a deeper retracement and weaken the bullish outlook.
Resistance (Upper Bound of Flag):
$3.40: Immediate resistance, where the price has recently stalled. A break above this level would signal the resumption of the uptrend.
Bullish Targets:
$4.00-$4.20: Potential upside targets if the breakout from the bullish flag materializes. These levels align with the prior highs and would offer significant resistance.
Market Dynamics:
The bullish flag pattern suggests that the market is in a consolidation phase, likely as a pause before the next leg higher. This is a typical setup for continuation in an uptrend, where a breakout above $3.40 would likely propel XRP toward $4.00-$4.20.
Broader Uptrend:
The uptrend that began in November remains intact, and this consolidation phase is viewed as a temporary rest before the next bullish move.
Outlook:
Bullish Scenario:
A breakout above $3.40, with solid volume and momentum, would confirm the continuation of the trend. The $4.00-$4.20 range would be the initial target, providing substantial upside potential for traders.
Bearish Scenario:
If XRP breaks below $2.90, this could signal a deeper retracement, potentially testing the $2.40 support zone or even lower, depending on the strength of the breakdown.
Conclusion:
As long as XRP remains within the flag pattern, the bullish outlook remains intact, with the $4.00-$4.20 range serving as the key target upon a successful breakout. However, traders should remain cautious of a possible breakdown below $2.90, which would require re-assessment of the technical structure.
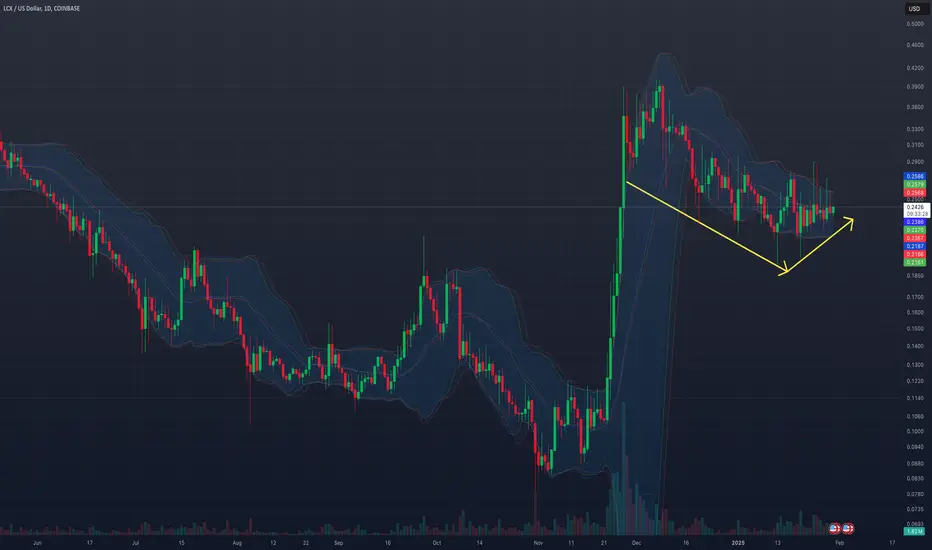
$LCXUSD – Textbook Retest Before a MAJOR BreakoutMIGHTY Bull Flag Flying at Full Mast CRYPTO:LCXUSD COINBASE:LCXUSD
Please maximize the daily chart!
I've left them all here so you can quickly see how this will evolve but all you need to see is the daily chart in its full frame and your brain will explode!
This example needs to go in a book. Have you ever seen one so beautiful?
Hurry, the breakout has already begun. I tried to get this up as fast as I could. It was completely quiet when I found it 30 minutes ago. I've had my own things to consider.
But now I have time to tell you - you'd have to hate money not to buy this! (No, that isn't investment advice, it is investment admonishment! With love!) Look with your eyeballs! Maybe there will be a pull back for you to buy maybe there won't be it still looks quiet on the daily chart but I don't think that's gonna last more than a few more minutes...
Perfect accumulation structure after a massive rally, confirming a higher low on the weekly chart. This pattern suggests (clearly) that the pullback is complete, and the continuation is imminent.
✔ Bullish Retest of Breakout Zone – After a parabolic move in December, price has retraced in a controlled manner and is now bouncing off strong support.
✔ Higher Low Structure Forming – The market has refused to make a lower low, signaling accumulation and uptrend continuation.
✔ Trendline Support Holding Firm – Buyers are stepping in exactly where they should, confirming a bullish continuation setup.
✔ Volume Showing Accumulation – No panic selling, just steady absorption before expansion.
✔ Compression Before Expansion – The price action is tightening, indicating an imminent breakout once liquidity kicks in. That was then now is now!
Trade Plan 🎯
📍 Breakout Confirmation: Above $0.26 - $0.28, expecting rapid acceleration toward $0.34 - $0.40. Better hurry this is old news!
📍 Key Support: $0.216 - $0.225 remains the final defense for bulls.
📍 Upside Targets: If momentum picks up, LCX could revisit $0.50+ and will probably go into price discovery with new all-time highs
This is the bottom. If LCX clears resistance, these prices will never be seen again. A weekly breakout is in the making—time to pay attention.
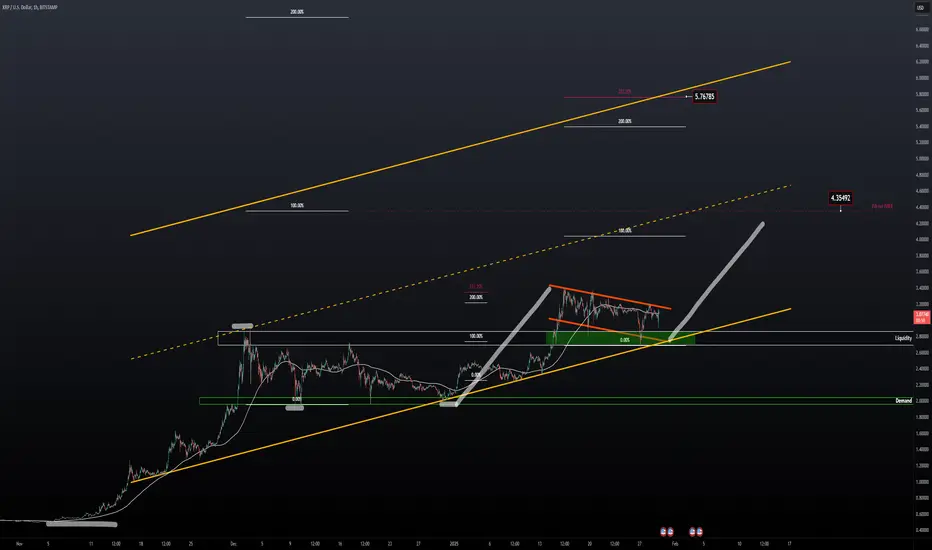
XRP | Bull Flag ContinuationPrice action successfully holding up above liquidity after breaking out from $2.80
As this retest develops it looks like we're forming a bull flag for a continuation towards $4.35 and then to see another rip onwards on the high side of the parallel channel with a second target of around $5.50.
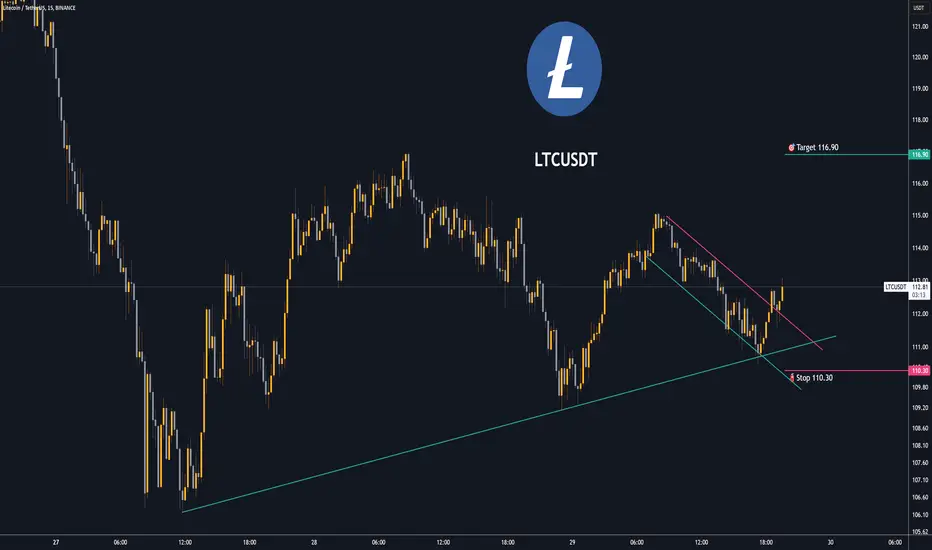
Trading opportunity for LTCUSDTBased on technical factors there is a Buy position in :
📊 LTCUSDT
🔵 Buy Now
🪫Stop loss 110.30
🔋Target 116.90
📏 R/R 1,5
💸RISK : 1%
We hope it is profitable for you ❤️
Please support our activity with your likes👍 and comments📝
Bullish decending triangle, forming inverse H&S???On multiple TFs, patterns from Cup & Handle to decending triangle and, inverse head and shoulders.....
Manipulation to clean out weak hands.
Your thoughts???

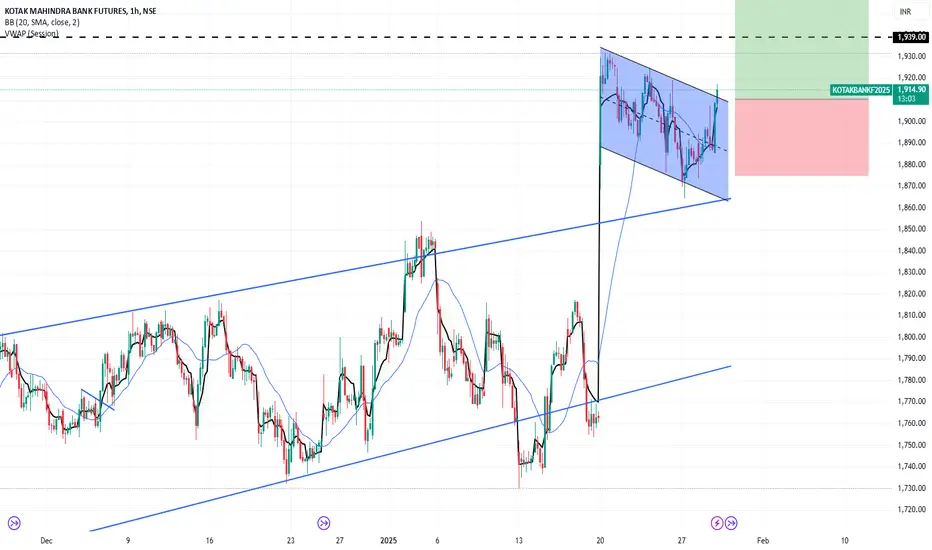
FLAGKotak Bank Future broke out of flag pattern after healthy consolidation on an hourly charts with all indicators (MACD,ADX,OI &RSI) signals positive.
Risk:Reward = 1:3
Could b bought with mentioned stoploss & target.
Time for ARKK to Breakout?ARKK has been trading within a channel and finally appears like maybe it's time to breakout? When ARKF and ARKW signaled earlier in the day, figured it was only a matter of time when this one would go! With Fed tomorrow this on is a tricky trade and if anything this bear flag appears it retraced to the golden pocket on dropping volume. However, this one is my favorite one to trade when it signals.
Let me know if you think this is a bear flag ready to move lower with Fed speak or going to move higher?
The King Trading Momentum Strategy combines the 5 EMA crossing above the 13 EMA, RSI strength, favorable momentum as measured by ADX plus evaluating recent volume changes and even something that measures breakout momentum called Beta for this one! ARKK and over 100 equities are built into this script with optimal backtest take profits and stop losses and can be toggled on by simply checking a box (default they are turned off). This one has won a couple in a row and this algo likes to get streaky!

$NYSE:OKLO breaking a Wedge/Flag with short term 25%-60% upsideNYSE:OKLO is breaking out of a consolidation pattern (falling wedge) And what appears to be a flag pattern.
Confirmation is a 24% uptick in price along with strong volume.
Initial Price Target is ~$34.50 to complete the falling wedge pattern, which is a short term 25% upside.
Secondary Price Target is ~$42.90 to complete the flag pattern, which is a longer term 60% upside
Good Luck!

$AKT Akash bullish continuation to 11$?CSEMA:AKT is consolidating in a flag pattern. As long as this support line is not broken (we are at the bottom of it now, 11$ could be the next target. This comes from a bigger cup&handle pattern ideea. Let's go!

Clean bullflag TA for an IP Owned Memecoin on SolanaRAYDIUM:KIKISOL_DJMQV6.USD
This is bible bullflag breakout strategy in the imminent and upcoming altseason coming up, nothing special.

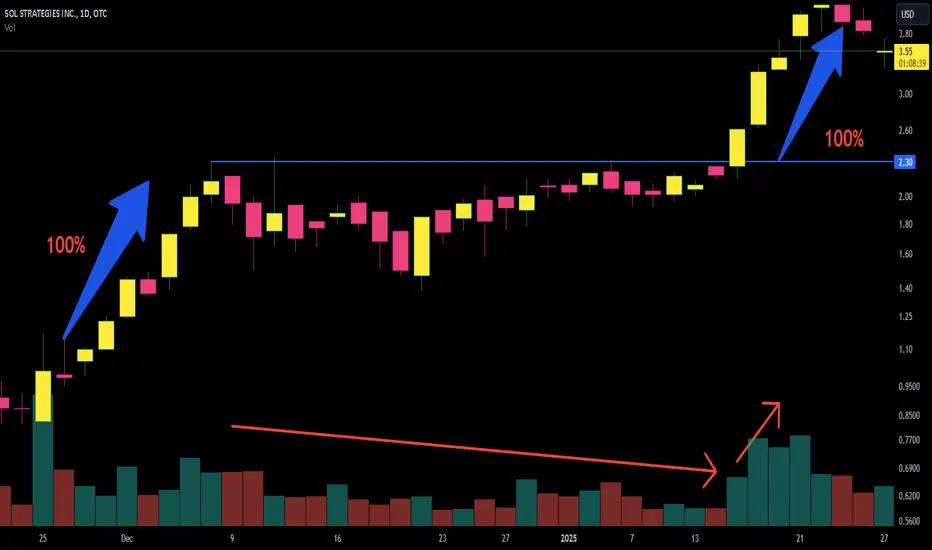
High Tight Flag: The Ultimate Key to Explosive ProfitsIn the realm of trading, there exists a chart pattern so powerful, so rare, that it feels like a prophecy for massive success – the High Tight Flag (HTF). This isn’t just another pattern; it’s the holy grail of bullish setups, a gateway to some of the most extraordinary gains the market has to offer. Traders who master this pattern unlock the ability to spot opportunities that others can only dream of.
The Magic of the High Tight Flag
Picture this: a stock surging over 100% in just 1 to 8 weeks, defying expectations with an almost vertical climb. Then, it pauses – but only briefly – with a shallow pullback of no more than 25%, lasting just 1 to 5 weeks. The tension builds, the stage is set, and suddenly, the breakout erupts, sending the stock to new all-time highs.
This is no ordinary pattern. The High Tight Flag signals one thing loud and clear: no one is selling. Despite the enormous gains, buying pressure remains relentless. This shows us that big players – institutional investors – are still loading up. It’s a rare alignment of forces that every trader dreams of catching.
Volume: The Hidden Key to Validation
Volume plays a critical role in confirming the strength of the High Tight Flag pattern. As the stock consolidates, the volume should decrease, indicating a pause in aggressive buying while holders remain firm. When the breakout occurs, the volume should spike significantly, showing a renewed surge of demand that propels the stock higher. Without this volume confirmation, the pattern’s reliability decreases.
Unlocking the High Tight Flag’s Power
A Lightning Surge: The stock climbs 100% or more in just 1–8 weeks.
A Calm Pause: The pullback stays shallow, between 10–25%, over a short period (1–5 weeks).
The Perfect Flag: Flags with a slight downward slope are often the most explosive.
The Entry Point: The breakout occurs when the stock surpasses the flag’s high by, for example, 10 cents.
Volume Confirmation: Ensure volume decreases during consolidation and surges above average during the breakout.
The High Tight Flag is the epitome of market strength, revealing the hand of smart money in action.
A Proven Success Rate
The High Tight Flag boasts a success rate of over 75%, making it one of the most reliable patterns in existence. But it’s not for the impatient or undisciplined. This is a rare gem, and spotting it requires both skill and dedication. Yet, the reward is unparalleled: explosive moves and the chance to ride the wave of institutional momentum.
A Community Built on Success: Let’s Share Our Findings
To all TradingView users: I have a suggestion to make this even more powerful. Whenever you spot a High Tight Flag formation, share it in the comments! Let others know the stock, the timeframe, and the setup you’ve identified.
By working together as a community, we can uncover these rare opportunities faster and ensure no one misses out. Let’s build a space where knowledge flows freely, and success becomes a shared achievement.
So, if you find an HTF pattern, don’t keep it to yourself—help others, and they’ll help you in return. Together, we can dominate the markets!
The Pattern That Could Transform Your Trading
The High Tight Flag is more than a pattern – it’s a revelation that separates the average trader from the elite. It offers a window into the market’s inner workings and shows you the true power of institutional demand. By mastering it, you’ll gain the edge to capture opportunities others overlook.
This isn’t just a tool; it’s your blueprint to extraordinary success. Learn it, apply it, and let your gains speak for themselves. The next big move is out there – are you ready to seize it?
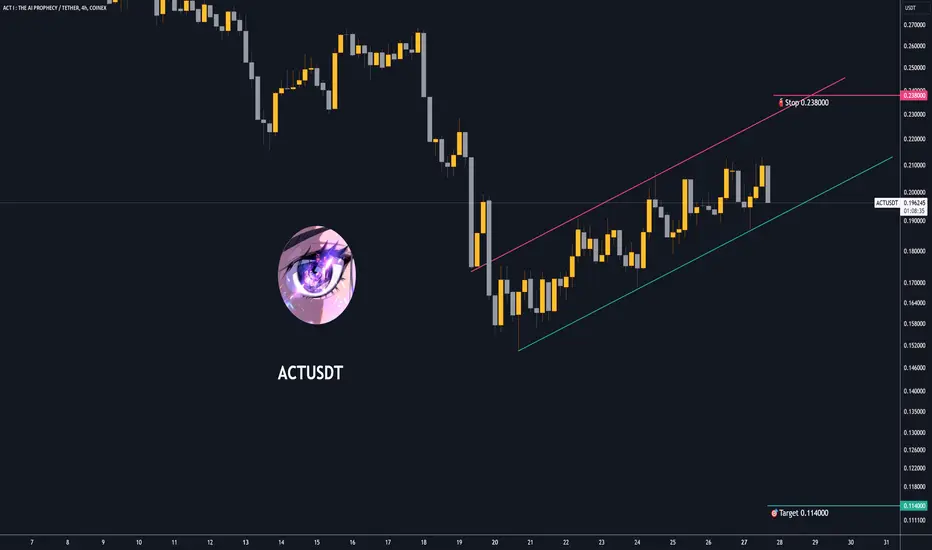
Trading opportunity for ACTUSDTBased on technical factors there is a Sell position in :
📊 ACTUSDT
🔴 Sell Now
🪫Stop loss 0.238000
🔋Target 0.114000
📏 R/R 2
💸RISK : 1%
We hope it is profitable for you ❤️
Please support our activity with your likes👍 and comments📝
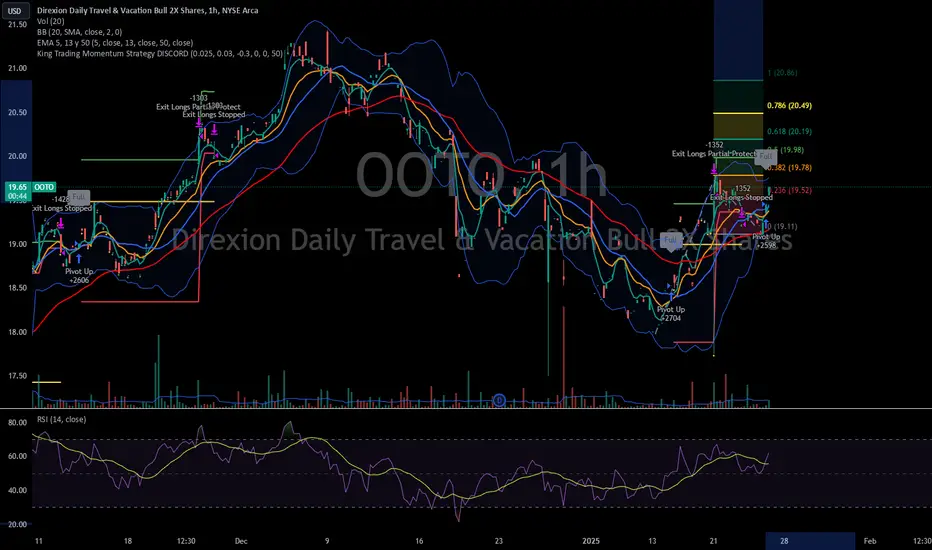
Need a Vacation with OOTO?This one just fired and vacation stocks likely don't care about semi-conductors. Who knows, maybe they even benefit from cheaper AI on a laptop computer!
This bull flag if it breaks out has a 7% profit target based on Fib Extension, with the algo backtest saying 5% take-profit and a 3.5% stop loss. If it hits 5%, I will go ahead and protect by selling half and then set trailer for 1.75% on remainder, with the intention of selling on the way up to 7%! But for now, I will just be happy if momentum continues to the upside!
The King Trading Momentum Strategy combines the 5 EMA crossing above the 13 EMA, RSI strength, favorable momentum as measured by ADX plus evaluating recent volume changes and even something that measures breakout momentum called Beta for this one! OOTO and over 100 equities are built into this script with optimal backtest take profits and stop losses and can be toggled on by simply checking a box (default they are turned off).