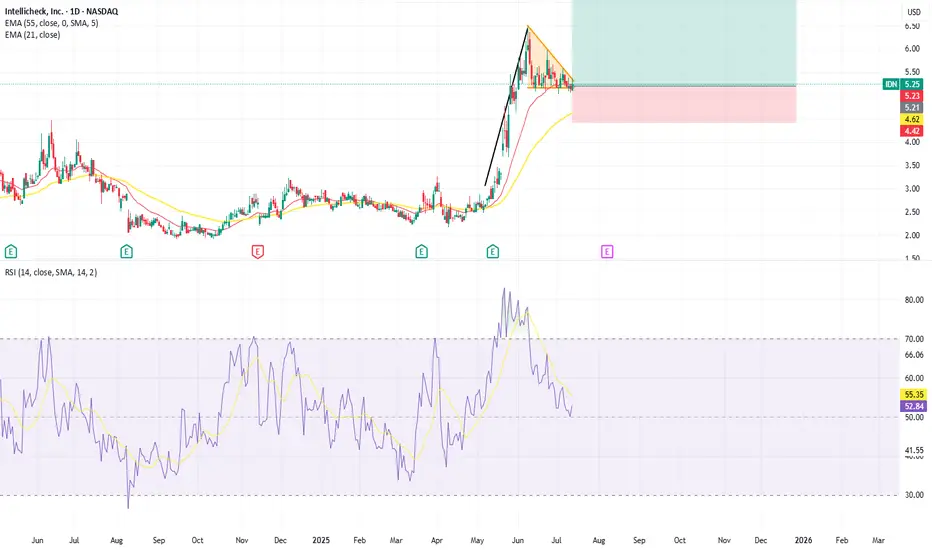
IDN Bullish Pennant FlagNASDAQ:IDN has had a huge run up in the last two month and a Bullish Pennant flag is starting to form with support at 5.16. Below this we saw some support at 4.80. Using a Stop Loss just below this level and a target set at the next resistance level established in 2022 yields a R:R of 1:3.5.
Flag
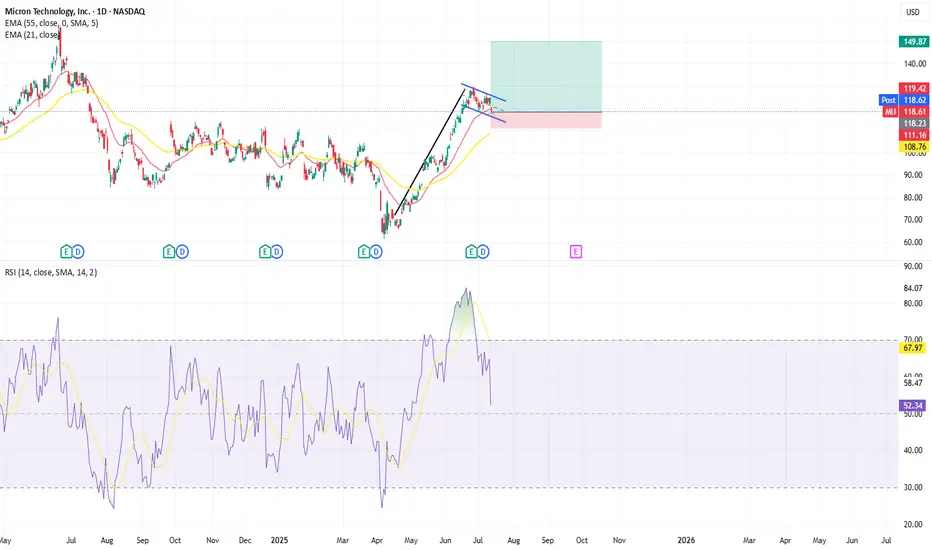
Bullish flag Pattern on MUIt appears there is a Bull flag occurring in MU. Weve seen an 82% rise since the lows caused by the market drop in April and our now seeing a slight retraction back into the 21 EMA. Price is currently at 118.6 with some support at the 114 level. Using a Stop Loss just below this support level should it break and using the first target of 150, just below all time highs yields a risk reward ratio of 1:4.5.
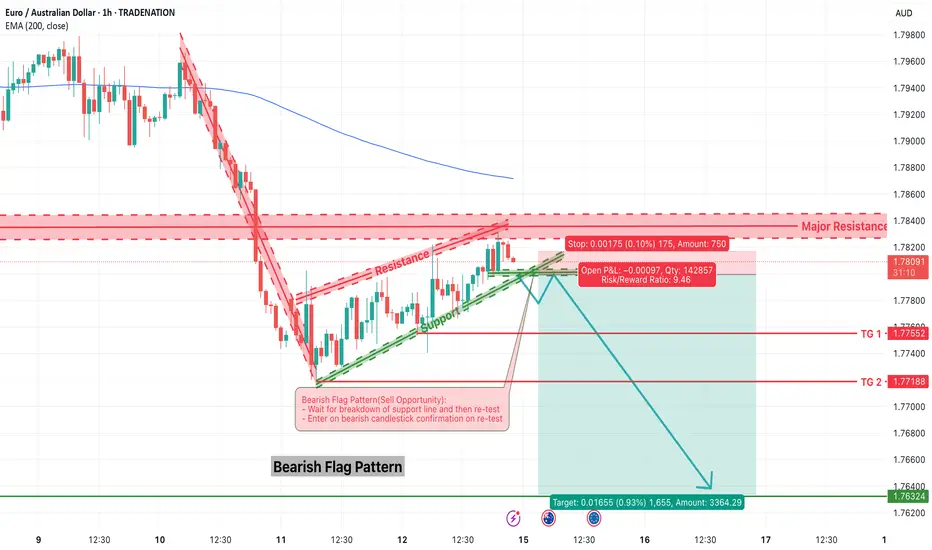
EURAUD – Bearish Flag Breakdown OpportunityThe EURAUD pair is showing signs of trend continuation via a classic bearish flag pattern formation. After a sharp decline, the market has entered into a tight consolidation channel, climbing steadily inside a sloped flag structure. Price is now testing a critical resistance area near 1.7830–1.7840 while hovering just below the 200 EMA.
This setup offers a high-probability sell opportunity — but only after confirmation.
1. Structure Overview
The initial sharp downtrend is followed by a consolidation channel — a textbook bearish flag.
Price is approaching major resistance (1.7830–1.7840) and 200 EMA, acting as a ceiling.
A breakdown from the rising support of the flag is expected to trigger a continuation toward the downside.
2. Trade Plan – Bearish Flag Breakdown
✅ Entry Plan:
Wait for a breakdown of the green support trendline (flag support).
Then, wait for a re-test of the broken support (now resistance).
Enter short only after a bearish candlestick confirmation (e.g., bearish engulfing or rejection wick) on the 15-min or 1-hour chart.
🛡️ Stop Loss:
Place the stop loss just above the major resistance zone, around 1.7835–1.7840.
🎯 Target Zones:
Target 1 (TG1): 1.7755
Target 2 (TG2): 1.7718
Final Target: 1.7632
Risk/Reward Ratio: 1:2, 1:4, 1:9.4+
3. Why This Trade Makes Sense
Bearish Flag is a reliable continuation pattern in strong downtrends.
Price is failing to break above key resistance and 200 EMA.
The flag offers a tight SL and large downside potential — ideal conditions for R:R setups.
Confluence of structure, pattern, and trend all align for short bias.
4. Trade Management Tips
Scale out partial profits at TG1 and TG2, and trail stop for final target.
If breakdown fails, avoid chasing price — re-evaluate bias if price breaks above 1.7840.
5. Final Thoughts
This EURAUD chart is a textbook case of pattern + price action + resistance confluence. The flag structure is well-defined, and the reward-to-risk ratio is significantly favorable if the breakdown confirms.
📌 Watch for:
Breakdown of rising support
Retest and bearish candle
Entry only on confirmation
High-probability setups don’t require prediction — they require preparation.
=================================================================
Disclosure: I am part of Trade Nation's Influencer program and receive a monthly fee for using their TradingView charts in my analysis.
=================================================================
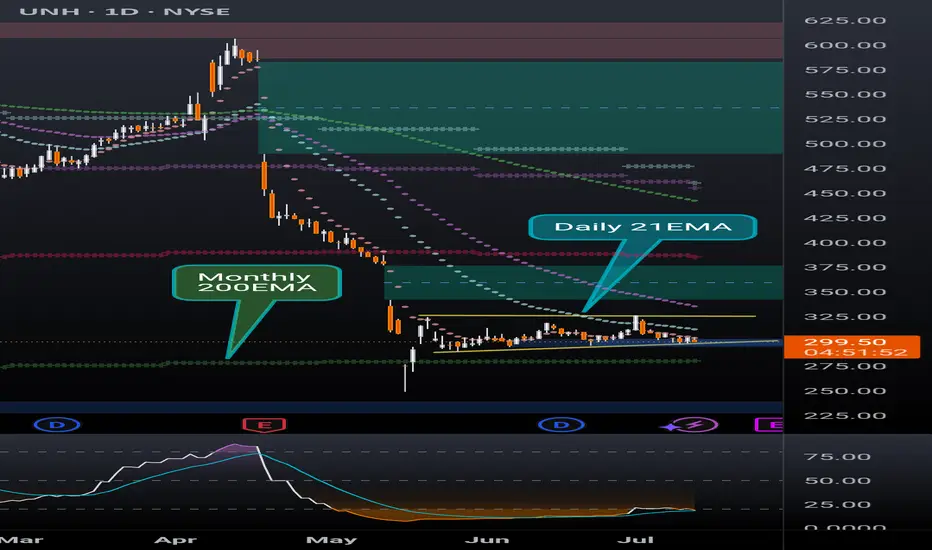
UNH bear flag and gapsUNH has been top of my radar for a bullish reversal. With 2 major gaps to fill after the epic collapse in share price this ticker has a lot of potential. Currently sitting in what appears to be a bear flag, it is holding above the monthly 200EMA (overlayed on this 4H chart). However price recently rejected off the daily 21ema (overlayed on this 4H chart) and if the bear flag is any indicator price may head lower for another liquidity sweep before the inevitable bullish reversal.
A side note: insiders have been buying $millions since the share price collapsed which is always a good indicator of what's to come.
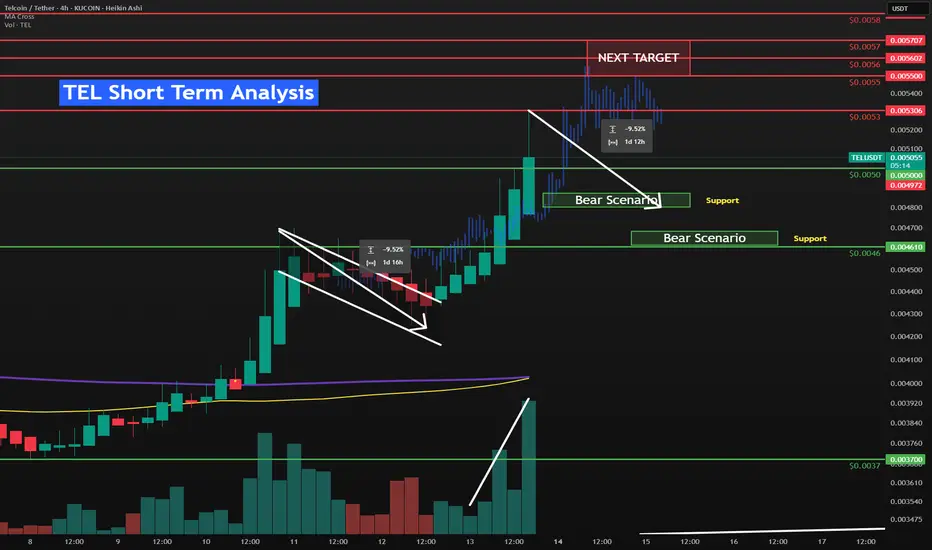
TEL short term to $0.0057 resistance⚡️ NYSE:TEL broke out of the Flag pattern, snatched up the liquidity and broke through multiple short-term resistances between $0.0044 to $0.0052. Finding resistance at $0.0053.
⚡️It is currently retracing down to the 0.382 fib level and the $0.005 psychological resistance that has now become support.
⚡️ NYSE:TEL momentum has increased/sped up as seen by it moving faster than the recent blue bars pattern. I mentioned this in a post two days ago.
TEL Short Term Bull Scenario
🟢$0.0053 is the current key short-term resistance
🟢$0.0057 represents the full repeat of the September 12th 2024 pump that this has appeared to be copying.
🟢🟢The previous rally before the flag was 26% bottom to top. We have room left to get to that before another 10% retracement. We should easily go to $0.0055-$0.0057 from here.
TEL Short Term Bear Scenario
🔴Retrace to around the $0.0048 which is the 0.5 fib retracement, a psychological level and also matches the recent flag pull-back size of 9.5%. There is a bunch of liquidity built up between $0.0047 and $0.0045 but I think that is just risk management at this point.
Liquidation Levels
NYSE:TEL Liquidation Heatmap - It will be interesting to watch the Liquidation Heatmap over the next few hours, as we should see new liquidity appear above the current price.
CRYPTOCAP:BTC has futures liquidity built up at $116k this normally suggests a downward move. I think the Macro factors are too strong for that. But we need time to see the charts print more volume above current price. CRYPTOCAP:BTC is building up liquidity at $123k too but it is less dense.
My thinking is we catch a breather and trade sideways here to solidify this level. Then break through local highs, BTC to break through the $120k psychological level and head up to $123k liquidity then retrace. Which would line up with NYSE:TEL hitting resistance at $0.0057.
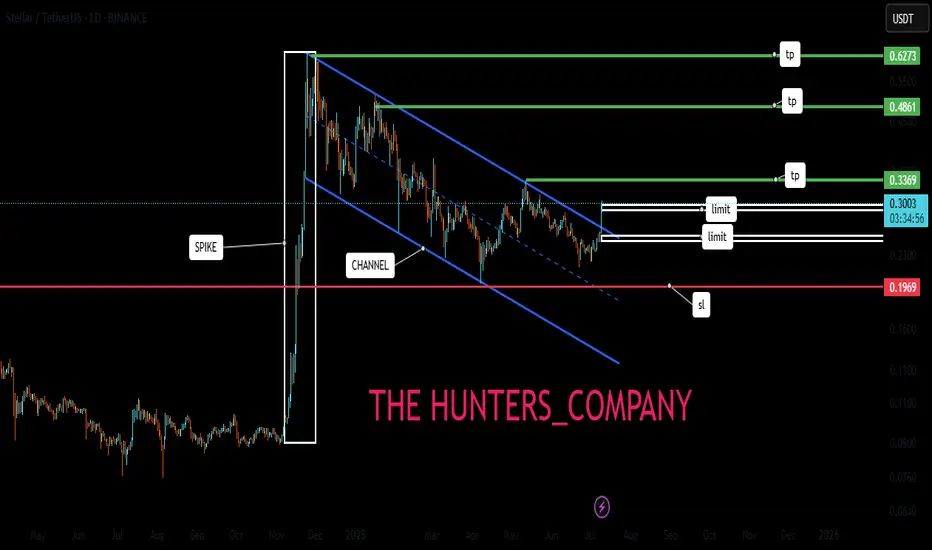
XLM/USDT;FREE SIGNALHello friends🙌
Given the good price growth, you can see that the price has entered a channel, which has caused the price to form a flag...
Now, with a strong channel breakdown by buyers and their entry, you can enter the trade with risk and capital management and move with it to the specified targets.
🔥Join us for more signals🔥
*Trade safely with us*
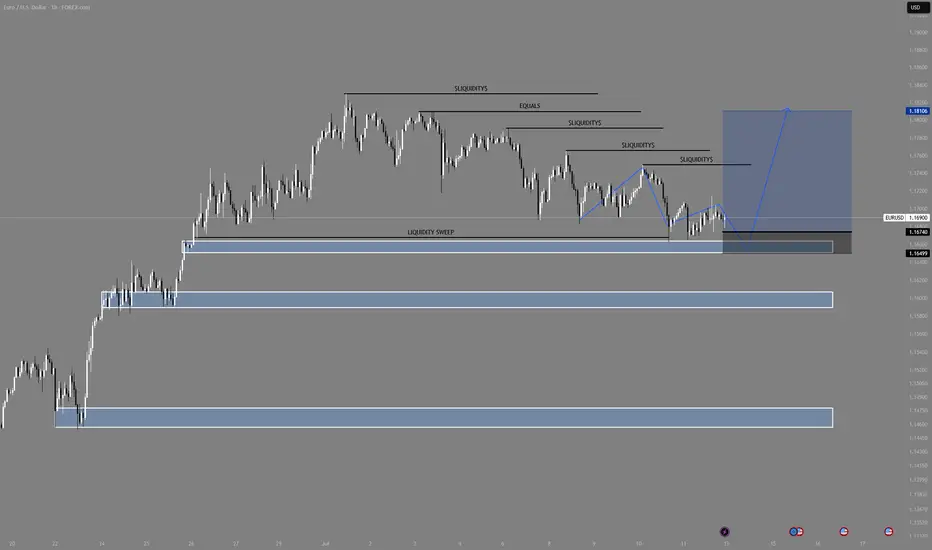
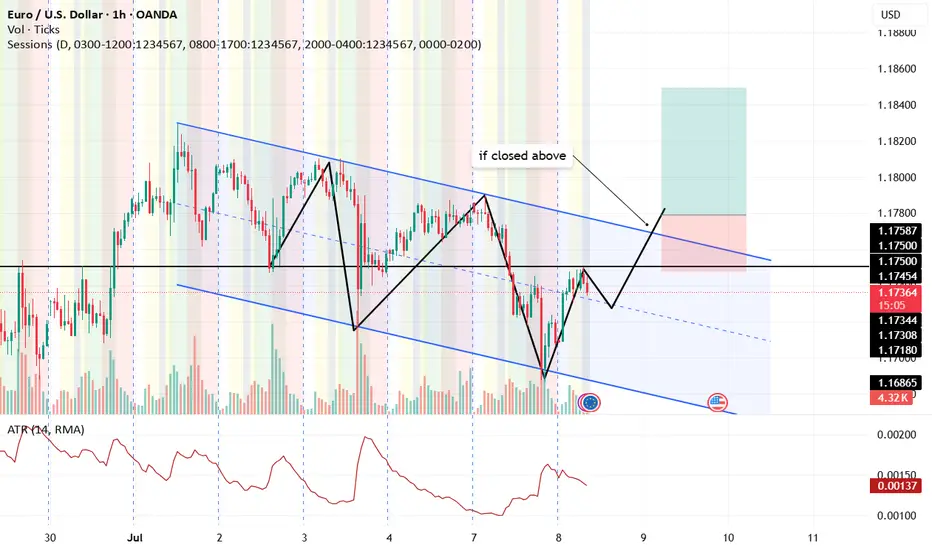
EUR/USD Bullish Continuation SetupMarket Structure Overview:
The market remains in a clear higher timeframe bullish trend, consistently forming higher highs and higher lows. Recently, price has entered a descending channel, resembling a bull flag formation — a classic continuation pattern that typically precedes a strong bullish breakout.
Key Observations:
✅ Descending Channel (Bull Flag): Price is respecting a downward-sloping channel while remaining above key demand zones.
💧 Liquidity Pools: Multiple liquidity highs have been left untouched above — suggesting fuel for a potential impulsive move upward.
🧹 Liquidity Sweep: On both H4 and H1, we see a clear sweep of previous equal lows, tapping into a significant demand zone.
📈 Reaction from Demand: Strong reaction from the demand zone suggests institutional buying interest.
🔵 Projection: A bullish breakout from the flag could target the liquidity above 1.1800, with immediate resistance near 1.1740–1.1760.
Bias:
🔼 Bullish — as long as price holds above the most recent demand zone (~1.1649), the bias remains bullish with expectations of a breakout and continuation toward previous highs.
Note: We must see how the market opens on Sunday night going into Monday. Based on the initial price action, we can determine the best trading opportunities and direction for the upcoming week.
gbp usd bearish flag emergingits like an emerging bearish flage yet to hit the top one more time i expect , since no major news today it can be a valid setup
eur usd bullish flag scenarioas it seem we may have a bullish flag today or tomorrow lets see.
for break out confirmation use 15 min chart, use candle stick patterns and avoid trades on major news out come cuase they can to lead unpredictable result so every analyze can go wrong.. good luck
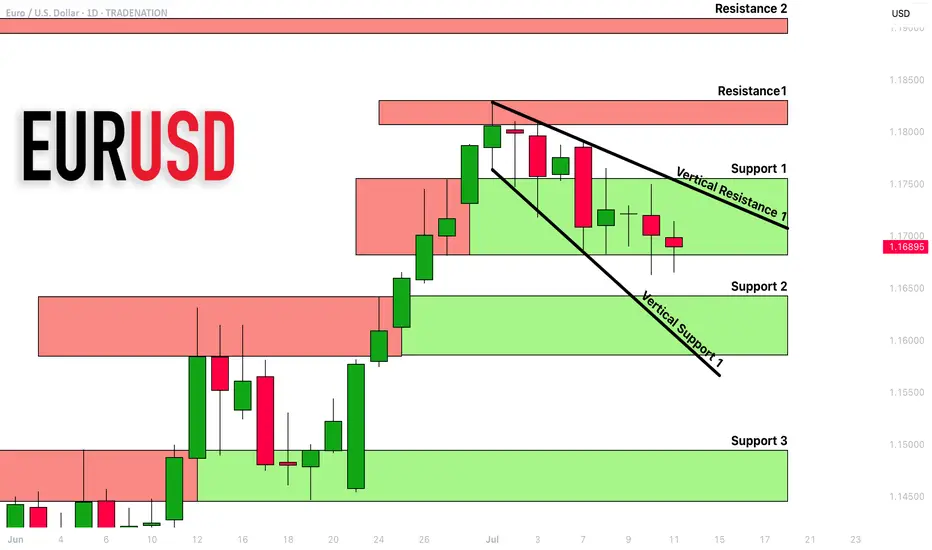
EURUSD: Detailed Support & Resistance Analysis 🇪🇺🇺🇸
Here is my latest structure analysis and important
supports and resistances for EURUSD for next week.
Consider these structures for pullback/breakout trading.
❤️Please, support my work with like, thank you!❤️
I am part of Trade Nation's Influencer program and receive a monthly fee for using their TradingView charts in my analysis.
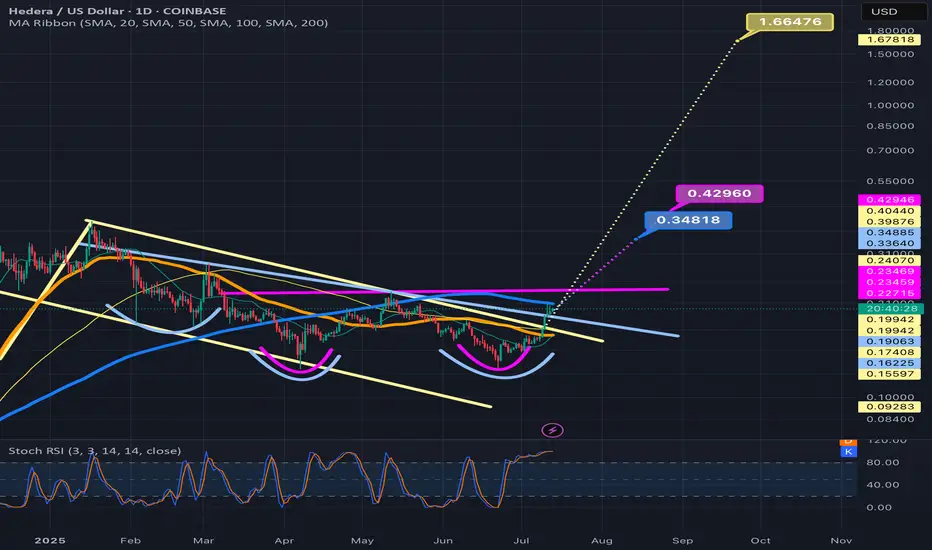
Weekly timeframe version of previous HBARUSD postWanted to show my previous hbar idea which was on the daily time frame on the weekly as well so I could fit the pole of the bullflag in the frame here. I will put a link below to my daily time frame version of this post which goes into slight more detail about each pattern and also the Nvidia hbar news. *not financial advice*
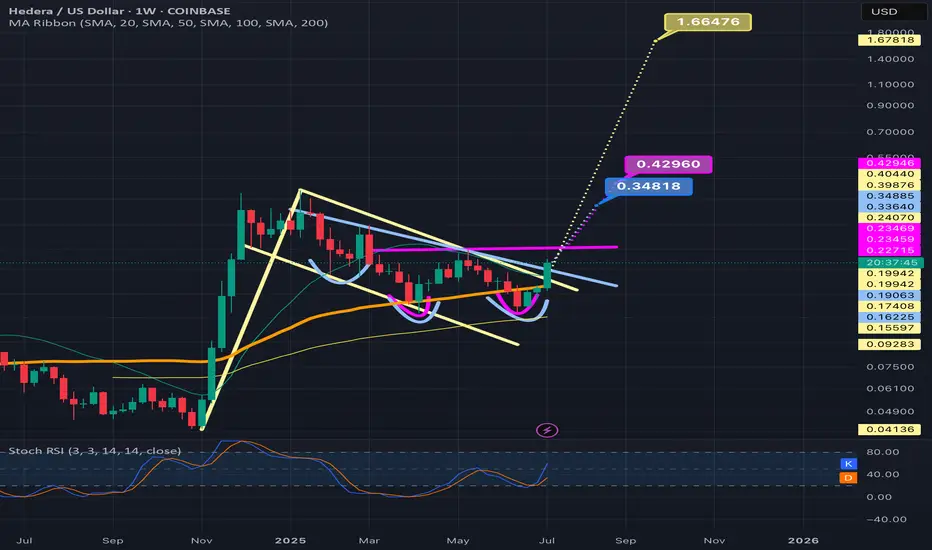
HBARUSD has 3 bullish patterns stacked on top of eachotherThe inverse head and shoulders in the light blue, the light tan is the bull flag, and the pink is the double bottom. Currently price is above the Bullflag and the Inverse head and shoulders pattern. The bullflag also counts as a descending channel pattern as well. We just recently retested the neckline of the inverse head and shoulders as exact wick support which is a good sign. All 3 should provide eachother with the bullish confluence needed for them to be validated, but in addition to this technical bullishness we have some fundamental bullishness occurring just recently too as NVIDIA just announced their new Blackwell chips — claiming them to be the future backbone of AI infrastructure — which are integrating verifiable compute which has its fundamental trust layer built on Hedera. This also provides great bullish confluence and heightens the probability these 3 chart patterns will all be validated and reach their full targets. I will keep updating this post as they do so. *not financial advice*
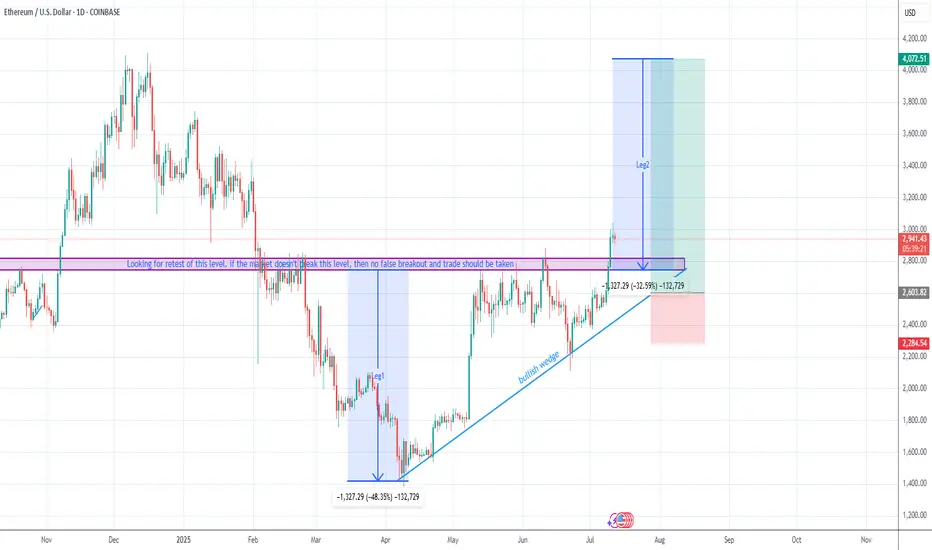
Wajani Investments: ETHUSD Analysis
ETHUSD has currently formed a triangle with a resistance broken to the upside. In most circumstances, I’ll like to wait for a retest of that resistance, i.e. resistance-becomes support to be sure that the breakout was not false. Once that level is tested and held, I’ll take a trade assuming Leg2 would have a similar move like Leg1. This is a very good trade with a 1:4 RR.
If you have any questions, feel free to ask. You can add or subtract from this idea.
Remember, trading always carries risks, and this is for EDUCATIONAL PURPOSES only.
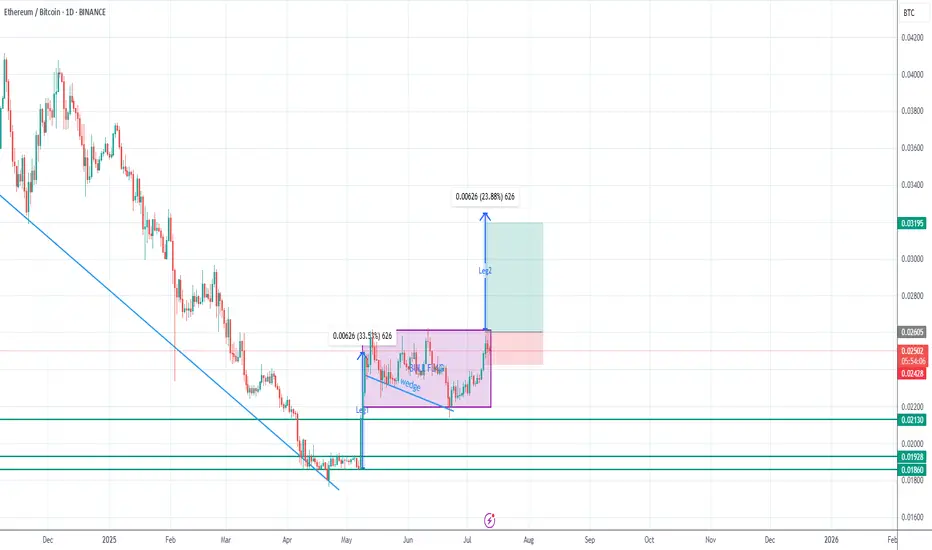
Wajani Investments: ETHBTC Analysis
ETHBTC has formed a bullish flag (rectangle) which signifies trend continuation. Aside from that, there’s a bullish wedge still supporting a move to the upside. This analysis shows we would have a Leg2 move like Leg1 and even higher. This is a good trade with a 1:3 risk.
Remember, trading always carries risks, and this is for EDUCATIONAL PURPOSES only.
Let me know your views.
QBTS massive weekly bull flagLots of eyes on quantum computing these days. Massive bull flag forming on the daily and weekly on QBTS which has already had a great run.
Another ticker with no resistance if/when the breakout occurs.

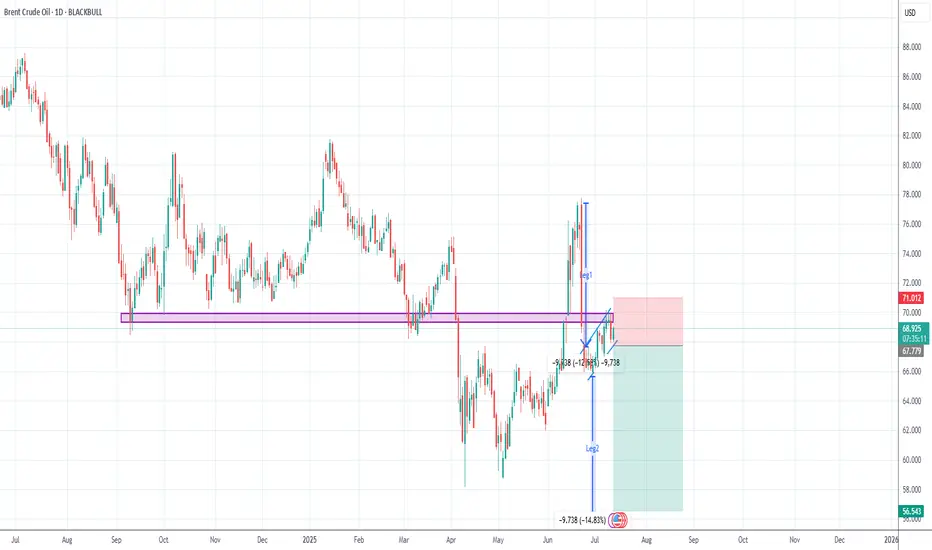
Wajani Investments analysis of BRENT AND WTI BRENT has formed a bearish flag. 80% of the time Leg1 always moves to equate Leg 2. The purple rectangle support turns resistance clarifying to false breakout of BRENT to the upside. However, if it breaks the flag to the upside, treat it as a change in trend.
Trading always carries risk, and this IS NOT A FINANCIAL ADVICE but only for EDUCATIONAL PURPOSES.
Let me know your thoughts.
Thank you.
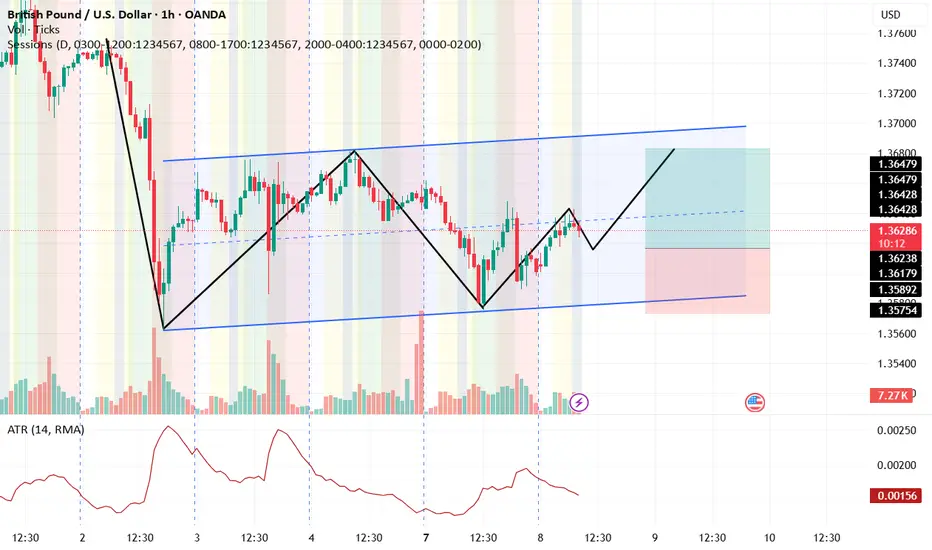
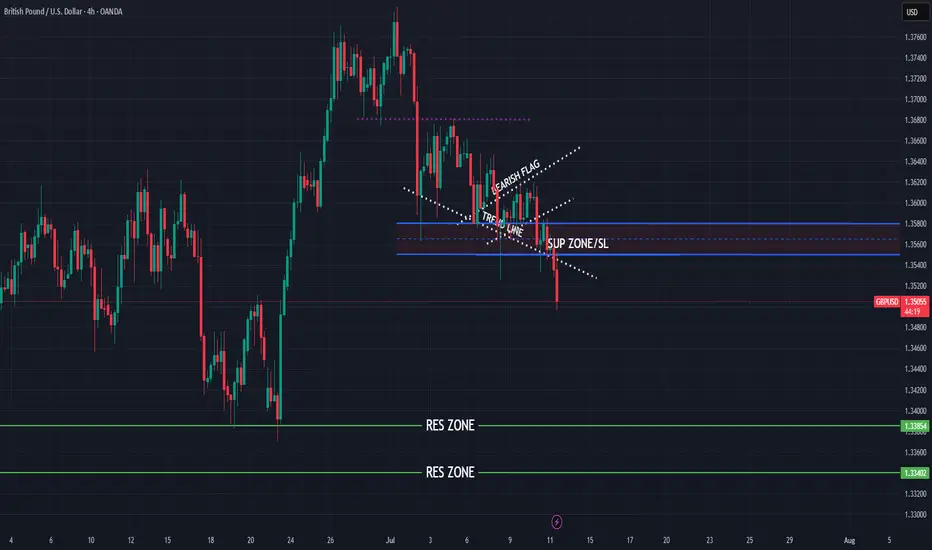
GBPUSD bearish continuation for expect
FX:GBPUSD strong bearish pushing, we can see BEARISH FLAG pat and trend line breaked, here still strong bearish to expect till TPs.
SUP zone: 1.35500
RES zone: 1.33850, 1.33400
XRPUSDT Breaks Out of Bullish Flag - Big Moves Ahead!BINANCE:XRPUSDT has broken out of a classic bullish flag pattern on the weekly chart, signaling a strong continuation to the upside. This textbook setup is known for its high success rate, and the breakout suggests the potential for significant gains if momentum continues.
The CRYPTOCAP:XRP community remains strong, with long-term holders showing confidence and resilience. With the current market structure and support from loyal investors, there’s a real possibility for the price to double from this breakout zone.
The strategy is simple. Buy and hold for the long term. But as always, traders must manage risk carefully and use a proper stop loss. Let the flag fly high. CRYPTOCAP:XRP could be ready for a major pump from this level.
BINANCE:XRPUSDT Currently trading at $2.43
Buy level : Above $2.4
Stop loss : Below $1.9
Target : $5
Max leverage 3x
Always keep stop loss
Follow Our Tradingview Account for More Technical Analysis Updates, | Like, Share and Comment Your thoughts

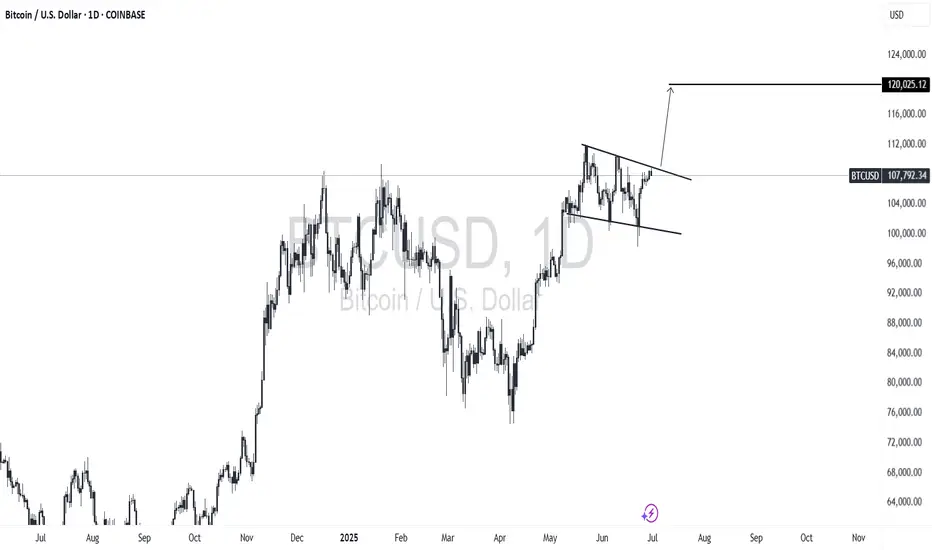
BTC is clearly gearing up for its next big move.Could we see 120k next per the pattern unfolding before us?
It may not (or it could) happen now, but BTC definitely looking BULLISH!
TRADING IDEA - US CRUDE OIL - BEARISH FLAG, CONCERNS ON GLOBAL EFOREXCOM:USOIL
The US Crude Oil prices went down yesterday, mostly because of the tariffs and concerns on demand.
Here is what the Bloomberg is writing: " OPEC+ is discussing a pause in its oil production increases from October is fueling concerns about a slowdown in global energy demand. In addition, the intensification of US tariffs risks slowing global economic growth and energy demand after President Trump ramped up tariffs on numerous countries this week, including a 50% tariff on Brazil."
So, despite the pause in oil production increase, which is supposed to be bullish factor the oil prices, we may see the slowdown in global economy and supposedly a recession because of Trump's tariffs. This is a long-term bearish factor for the oil. I think that we will see another bearish impulse here, according to what we observe on the chart.
There is a nice bearish flag and i am planning to short it with a target nearby 6,540.00 support level.
🔽 a pending sell stop order at 6615.3 with
❌a stop loss at 6680.9 and
🤑a take profit at 6544.0
Trade cautiously! Preserve your deposits!

SMCI BULL FLAG PART 2smci bull flag, reclaimed bullish emas recently, volume starting to come back in, imo has potential to run to 60+

ARE YOU READY FOR 150K+ BTC RALLY !!!BTC has successfully broken out it's bull flag resistance and currently testing above it.
Major resistance resides above is 112K level , if we successfully break and hold above it then easy targets would be 130-150k levels.
Elliott Wave Count final targets 180k level.
If we goes below 106k level then we may see BTC getting into support region of 102-100K region.
For all of this, BTC should remain above 98K level.

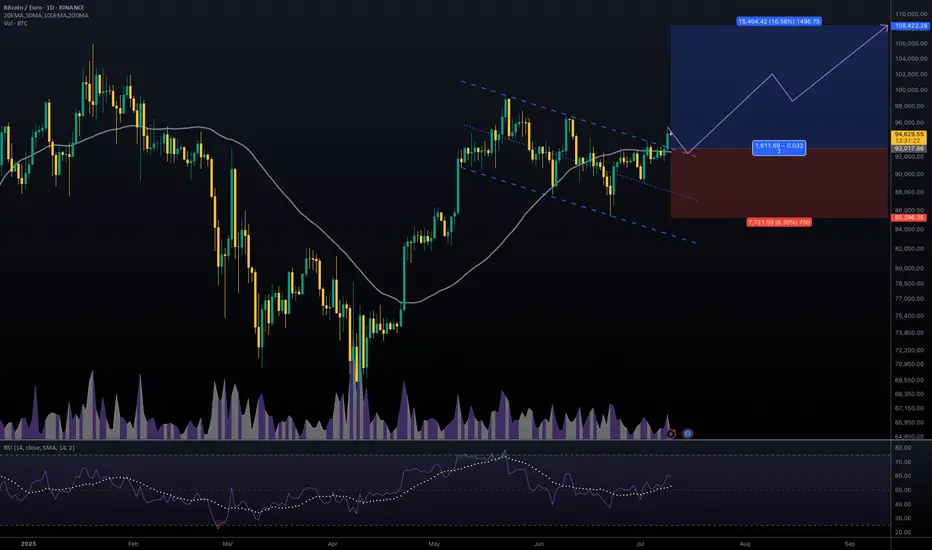
#BTCEUR #1D (Binance) Bull-flag breakout and retestBitcoin looks very good for bullish continuation after regaining 50MA support on daily, against the Euro.
⚡️⚡️ #BTC/EUR ⚡️⚡️
Exchanges: Binance
Signal Type: Regular (Long)
Amount: 12.0%
Entry Targets:
1) 93017.86
Take-Profit Targets:
1) 108422.28
Stop Targets:
1) 85296.36
Published By: @Zblaba
CRYPTOCAP:BTC BINANCE:BTCEUR #Bitcoin #PoW bitcoin.org
Risk/Reward= 1:2.0
Expected Profit= +16.6%
Possible Loss= -8.3%
Estimated Gaintime= 1-2 months