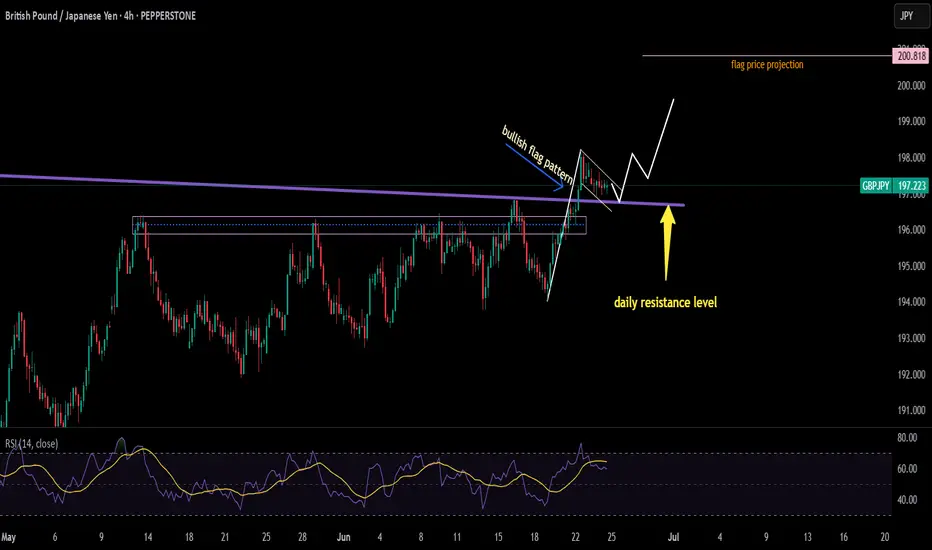
GBPJPY making bullish flag patternafter breaking daily resistance level the price is now retesting it if you open the chart on 1Hr tf you will see that price broke that resistance level with quite strong momentum and is retracing and if it gets a bounce from this level and break the flag pattern strongly then there are high chances that price will meet the price projection of flag pattern as there is no divergence and no other major sign of reversal it seems price action will be bullish
Flag
Nasdaq: Bull flag breakout on daily chart, testing ATHsBeen a while since I last posted. So figured I'd share this quick chart. Market undoubtedly have been incredibly volatile this month. However luckily, the Nasdaq has been forming bull flag on the daily chart. This follows a strong prior uptrend. The breakout took place today, sending the index to test ATHs.
Notable stocks making a move are names like NASDAQ:AMZN and NASDAQ:NVDA , mainly due to the broader market strength. Other indices, such as the S&P 500 ( SP:SPX ) also are breaking out as they form a similar bull flag pattern.
At ATHs, this is a deciding factor of where the market goes next. Either it bounces off to near-term support, or the market rallies to a new all-time high until next cooldown.
Note: not financial advice

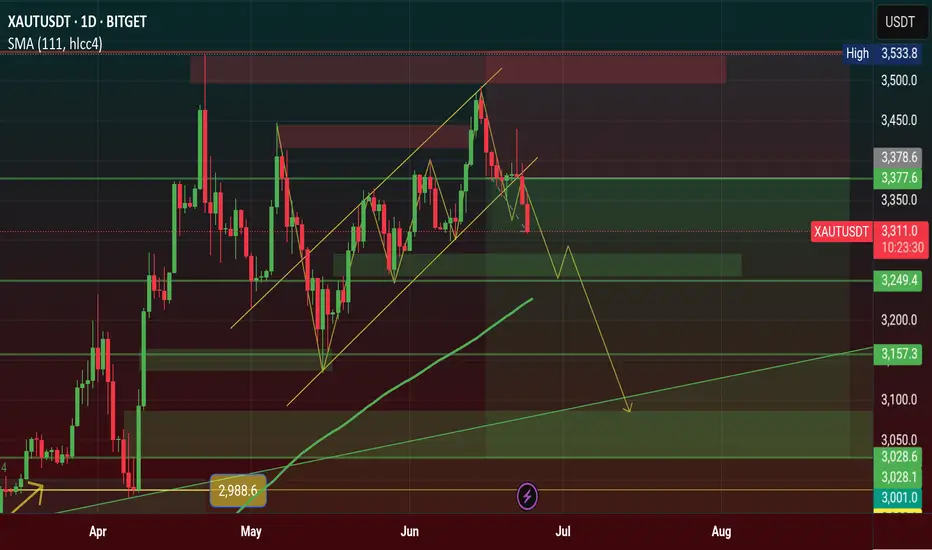
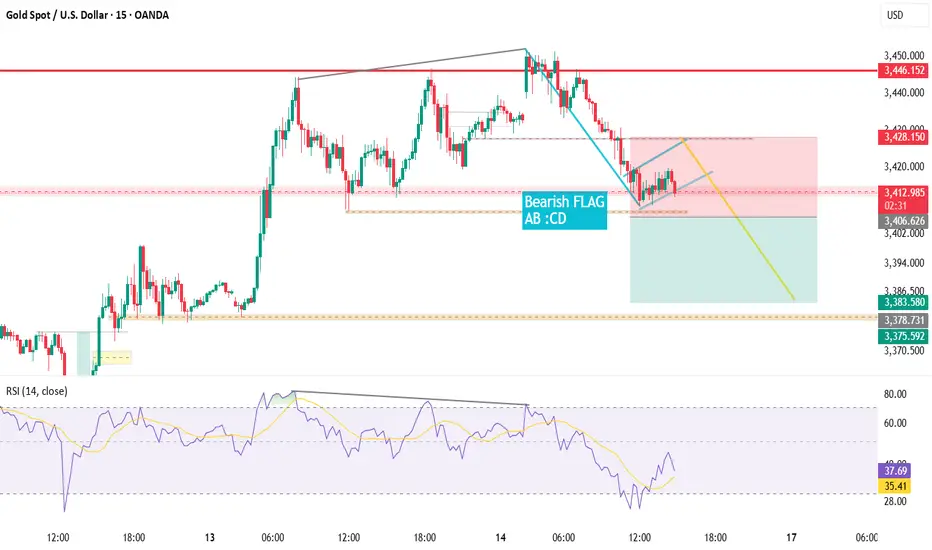
$XAU Showing Bearish Flag Pattearn & Dropped $3K Support area...TVC:XAU Showing Bearish Flag Pattearn & Dropped $3K Support area. Price dropping now and back to $3K price level area. price FVG touch and Strong support $3K Price Level area. Here is many support Holder.
Stoploss: $3,536
Entry: $3,377
1st Target point $3,377
2nd Target point $3,249
3rd Target point $3,028
Disclaimer: This article is for informational purposes only and does not constitute financial advice. Always conduct your own research before making any investment decisions. Digital asset prices are subject to high market risk and price volatility. The value of your investment may go down or up, and you may not get back the amount invested. You are solely responsible for your investment decisions and Binance is not available for any losses you may incur. Past performance is not a reliable predictor of future performance. You should only invest in products you are familiar with and where you understand the risks. You should carefully consider your investment experience, financial situation, investment objectives and risk tolerance and consult an independent financial adviser prior to making any investment.
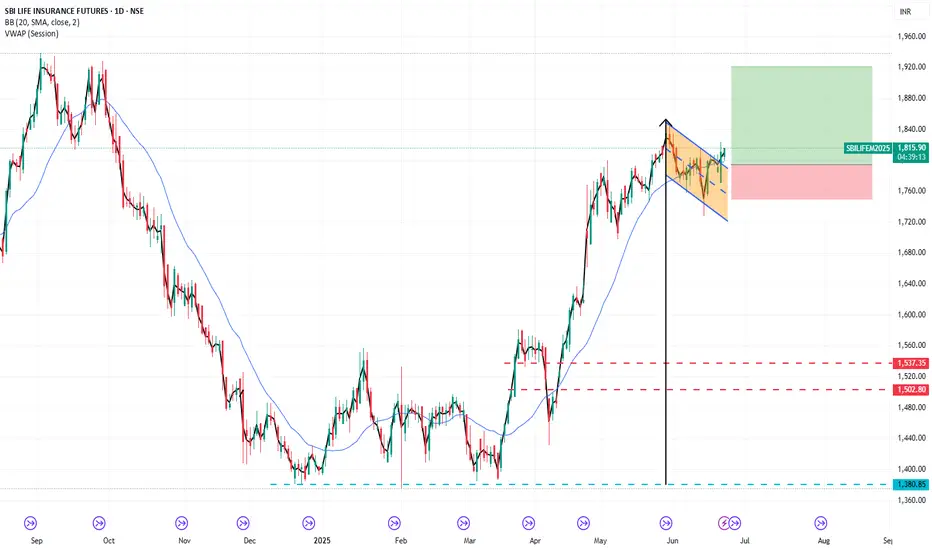
FLAGFlag Breakout :- Sbilfe broke out of flag pattern on daily charts on friday, retested break out zone, with all indicators suggesting buy.
i:e Acc:- 240 m
Rsi :- 64.40 above 40
OI :- 2.10%
Macd comforably above 0 line.
Could b bough wih mentioned stoploss & target.
FLAGPIIND fut made flag n pole pattern after consolidation on daily hourly charts with all 4 indicators suggesting long.
Accum/Dist :- 4.40 m
OI :- -9.91% (short covering)
RSI:- 69
MACD :- 68
Could b bought wih stoploss of 4075 & target of 4235.

USDJPYLooking at this chart after I just did the EURJPY analysis, now this one looks more bullish than bearish BUT that's only if there is a breakout from the supply zone which Im assuming will give us a consolidation first before it shoots straight up to complete Wave 5. At the completion of Wave 5, we can expect the drop again as a correction and retest, which should usher in more buyers to form a Cup and Holder pattern. I really see the JPY being stronger than USD futuristically and practically.

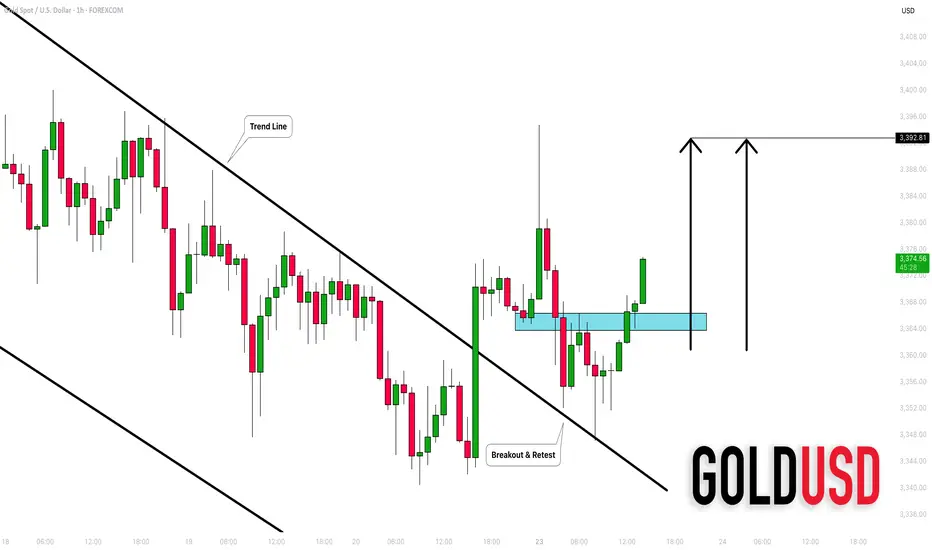
GOLD (XAUUSD): Intraday Bullish Confirmation
Gold is retesting a recently broken trend line of a bullish flag
pattern that I shared with you earlier.
A double bottom pattern on that and a violation of its neckline
provide a strong intraday confirmation.
I think that the price may rise to 3392 level.
❤️Please, support my work with like, thank you!❤️
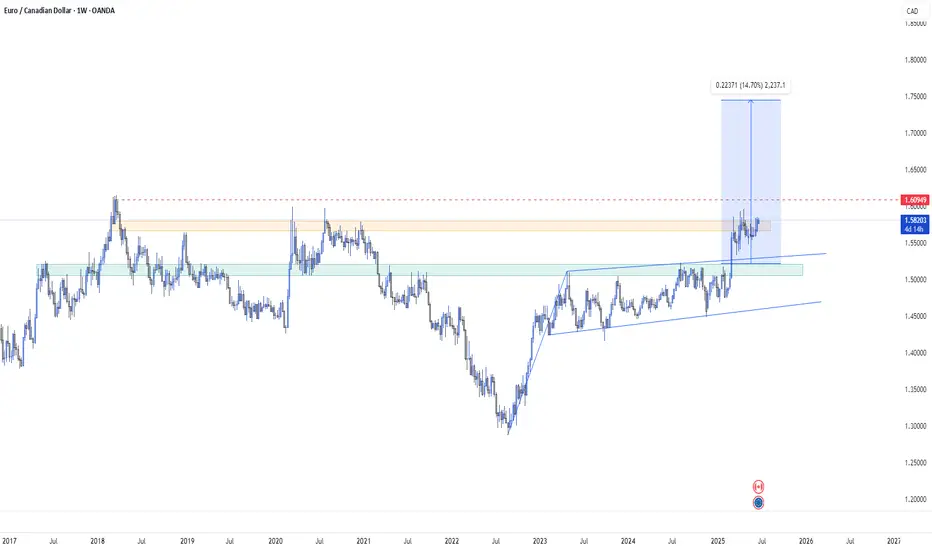
EUR/CAD Weekly – Bull Flag Breakout with Macro Tailwinds Technical Structure:
The sharp rally from mid-2022 to early 2024 forms the flagpole.
The tight, downward-sloping consolidation (roughly mid-2023 to early 2025) forms the flag.
The recent breakout above the 1.5800–1.6000 zone confirms the flag breakout.
📊 Key Bull Flag Characteristics Met:
Prior strong impulsive move (flagpole)
Consolidation downward/slightly sideways in a tight range (flag)
Breakout with momentum above flag resistance
🌍 Fundamentals Confirm the Technical Picture:
As outlined previously, the macro environment aligns perfectly with this bullish breakout:
🔹 Euro Strength:
ECB is easing cautiously — still relatively hawkish vs peers.
Inflation remains sticky, reducing pressure for rapid cuts.
Eurozone economic data is stabilizing, especially in manufacturing.
🔻 Canadian Dollar Weakness:
Falling oil prices hurt CAD (Canada is a petro-currency).
BoC is dovish and may begin rate cuts sooner.
Domestic economic data (housing, retail) shows cracks.
🧭 Final Summary:
✅ Flag Breakout Thesis
✅ Bull flag structure validated
✅ Clean breakout and momentum
✅ Macro drivers support sustained upside
🔔 Key Levels:
Breakout Zone: 1.5800–1.6000
🔔 What to Watch Next:
ECB July meeting commentary
Canadian employment and CPI data
Crude oil weekly inventory reports
Risk-off sentiment (which usually supports EUR over CAD)
📈 Target Projection:
If 1.6000–1.6095 breaks, we look for:
🎯 Target: 1.72 – 1.74 (mid to late 2025)
🔰 Invalidation: Break back below 1.5250
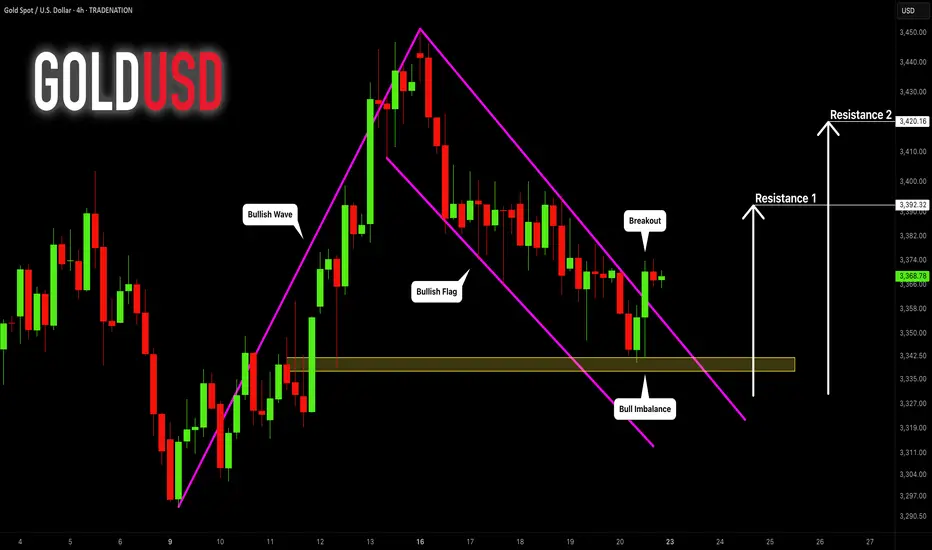
GOLD (XAUUSD): Bullish Move After Opening?!
I think that there is a high chance that Gold will have a bullish opening.
The market closed, breaking a resistance line of a bullish flag pattern
on an hourly time frame.
Fundamentals strongly support this bullish outlook.
Resistance 1: 3392
Resistance 2: 3420
❤️Please, support my work with like, thank you!❤️
I am part of Trade Nation's Influencer program and receive a monthly fee for using their TradingView charts in my analysis.
BTC is expected to give move by mid or end of July 2025BTC is expected to make a move by mid or end of July 2025
BTC is forming a Bullish Flag Pattern, and it is expected to give a breakout from this flag, by mid or end of July.

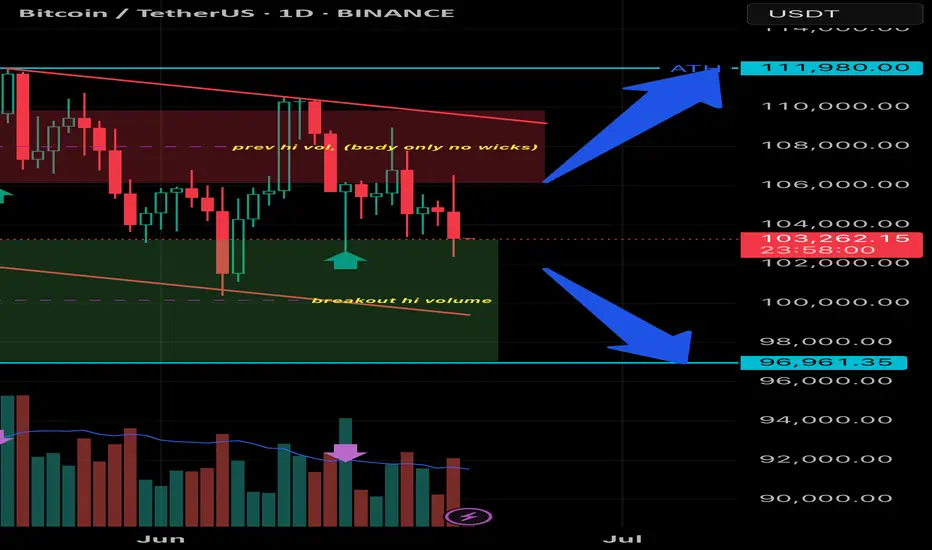
BTCUSD 1D | big consolidation
🧠 1. Pattern and Market Structure Identification
✅ Trend and Pattern: Bullish Flag
• Structure: Price forms a descending consolidation pattern (descending channel) after a sharp upward impulse — this is a classic characteristic of a bullish flag.
• Breakout volume occurred from the consolidation zone near the green support area → an early signal that bulls are active.
• However, the price is currently retesting the breakout area and is testing the demand zone again.
📊 2. Volume Analysis
• Volume spikes (purple arrows) occurred at several key points:
• Initial breakout
• Support retest
• High volume during the breakout = valid breakout confirmation.
• Currently, volume is slightly declining = a signal of consolidation and possible accumulation.
📉 3. Support & Resistance Levels
• Strong Support: 96,961 USDT (marked by the blue line and breakout volume).
• Major Resistance: 111,980 USDT (all-time high and projected target from the flag breakout).
• Current Price: 103,272 USDT → sitting between these two key levels.
🎯 4. Potential Price Direction
Bullish Scenario:
• If the 96,961 USDT support holds, price could continue upward → the bullish flag target = projected height of the flagpole.
• Conservative Target: 111,980 USDT (ATH)
• Aggressive Target (if ATH breakout occurs): 115,000+ USDT
Bearish Scenario:
• If price breaks below 96,961 USDT with strong volume, it could invalidate the bullish pattern and drop further to the 92,000 – 90,000 USDT range.
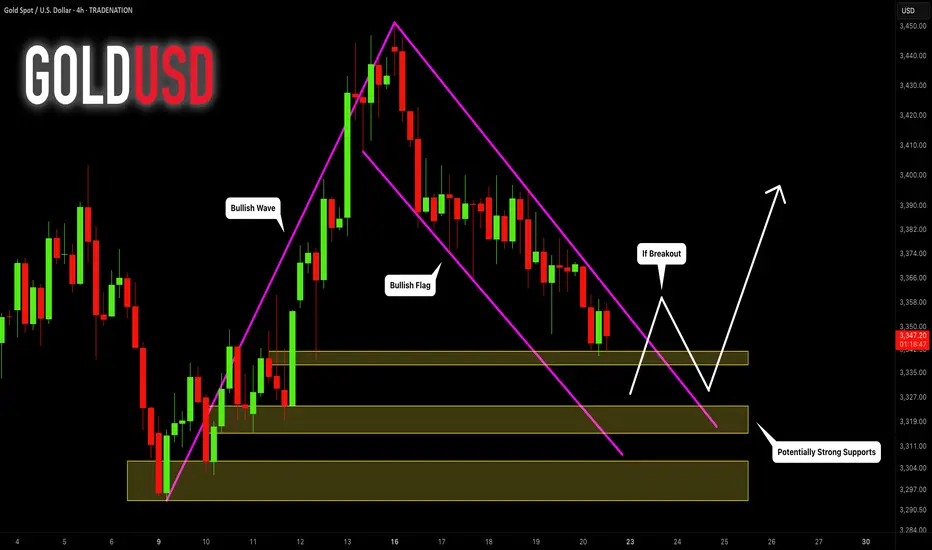
GOLD (XAUUSD): Technical Analysis & Important Pattern to Watch
For some known reason, Gold remains bearish this entire week.
The market is currently correcting within a falling channel - a bullish flag on a 4H time frame.
Ahead, I see a bunch of strong intraday supports.
From one of these structures, a bullish rally may resume.
A trigger that you should look for is a bullish breakout of
a resistance line of the flag and a 4H candle close above that.
A bullish continuation will be expected then.
❤️Please, support my work with like, thank you!❤️
I am part of Trade Nation's Influencer program and receive a monthly fee for using their TradingView charts in my analysis.
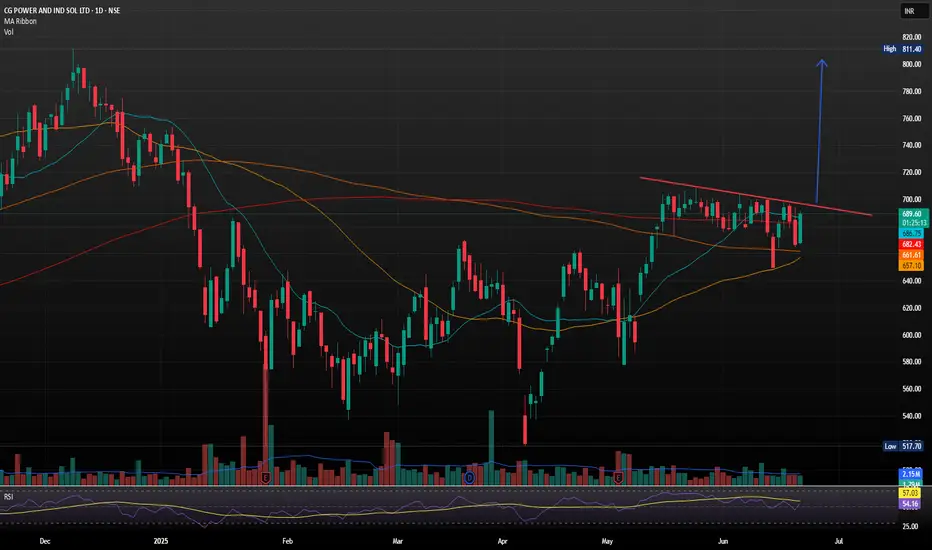
CG Power and Industrial Solutions with Strong Bullish Flag SetupCG Power and Industrial Solutions just landed its largest-ever single order a 641 crore contract from Power Grid Corporation of India Ltd (PGCIL) for high-voltage transformers and reactors
The company, now under the Murugappa Group, reported consolidated FY25 revenues of 9,909 crore. However, annual profit dipped to 972.98 crore from 1,427.61 crore in FY24, despite a strong Q4 showing with a 17% YoY rise in net profit to 274.26 crore.
- Inverse Head & Shoulders Breakout: The stock recently broke out of an inverse H&S pattern, a classic bullish reversal signal, with strong volume confirmation. Holding above 690 could push it toward 750 TO 800.
Support & Resistance Levels
- Support: 663–679 demand zone
- Resistance: 694, 704 and 712
Trend Summary
- Short-Term: Neutral to bullish
- Medium-Term: Bullish bias if it sustains above 690
- Volatility: Elevated, so expect sharp swings
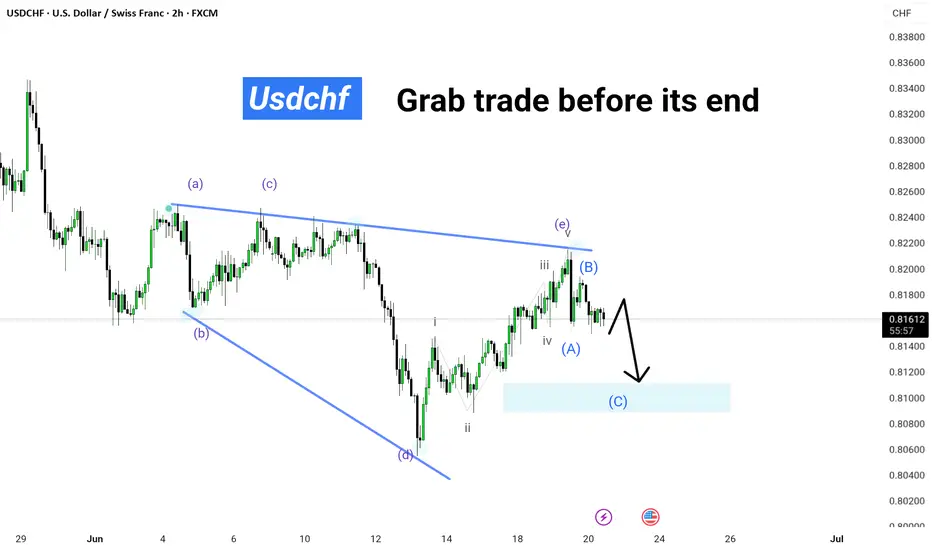
USDCHF || Grab trade before its end" – Upgrade Suggestions:" USDCHF correcting into demand zone 📉 Wave (C) incoming! Watch for the final leg before the reversal. Don’t miss this precision setup. 💥 #ElliottWave #USDCHF #ForexSetup"
🟢 Technical Breakdown:
Triangle Formation (ABCDE) completed near the top.
Price action shows a breakdown from Wave (B), suggesting a corrective leg is underway.
You’ve marked:
Wave (A) and (B) already formed.
Wave (C) is expected to reach the highlighted demand zone (blue box around 0.81000).
The current price is around 0.81633, indicating an ideal entry area for a short setup targeting the blue zone.
Imbalance, FVG & Short Trend Flag Strategy / Estrategia basada..*************************
* ENGLISH VERSION *
*************************
This analysis blends institutional structure with price action to identify high-probability zones on AMZN.
🔍 Setup Structure:
Imbalance breaks PH/L of the trend: Confirmation of institutional strength breaking a Previous High or Low, creating a liquidity imbalance.
Short Trend Flags: A corrective flag pattern within the impulse move, signaling continuation until the Fair Value Gap (FVG) is filled.
FVG Closure: Validates key zones where price must return to restore market balance.
IFVG: Institutional Fair Value Gap that also needs to be closed, showing deeper order flow activity.
Key Resistance & Support Zones: Act as liquidity magnets where price often reacts.
9:30am Opening Candle Against the Trend: This candle acts as a liquidity trap and potential reversal trigger.
🧠 Technical Notes:
FVG and IFVG used as targets and reaction zones.
Confirmation through opening volume and candlestick behavior.
Flags serve as entry triggers in trend direction.
🎯 Perfect for scalpers and day traders who trade clean structure with multi-layered confirmations (structure + liquidity + reaction).
*************************
* SPANISH VERSION *
*************************
Este análisis combina estructuras institucionales con acción del precio para identificar zonas de alta probabilidad en AMZN.
🔍 Estructura del Setup:
Imbalance rompe PH/L de la tendencia: Confirmación de fuerza institucional al romper un Previous High/Low, generando desequilibrio de liquidez.
Short Trend Flags: Patrón correctivo dentro del impulso que sirve como señal de continuación hasta cerrar el FVG (Fair Value Gap).
Cierre de FVG: Validación de zonas de interés donde el precio debe retornar para balancear el mercado.
IFVG: Imbalance Fair Value Gap que también necesita ser cerrado, indicando profundidad institucional.
Zonas clave de resistencia y soporte: Actúan como imanes de liquidez donde el precio suele reaccionar.
Apertura 9:30am contra la tendencia: Vela que actúa como trampa de liquidez y posible gatillo para reversión.
🧠 Notas Técnicas:
Uso de FVG y IFVG como targets y zonas de reacción.
Confirmación con el volumen de apertura y comportamiento de las velas.
Flags como patrón de entrada para seguir la dirección dominante.
🎯 Ideal para scalpers y day traders que siguen estructuras limpias con validaciones múltiples (estructura + liquidez + reacción).

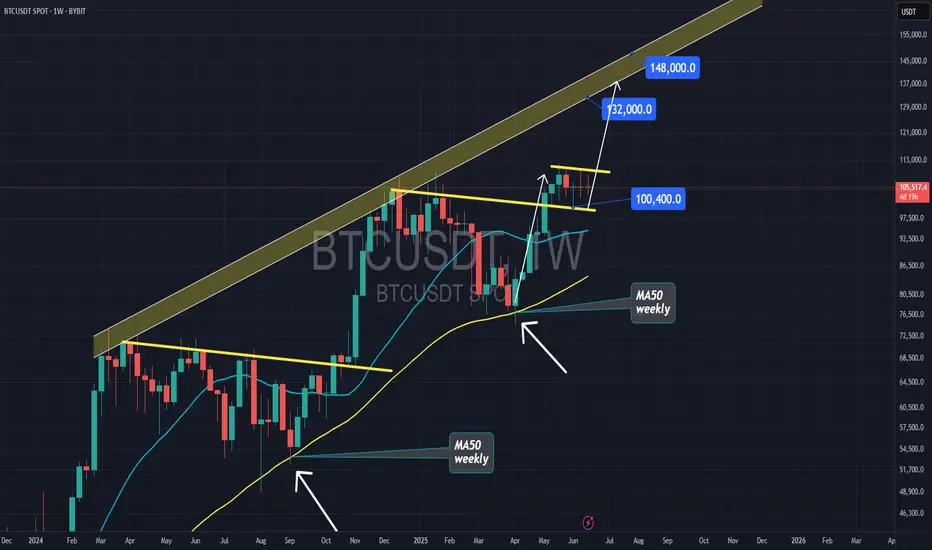
weekly BULL-FLAG!it looks like after the rally bitcoin had since early April, now this is a bull-flag pattern on weekly and that can push bitcoin to $140k.
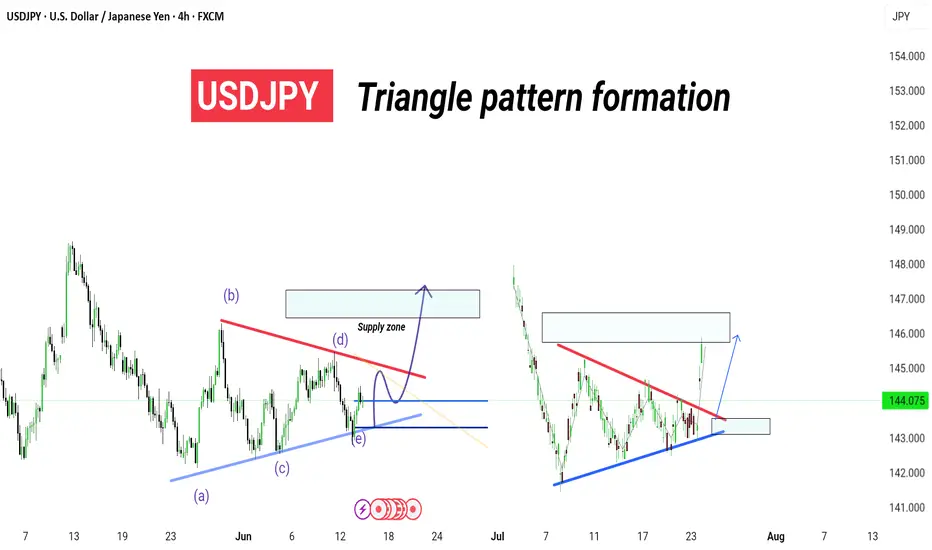
USDJPY – 4H . [[ TRIANGLE PATTERN ]]Technical Breakdown:
Symmetrical triangle pattern clearly formed with clean ABCDE wave structure.
The price has broken out from the upper resistance (trendline), confirming a bullish breakout scenario.
Next key area to watch is the supply zone near 145.800 – 146.200, where price may either:
Face resistance and retrace,
Or break through for continuation.
---
🔍 Key Levels:
Support Base (Retest zone): ~143.000
Breakout Entry Trigger: Above 144.200
Supply Zone Target: 145.800 – 146.200
Invalidation Level (Break Below Triangle): <142.500
---
🧠 Analysis Insight:
This is a classic triangle consolidation breakout, with price respecting both ascending and descending boundaries before thrusting upward.
Look for possible pullback retest entries before continuation to the supply zone.
Volume and momentum confirmation on breakout is key for sustainability.
---
🎯 Strategy Note:
Use low-risk entry setups on breakout retest.
Ideal for scalp to swing trades, with strong risk-reward structure.
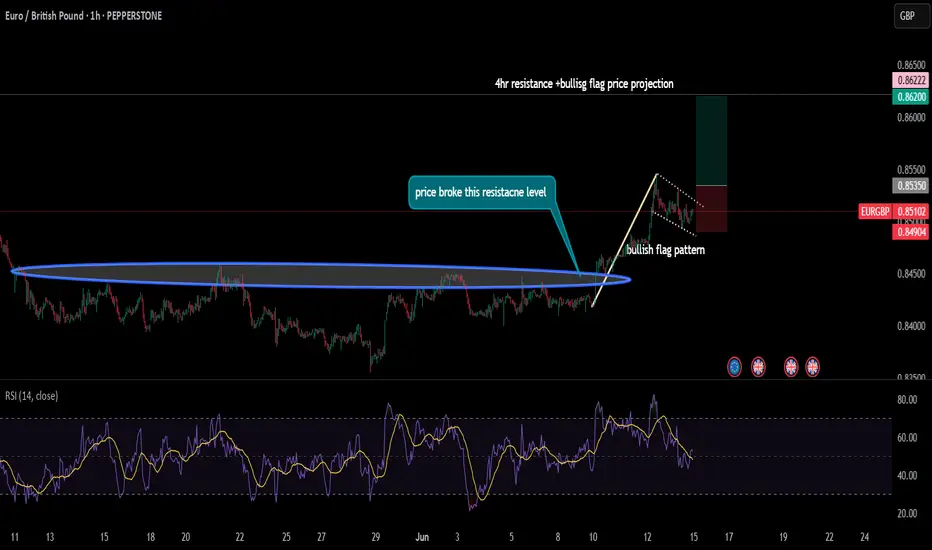
EURGBP making bullish flag patternas price has broken drawn resistance level and after that it moved upwards nicely and now the price action is making bullish flag pattern as currently there is no divergence which indicate the trend will likely continue and will hit next resistance level which is also price projection of flag pattern
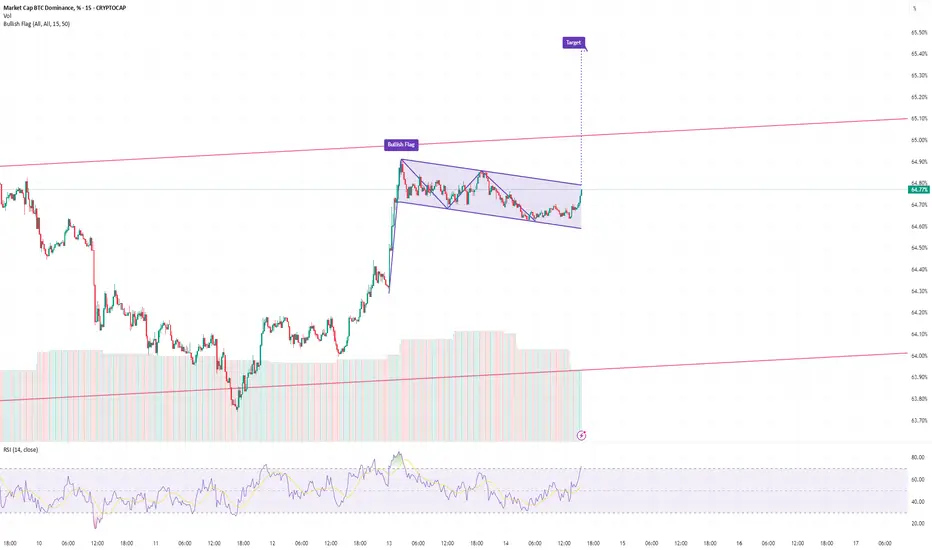
BTC Dominance Looking very bullish CRYPTOCAP:BTC.D should go up towards 66% and expect the CRYPTOCAP:OTHERS to take a hard dump. Bull flag pattern in the short term.
BRENT CRUDE OIL Long Positionafter making a high of 76.45 brent has posted a potential HL t 71.3 and now forming a bullish flag if it breaks the pole then it can futher go high, we will make entry at 76.5 at pole breakout by making SL at 71.3 nd TP at 81.7

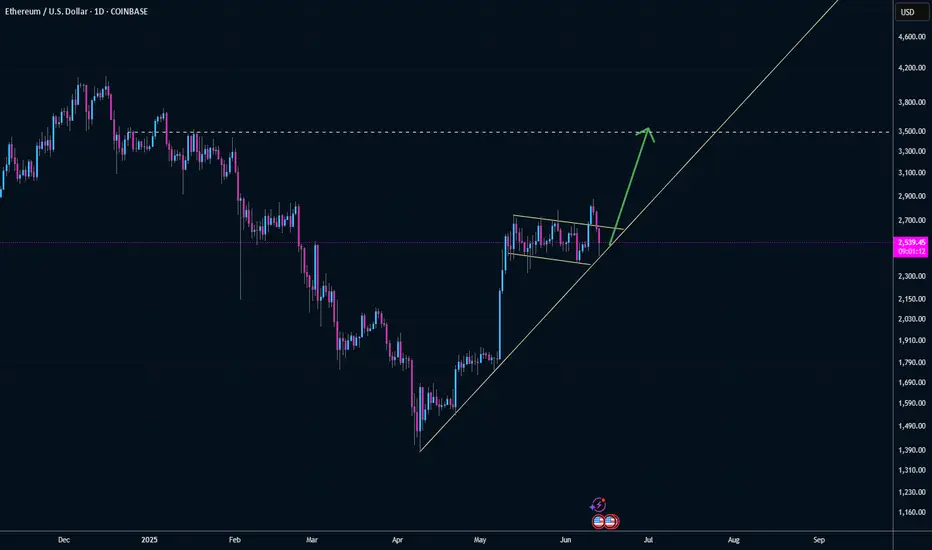
Retest Flag and Continue Breakout $3500I think this pullback mainly driven by middle east uncertainty is a great gift to buy the pullback on BITSTAMP:ETHUSD
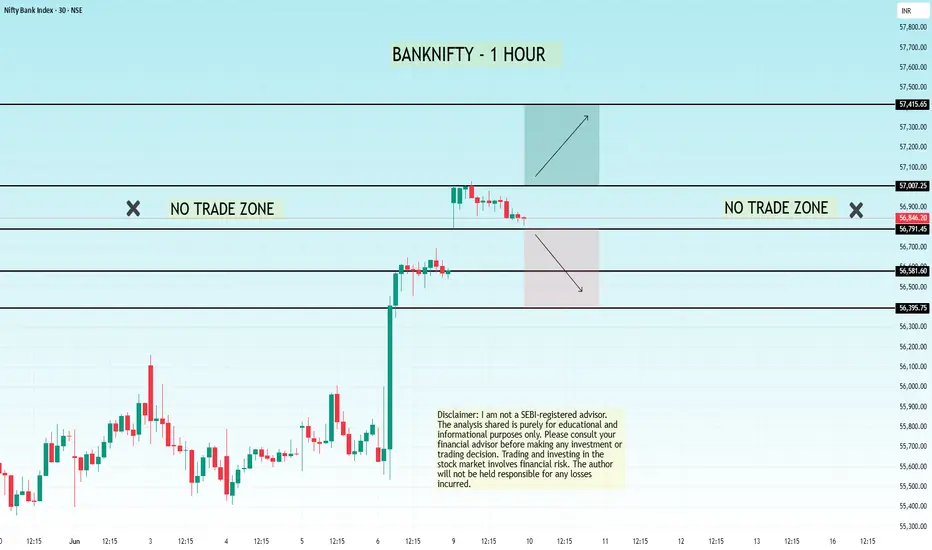
#banknifty - 10th June! NSE:BANKNIFTY NSE:BANKNIFTY1!
Understand the chart, observe the analysis, implement while trading:
Key Observations:
1. Trendlines:
- Resistance Trendline: A descending trendline (sloping down) marks the area where the price faces selling pressure. This indicates a pattern of lower highs.
- Support Trendline: An upward-sloping trendline beneath the price indicates where the price finds buying interest. This suggests a slight upward momentum at the support level.
2. Consolidation Zone:
- The price is moving within a tightening range between these two trendlines, forming a wedge or triangle pattern. This indicates consolidation, where the market is waiting for a breakout or breakdown.
3. Support Levels:
- Key support levels are highlighted at 53,407.75, 53,229.05, 53,057.45, and 52,784.15. These levels represent zones where buyers are likely to step in and prevent further price decline.
4. Resistance Levels:
- Resistance levels are marked at 53,679.35, 53,956.65, 54,128.90, and 54,304.25. These are zones where the price may face selling pressure.
5. Current Price Action:
- The price is currently at 53,577.70, approaching the descending resistance trendline. This is a critical point because it suggests a decision zone for the next move.
Scenarios:
1. Bullish Breakout:
- If the price breaks above the descending resistance trendline, it could signal bullish momentum.
- Potential targets are the next resistance levels at 53,956.65, 54,128.90, and 54,304.25.
2. Bearish Breakdown:
- If the price breaks below the support trendline, it may indicate a bearish trend.
- Possible downside targets are the lower support levels at 53,229.05, 53,057.45, and 52,784.15.
3. Neutral Consolidation:
- If the price continues to move within the wedge, traders may need to wait for a clear breakout or breakdown before acting.
What This Chart Suggests:
- The chart highlights decision points for the market, with the wedge pattern indicating an imminent breakout or breakdown.
- A breakout above resistance would suggest strength, while a breakdown below support would indicate weakness.
Trading Plan:
- For Buyers: Wait for a breakout above the resistance trendline and aim for higher resistance levels.
- For Sellers: Look for a breakdown below the support trendline and target the lower support zones.
Not SEBI Registere.