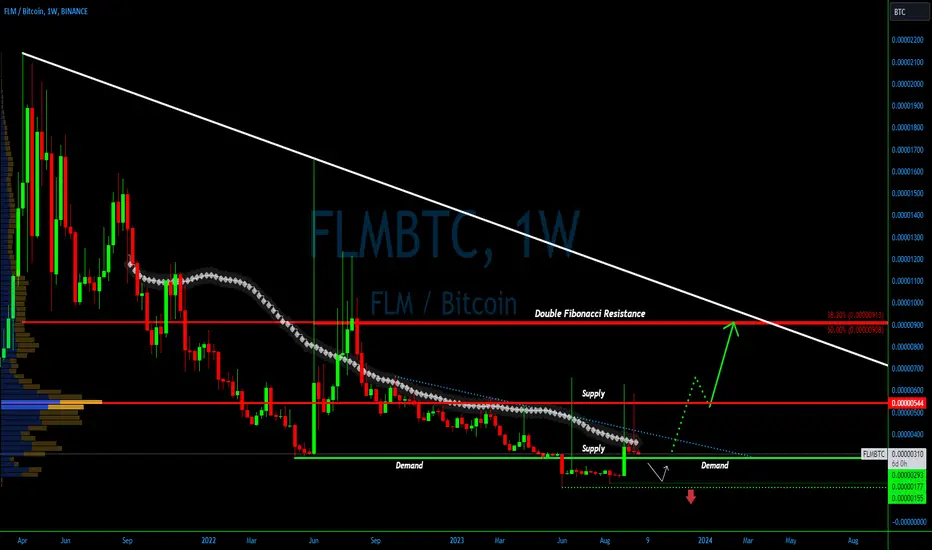
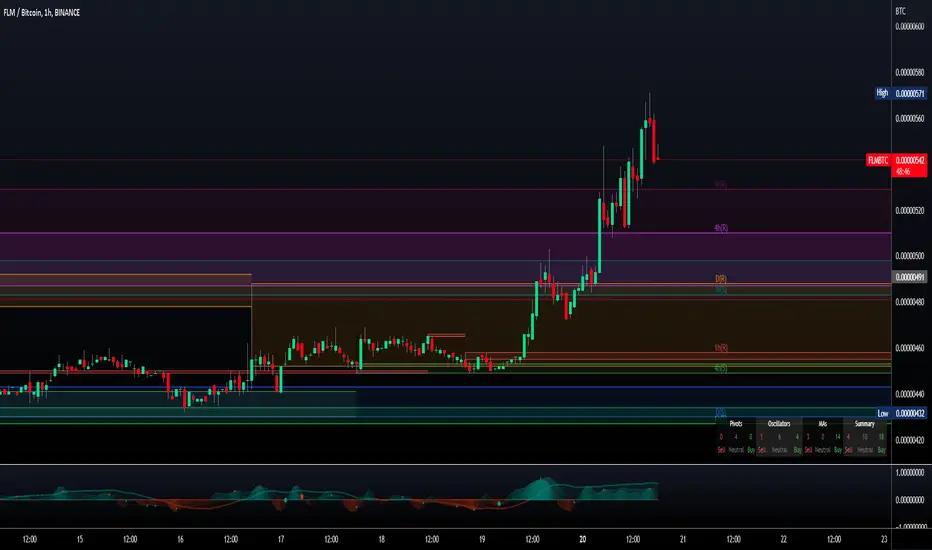
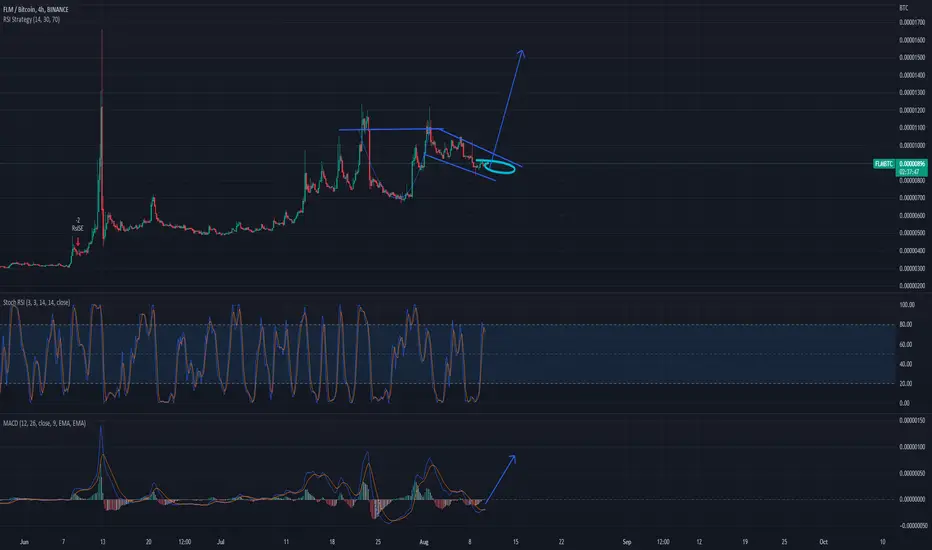
FLMBTC Next Bullish Signals💎A few weeks ago, #FLMBTC accomplished a significant feat by closing above a critical supply zone on the weekly chart, hinting at the possibility of a bullish reversal. However, it's crucial to exercise caution and seek further confirmations to enhance the probability of this outlook. Specifically, the MCP team is closely monitoring the current demand area. Should this area hold, it could pave the way for an upward surge, breaking through several pivotal resistance indicators. These key resistance points include the 50 Simple Moving Average (SMA), the downtrend trendline, and the Volume Profile resistance.
💎A notable observation is that all these resistance indicators have acted as formidable barriers during potential upward rallies. Therefore, the next significant bullish signal would be the breach of both the 50 SMA and the downtrend trendline. Subsequently, surmounting the Volume Profile resistance at 544 Satoshis would be a decisive turning point, potentially ushering in a long-term bullish trend. In such a scenario, we anticipate #FLM to embark on a journey towards the double Fibonacci resistance level around the 900 Satoshis area, signifying a remarkable 200% increase against #Bitcoin.
💎However, it's imperative to maintain a watchful eye on the current demand area, particularly on the weekly timeframe. If the weekly closing price dips below the critical level of 308 Satoshis, it would raise concerns of a prolonged downtrend or an extended consolidation phase.
FLM
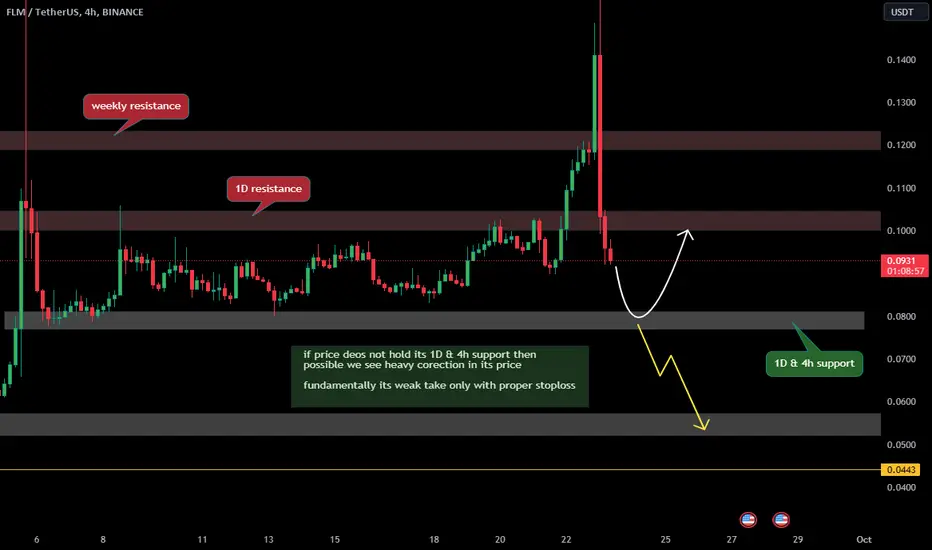
FLM COIN PRICE ANALYSIS !! WHY FLM COIN PRICE DROP TODAY ??CSE:FLM Coin Update & Next Possible Move Near Me !!
• Major indicators are Bearish on 1D & 4H Chart.
•whales manipulation on this project is on peak.. So without proper trade setup don't take any trade remaining support & resistance are clear on a chart.
Follow us for more free analysis.
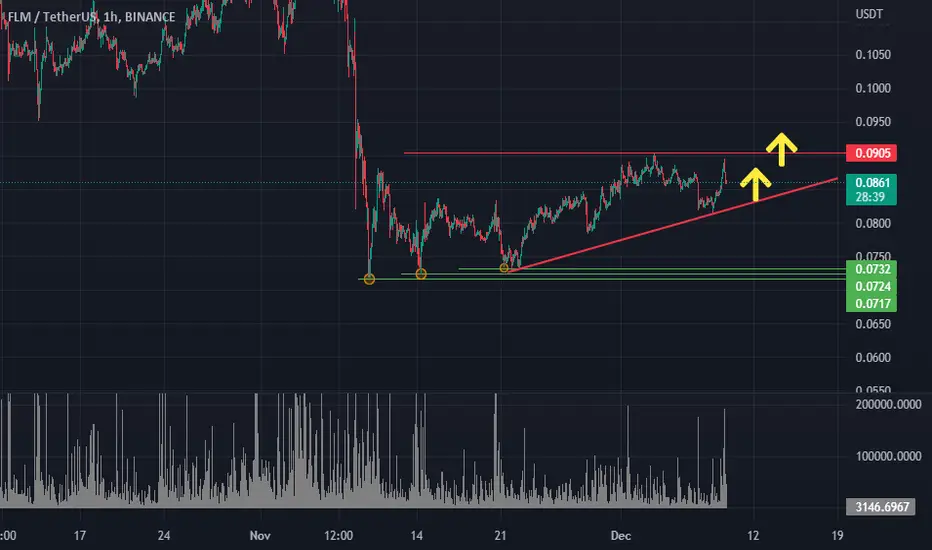
FLM/USDT Break out the falling wedge pattern, Bullish Momentum ?Yello Paradisers, take note! #Flamingo
💎 FLM has successfully broken out of its falling wedge pattern on the hourly chart, backed by substantial trading volume.
💎 Prior to this, FLM rebounded impressively upon hitting a demand zone in the same hourly timeframe. Additionally, the candlestick pattern displayed 'Three White Soldiers,' a bullish indicator.
💎 This creates a favorable short-term trading environment for FLM, supported by multiple bullish confirmations. You have the option to enter the trade now or wait for FLM to retest the support trendline of the previously broken falling wedge.
💎 This bullish outlook would be invalidated if FLM breaks below the key support level and closes there.

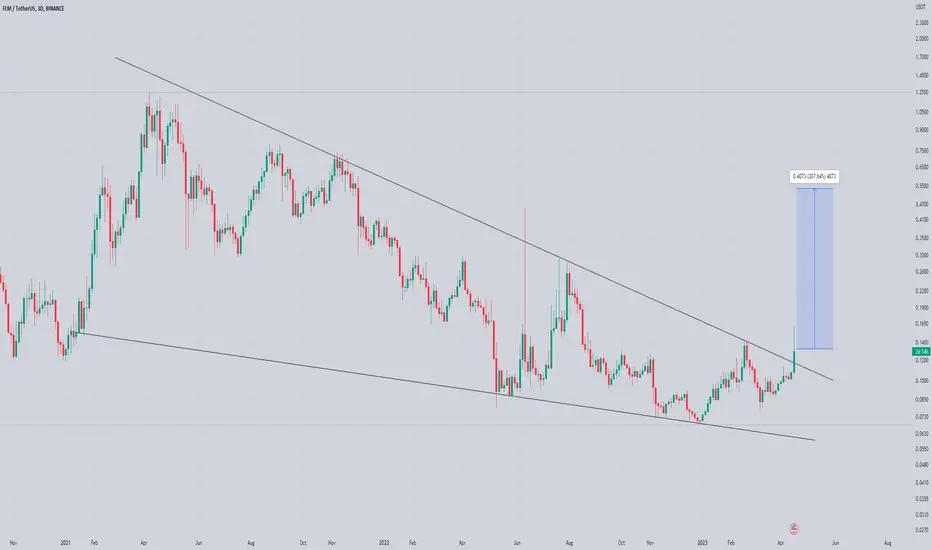
Finally Flm Getting Ready For Massive Breakout Seems Like Has Already Bottomed Out Massive Volume Coming While Formed Falling Wedge And Approaching Towards Trendline Expecting Breakout
Incase Of Successful Breakout Expecting 300%+ Bullish Rally In Midterm

flm Breaking falling Wedge Formed and breaking falling wedge In 3days Timeframe Incase Of successful breakout expecting 300 to 350% Bullish move
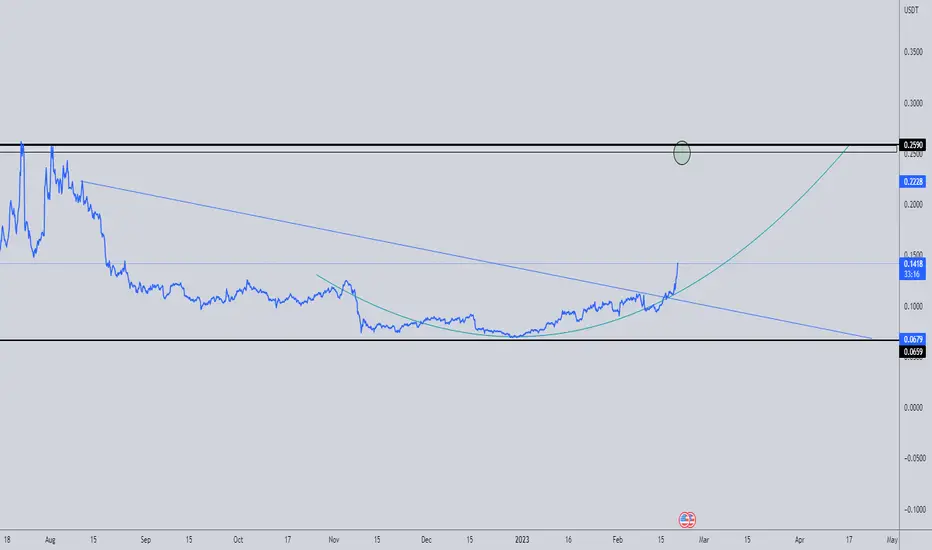
Very long term position on FLM. Risk reward 24/1Flamingo looks very strong for a long time. I expect growth within six months to the indicated goals.
Buy ~ 0.09-0.1$
1TP ~ 0.3$ (15%)
2TP ~ 0.49$ (30%)
3TP ~ 0.79$(55%)
SL - 0.067$
Buy on spot or futures. Leverage x2-x5

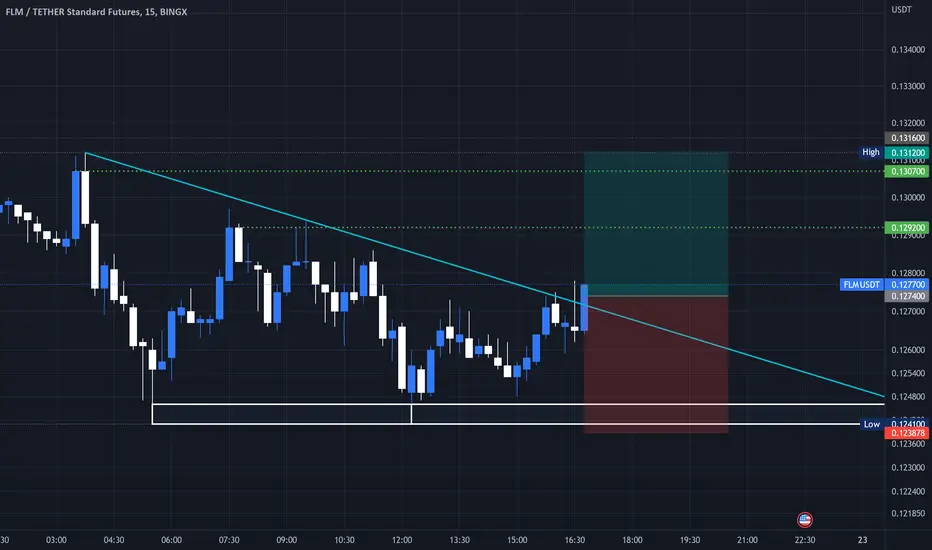
#FLM | #UsdtI think #Flm is bullish 15m
Targets : green lines
Don't risk more than 1% of capital.
_________________________________________
$FLM/#BTC [#Flamingo]: Resistance_Breakout◳◱ Hey traders, we've identified a Resistance Breakout on the $FLM / $BTC chart. The price has broken above a key resistance level, which can indicate a potential bullish trend. Taking in consideration the next resistance key levels are at 0.0000052 | 0.0000055 | 0.00000626 and the major support zones are respectively at 0.00000444 | 0.00000398 | 0.00000322. It is a bullish indication and we may consider entering at the current price zone at 0.00000543 and targetting higher levels.
◰◲ Technical Metrics :
▣ Mrkt Price: 0.00000543 ₿
▣ 24HVol: 52.979 ₿
▣ 24hChng: 12.422%
◲◰ Pivot Points - Levels :
◥ Resistance: 0.0000052 | 0.0000055 | 0.00000626
◢ Support: 0.00000444 | 0.00000398 | 0.00000322
◱◳ Indicators recommendation :
▣ Oscillators: BUY
▣ Moving Averages: STRONG_BUY
◰◲ Technical Indicators Summary : STRONG_BUY
◳◰ Market Sentiment Index :
▣ News sentiment score is N/A
▣ Twitter sentiment score is 0.52 - Bullish
▣ Reddit sentiment score is 0.80 - Very Bullish
▣ In-depth FLMBTC technical analysis on Tradingview TA page
▣ What do you think of this analysis? Share your insights and let's discuss in the comments below. Your like, follow and support would be greatly appreciated!
◲ Disclaimer
Please note that the information and publications provided are for informational purposes only and should not be construed as financial, investment, trading, or any other type of advice or recommendation. We encourage you to conduct your own research and consult with a qualified professional before making any financial decisions. The use of the information provided is solely at your own risk.
▣ Welcome to the home of charting big: TradingView
Benefit from a ton of financial analysis features, instruments and data. Have a look around, and if you do choose to go with an upgraded plan, you'll get up to $30.
Discover it here - affiliate link -
FLM: INCREASE VIEWFLM Showing depends on a low time frame increase view.
we will follow this coin to check the trend out.
🌠We will monitor FLM to see if it shows any upward movement in the lower time frames. If the trend looks promising, we will continue to track it beyond the initial 24-hour period
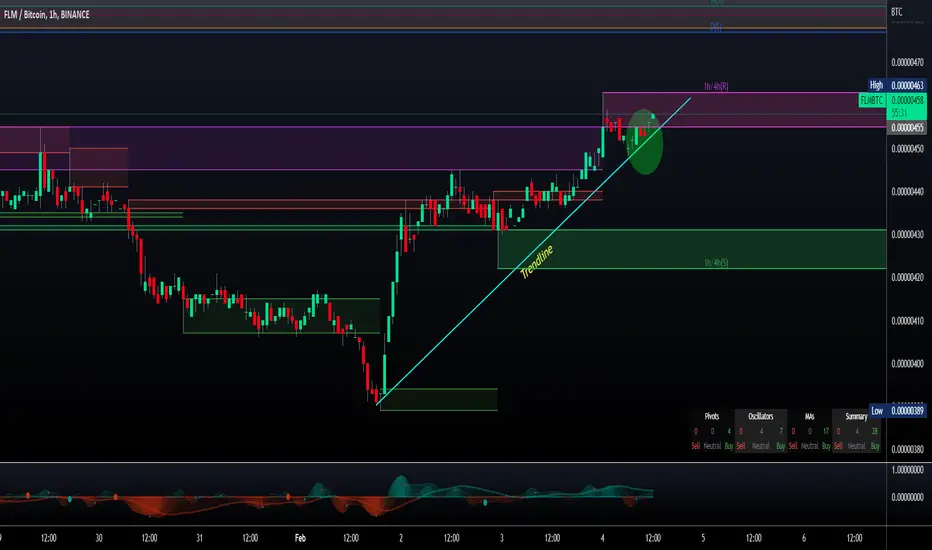
$FLM/#BTC [#Flamingo]: Resistance_Breakout_ConfirmationWe've detected a Resistance Breakout and Confirmation on the $FLM / $BTC chart. The price has broken above a key resistance level and has been confirmed by a strong candle, indicating a potential bullish trend. The next resistance key levels are at 0.00000462 | 0.00000485 | 0.00000532 and the major support zones are respectively at 0.00000415 | 0.00000391 | 0.00000344. We may consider entering a trade at the current price zone at 0.00000458 and targetting higher levels.
- Technical Metrics :
-- Current price: 0.00000458
-- 24H Volume: 12.7615 Ƀ
-- 24H Price change: 4.091%
- Pivot Points - Levels :
-- Resistance: 0.00000462 | 0.00000485 | 0.00000532
-- Support: 0.00000415 | 0.00000391 | 0.00000344
- Indicators recommandation :
-- Oscillators: NEUTRAL w/: 1 BUY - 0 SELL and 10 NEUTRAL
-- Moving Averages: STRONG_BUY w/: 14 BUY - 0 SELL and 1 NEUTRAL
--> Summary : BUY w/: 15 Total Buy - 0 Total Sell and 11 Total Neutral
- In-depth FLMBTC technical analysis on > Tradingview TA page
FLM DEVIATION SETUPweekly time frame deviation setup being played
fvgs to be filled soon
big divergences on rsi expecting a breakout


Technical analysis for FLMHigh sales volume failed to dump the price that shows us strong buyers. Higher than average volumes and probable liquidity grab demonstrate long movement continuation. Open long on high activity only.
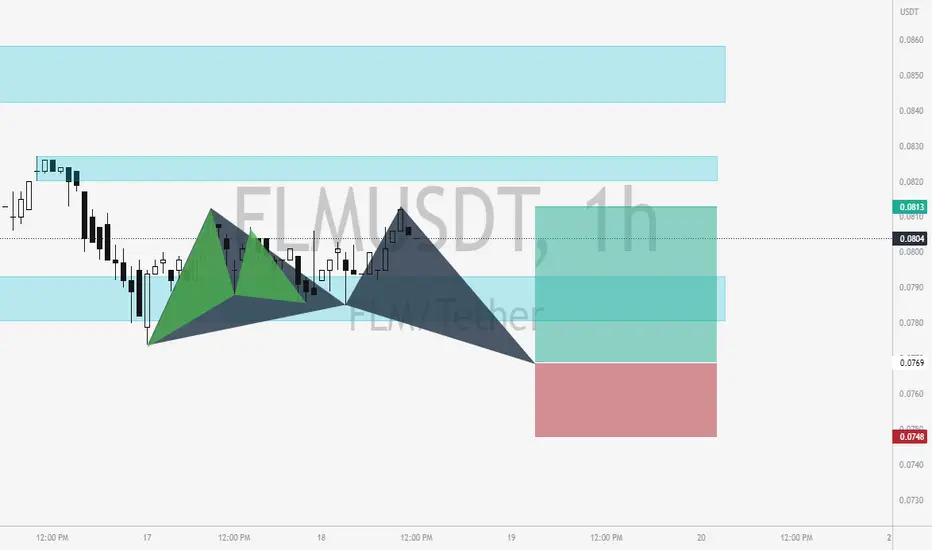
FLMUSDT, 1HBINANCE:FLMUSDT Potential Bullish Gartley
Potential Reversal Zone:
BC Retracement (1.272 | 1.618)
Near: 0.0777
Far: 0.07683
XA Retracement (0.786)
Near: 0.07821
Far: N/A
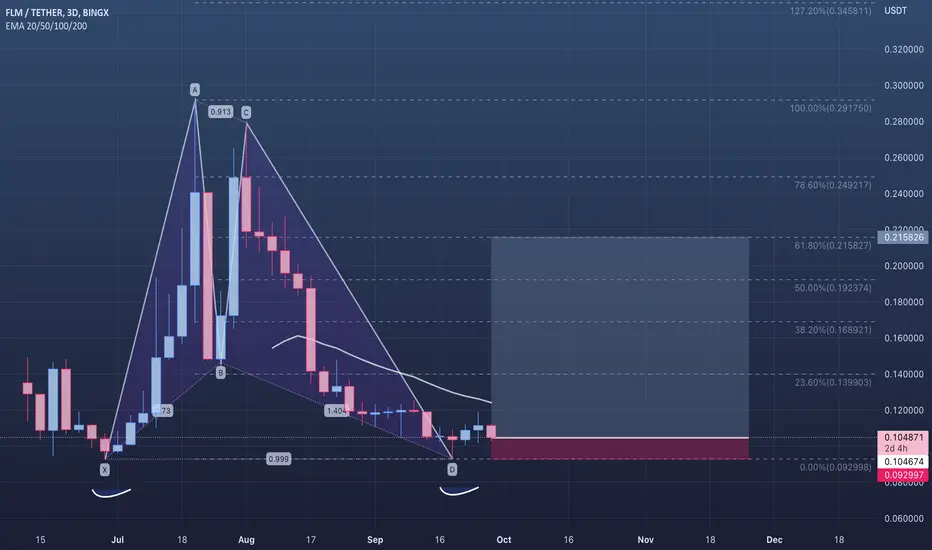
🟢 FLMUSDT - 3D (28.09.2022)🟢 FLMUSDT
TF: 3D
Side: Long
Pattern: Bullish Bat + Double Bottom
SL: $0.092997
TP 1: $0.139903
TP 2: $0.1689021
TP 3: $0.192374
FLM looks super bullish on the three day time frame.
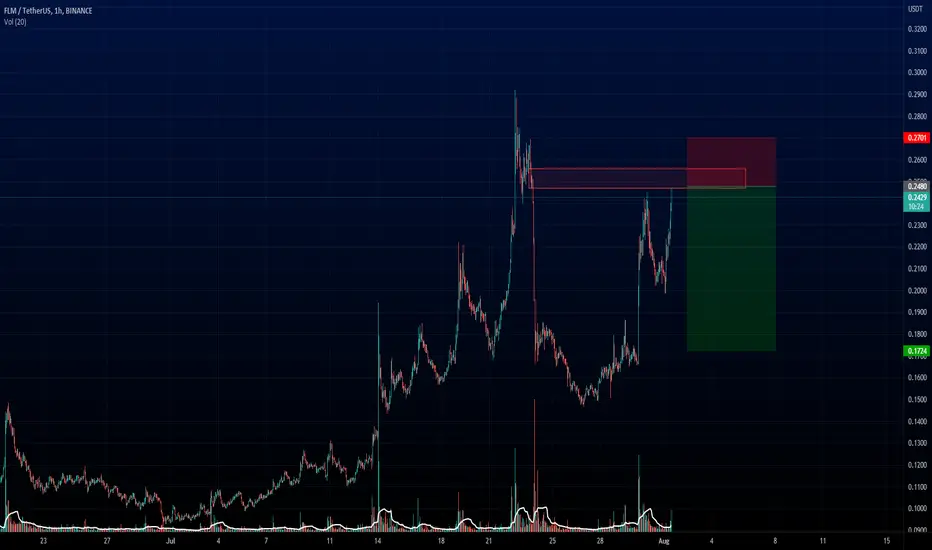
Where is FLM going?Make sure that you should not go long and wait to reach the supply area and take a short position in this area

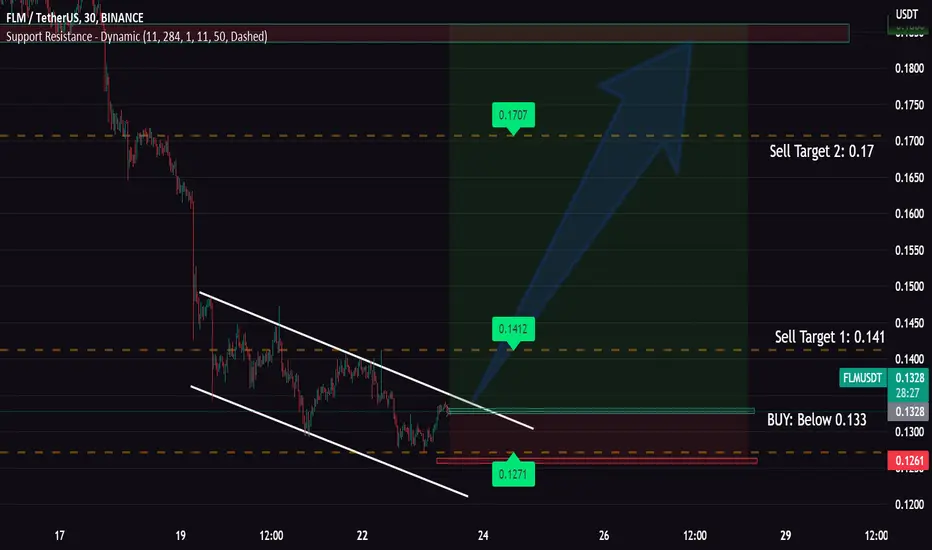
FLMUSDT 30M LONGFLM is forming a falling wedge channel. Breakout is very near. Buy some here. After the breakout of the above trendline, the price will go and test the 0.18-0.19 level.
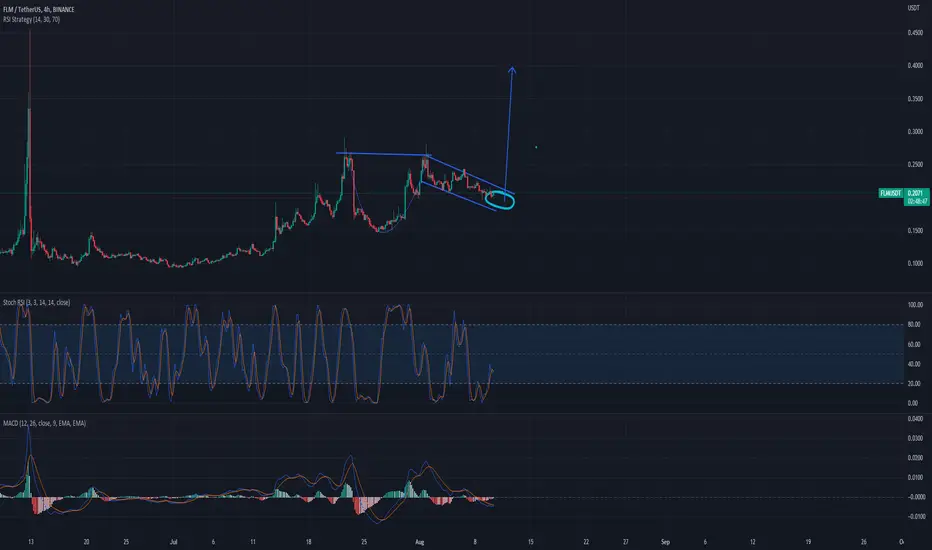
Classic cup and handle pattern Classic cup and handle pattern same with FLM/USDT
Classic cup and handle pattern same with FLM/USDT
Perfect cup and handle on FLM pattern to retest the 0.4 $Perfect cup and handle on FLM pattern to retest the 0.4 $
Another wave for FLMHello traders
after 30% pump for FLM as I said , i think FLM will has another pump up to 0.35
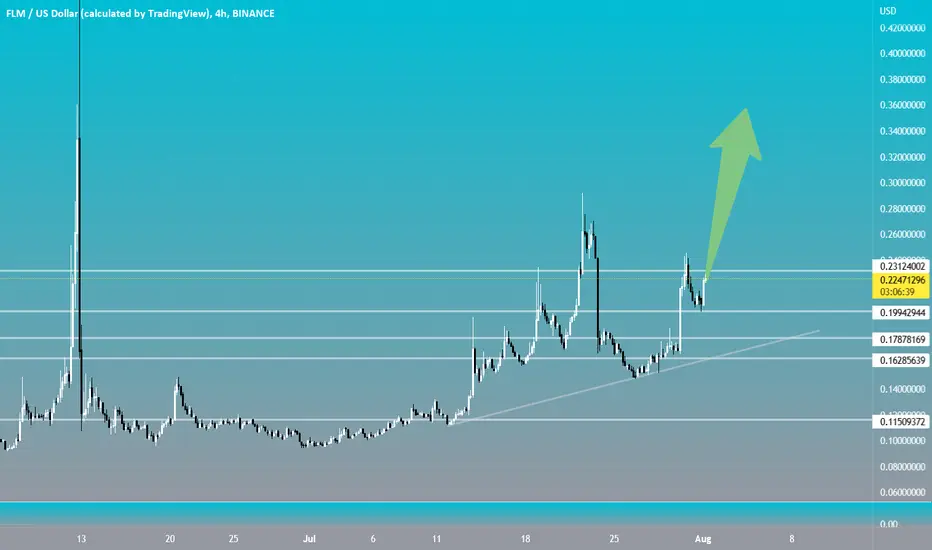
FLM is ready for a big moveHello traders ,
It's just my opinion
I believe FLM will confront increasing price ...

Flamingo (FLM) formed big bullish Gartley for upto 776% rallyHi dear friends, hope you are well and welcome to the new trade setup of Flamingo ( FLM ).
On a monthly time frame, FLM has formed a bullish Gartley pattern:
It can be quite a high-risk and high reward setup, but as FLM has already broken out a big bearish pennant on a weekly time frame, therefore, the buying for this Gartley move is quite confirmed.
Note: Above idea is for educational purpose only. It is advised to diversify and strictly follow the stop loss, and don't get stuck with trade.
