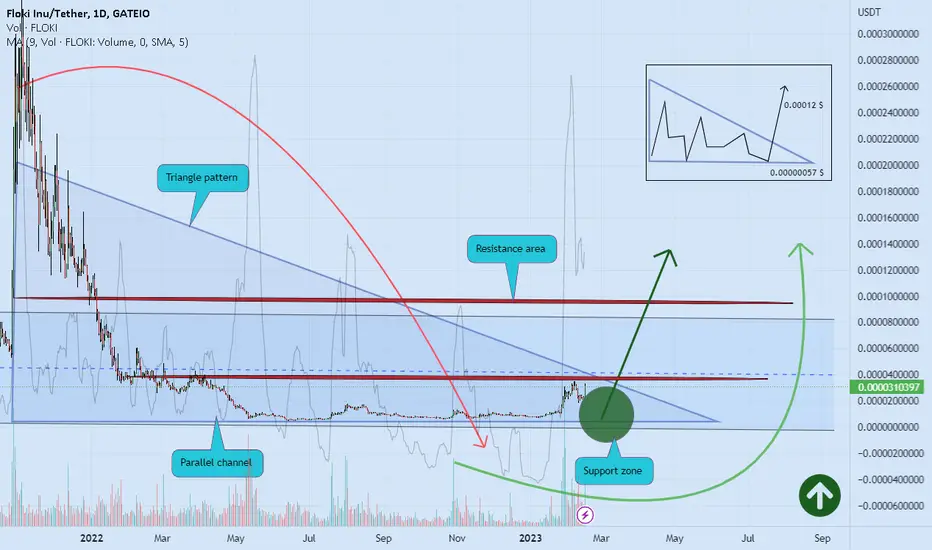
FLOKIUSDT triangle pattern and more range 📖💡🚀Hello 🐋
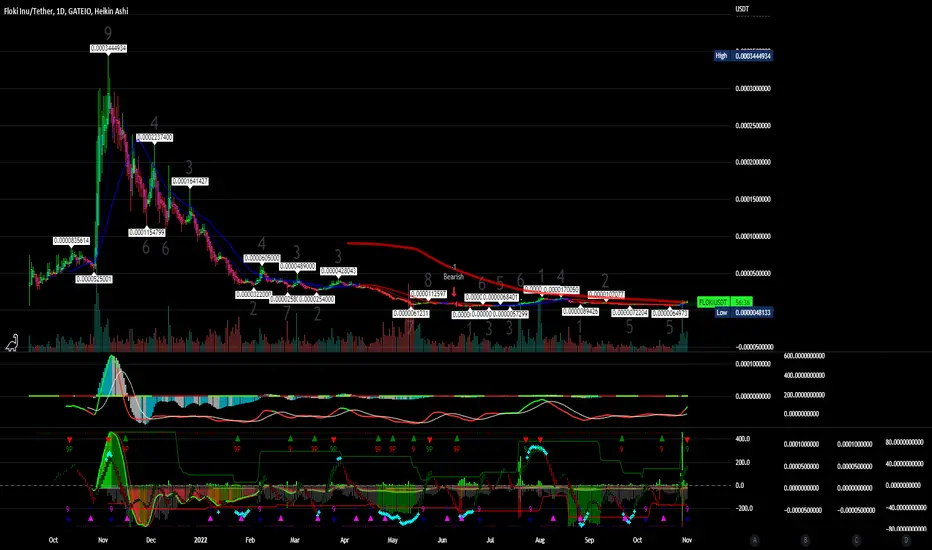
Based on the chart, the price is in the parallel channel close to the triangle support area ✔️
if
the price doesn't break the support zone to the downside, we will see more gain, at least to our upper trend line 💣🚀
otherwise
we can see more correction to lower support level ❌🧨
if
breakout of the upper resistance zone be completed, we can see more pump to the upside ✔️🚀
👌 Notice: pay attention to the price on shortcut chart (located below the main chart with black colour) 📖💡
Please, feel free to share your point of view, write it in the comments below, thanks 🐋
Flokicrypto
$BTC - Bitcoin Jan 2023 AnalysisBINANCE:BTCUSDTPERP
Greetings, and Happy New Year to all my fellow Berserkers!
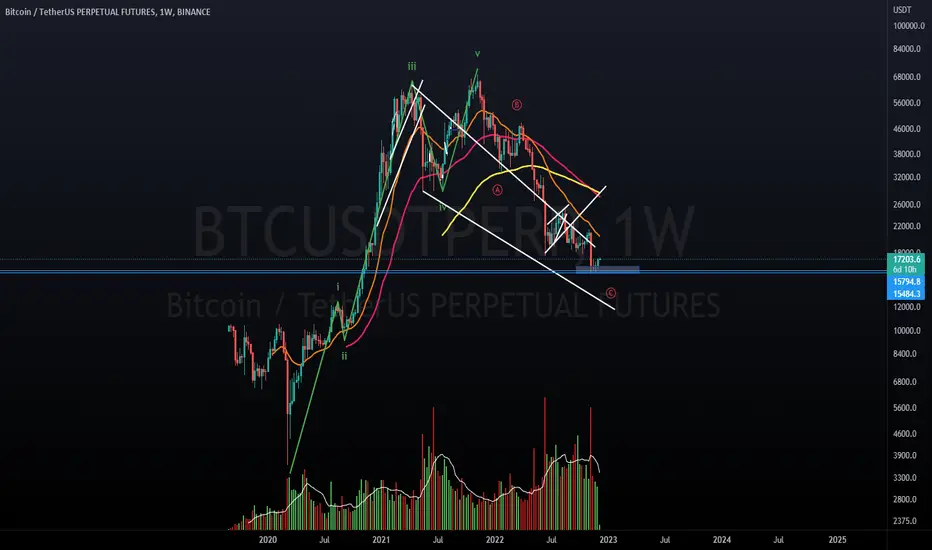
Yearly, Monthly, Weekly closes have all just happened. Which will allow us to dive deep into candle analysis as well as EW counts. Lets start with the main count on Bitcoin. (1W log Chart)
I've identified a general target zone for the year. The box was drawn based on previous S/R, but when I drew the fib lines, as we can see it also aligns with .333-.382 Fibonacci retracement lines. Which means we have a huge amount of confluence there. 25-26k also seems like a key level to reclaim in order to attain that target. This price constitutes our previous peak after the first descent under 20k.
MTF The final piece of info I want to delve into on this chart is the MTF indicator (just below the RSI). There seems to be a weekly fakeup printing there (Gray line moving upwards, alone). But we can also see the blue line curving slightly upwards. So the next week could be very determining in the direction we'll see in January of 2023.
Elliot Wave Theory The corrective count is still a bit up in the air. This could very well be a combo (WXY or WXYXZ). The only thing we're pretty sure on is that this is not a Flat for the moment! I've labelled it ABC for simplicity and for the fact that it is the most probably count. My doubts only stem from the difficulty of finding valid downward impulses with diverging 5th waves.
Falling wedge/Ending 5th while I typically don't do this, I've drawn the diagonal line from the bottom of wave 3. I'd like to see another touch to the bottom of the wedge support in order to give us a significant boost in PA on the bullish side thereafter.

$ETH - Shallow Flat playing out.$ETH - I'm looking for this sort of price action going into February. I think there's a decent long to be had at the end of this flat. If you zoom into the inside waves of the flat, its pretty clear its the main count.
The alt count is that 5 is still printing its diagonal, in which case the correction for the larger degree 4 could be deeper to around 1350-1375.
Trade safe y'all!

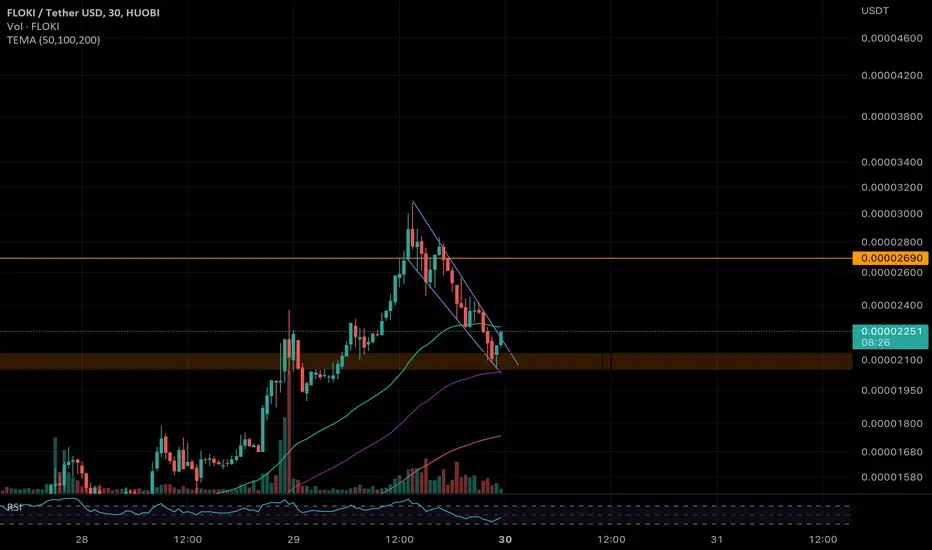
FLOKI ready for the next leg up?!Hi guys, a small update and my TA for Floki.
Wow! What a massive upwards movement! Congrats who took the ride. Why should you go long on TA perspective?
- The brown box is now acting as a support.
- On the lower time frames we see its moving in a falling wedge. In 2/3 cases it will break to the upside. You could trade it when its breaking out.
- RSI is cooling off.
- Volume is dropping. Could indicate for the next major move.
Keep om an eye on the next resistance 0000,27.
Good luck and happy trading!
$FTM scalp ideaThe Fed decision could trigger this trade with ease. The lower and upper trend lines are part of a larger degree diagonal and we're approaching the final wave down.
Safe trades.

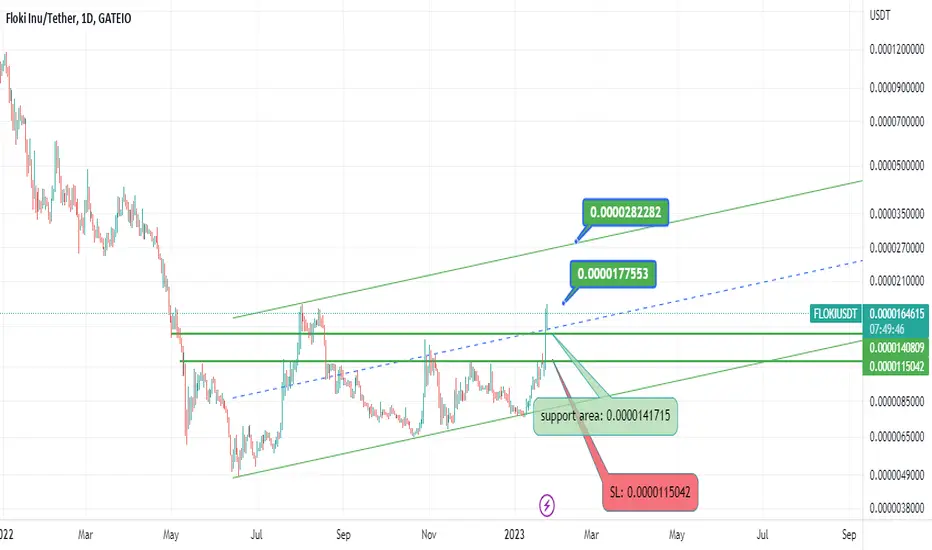
Floki possible path/UpdateThe target predicted in the previous analysis(Refer to the previous analysis) was touched beautifully and now we are facing the resistance range of the channel roof and a static resistance. Considering the market conditions, crossing this area is not out of mind, in which case the next target indicated in the image will be activated, otherwise, the price correction to the price range of $0.0000175603 will be possible.

Floki possible path/UpdateAs I predicted(Refer to the previous analysis), the goal was beautifully touched. After a little rest and price correction, it will be ready to conquer the second goal. Support areas as well as Stoploss are marked in the image.
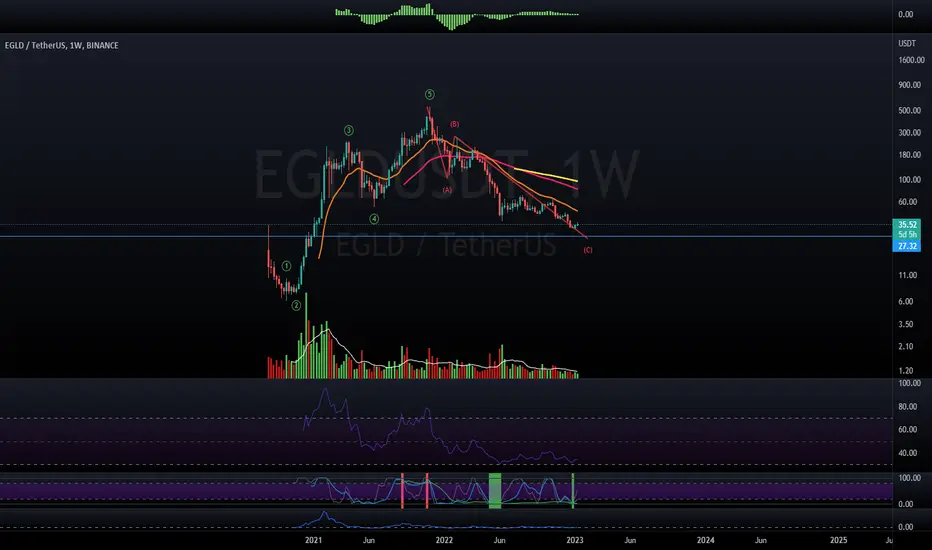
$EGLD - Eagle Brand. Finishing or finished its corrective structure. (could also just be wave A like with FTM).
The candle count on the bull market vs the bear market for this coin. Its 100% Symmetric at the moment (57 candles vs 57 candles).
I like what I see here. I would be interested in buying in heavily a bit lower for a 50RR minimum. 50% chance I will not get my lower entry because momentum is shifting in the market.
Safe trades and happy Analyses to you all.
FTM - Corrective structure for a while. Bullish short term. I could paint the 5 waves down as a corrective structure. But, I simply can't ignore how much they looks like an impulse, making me believe more in a wave A... :
- Deep wave 2 retrace
- Strong wave 3
- Diagonal 5 with a divergence.
This would be my main count on FTM. There is considerable upside to be had regardless. A notable minimum target on this would be the .382 of wave A.
Safe trades to all and happy analyses.

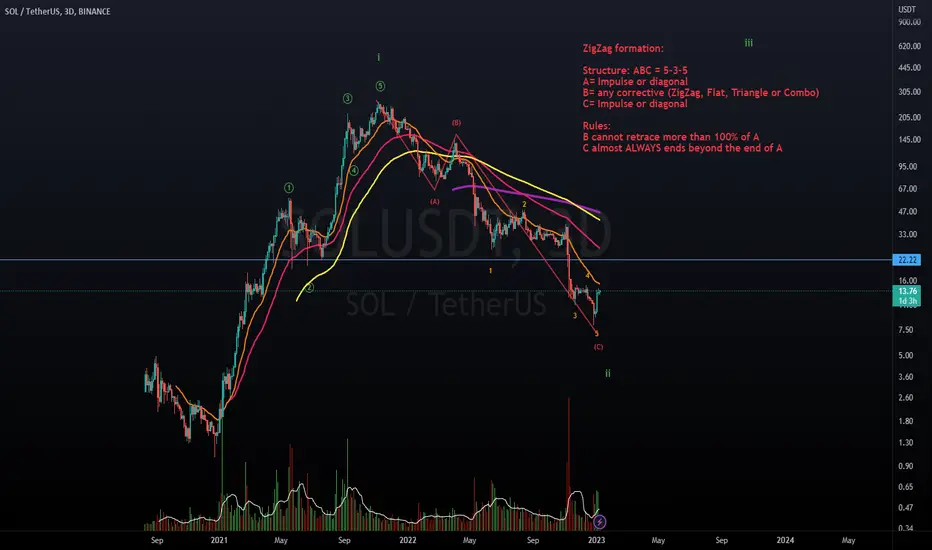
$SOL - Looks promising. 3D Chart Log.
First off: 1-2 subminuette seems likely finished (i-ii).
Secondly: Zoomed into the subwave count of (C), we have a clear divergence at the bottom with a bounce that showed is the most volume for the past 6 months. 5 waves of C seem to be in. There is always a possibility of a lower low, but I doubt we'd be breaking into anything other than a subwave 5 of 5.
Make sure you read up on the ZigZag structural reminder on the chart itself. Going back to basics and zooming out always puts things into perspective for me.
Here's an attached copy of the weekly log without oscillators.
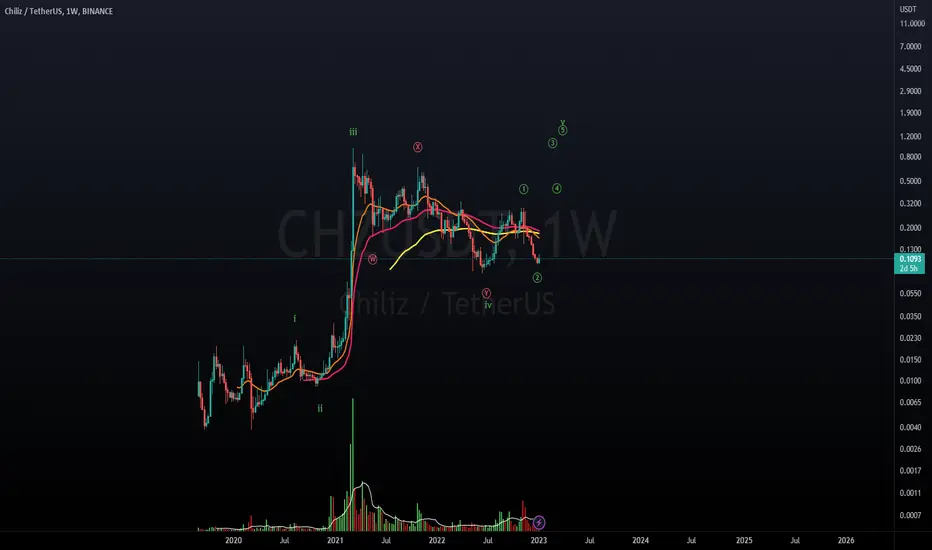
$CHZ - Macro scale Elliott Wave analysis. Weekly Log. Bullish count. I do have an alternate bearish count, but both coincide with a bounce, so for now I'll keep it under wraps. I have us having finished w4 with an WXY combo. with w1-2 finished on the 5th wave. The ratios so far are nice. A move (even a wick) below $0.0816 would invalidate this count (making wave 2 go below the start of wave 1).
*Second Chart* Daily chart (still log chart) with subwave counts.
HBAR - Ending diagonal 5th wave.My previous analysis of this coin dates back 6 months.
I got it wrong in that 70% odd should have been in favor of the correction not being done. In hindsight, there was no divergence on the weekly (there still isn't). But is that the relevant timeframe? Probably not, also in hindsight. Now, having zoomed in slightly to the 3D chart (still Log), we can see there is a nice divergence on many indicators (I've only marked RSI for clarity):
RSI
MTF
Histo
Volume
Rate of Change
Is now the right time to say that we have 70% odds of the correction is over? I won't make that mistake again :D But its looking good. I'll be waiting with an alert set on my FSS Indicator to print a buy signal on this 3D timeframe to add to my bags.
Happy and safe trades to you all.
For reference, this is the link to the former Idea is below under related ideas.

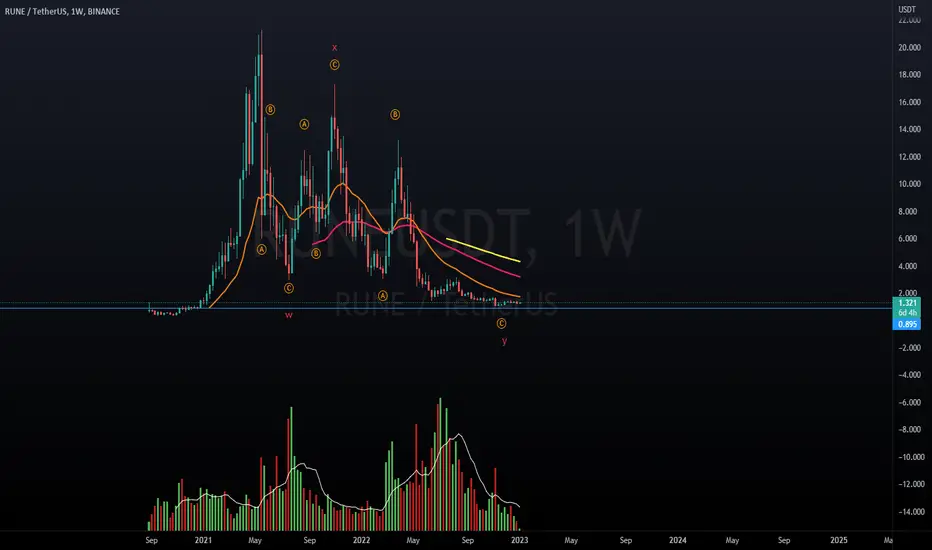
RUNE - Are your bags full ? RUNE Weekly here. (linear).
Clear bottoming pattern is forming and we're in the final stages of the WXY correction (finishing up the 5th wave of C of Y). I'm really excited about this chart and have been for sometime. The last time I added to my bags was around 1.19. If we make a new low, which is about 50/50 right now, I will add more without hesitation.
Once my FSS indicator prints a buy signal, I will also buy adding to my position. After 3 consecutive Sell signals on the 3D, I am anxiously awaiting for it to go green.
Bitcoin - Le fond du baril. Bitcoin Log Weekly chart. We're nearing the end of this ABC. All CME gaps are filled in the 10k-20k range. Elliott wave structure is beautiful and bullish signs are starting to print on high timeframes.
The pain is almost over.
Happy trades to all.
$FLOKIUSDT Super Duper Supernova! 🌙⭐️💫🌟✨What Is Floki (FLOKI)?
Floki (FLOKI) is the people's cryptocurrency and the utility token of the Floki Ecosystem. It is a cryptocurrency birthed by fans and members of the Shiba Inu (SHIB) community and is inspired by (and named after) Elon Musk’s Shiba Inu.
Musk is a prominent fan of Dogecoin, although he publicly denied owning any SHIB. Floki Inu is working on “four flagship utility projects:”
An NFT gaming metaverse called Valhalla
A suite of decentralized finance products launched under the "FlokiFi" umbrella.
An NFT and merchandise marketplace called FlokiPlaces
A content and education platform called University of Floki
The community calls itself the “Floki Vikings” in honor of Floki (Musk’s dog) that was named after a Viking character.
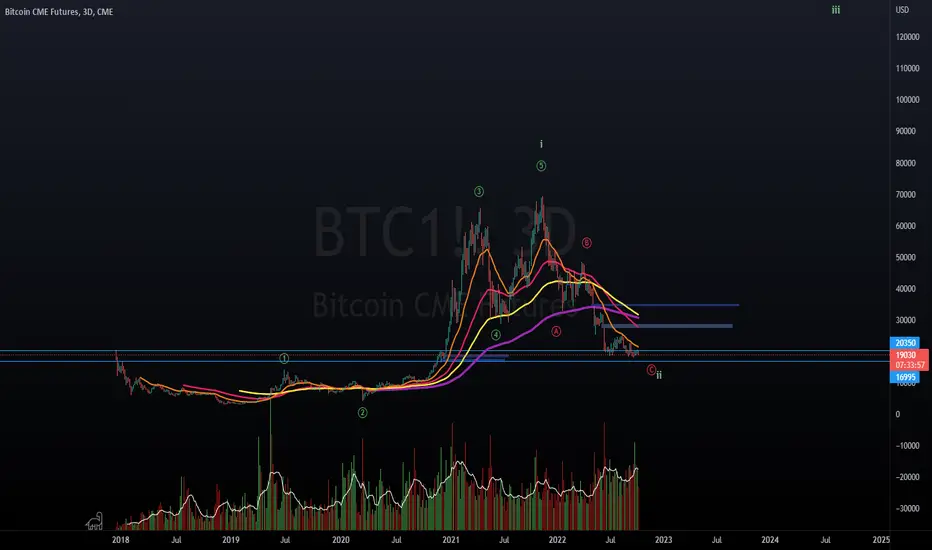
$BTC - CME Macro 3D Elliott Wave Update $BTC - Macro Chart. Ending diagonal is starting to print out on the larger TFs. The most harmonious chart I've found is on the 3D where you can imagine the curving towards the end of C. Lots of confluence for a bounce just around 17k, including a gap from late 2020, previous resistance all the way back in 2018 and more recently, a bounce from late 2020 once again.
fib extension with those numbers gives us a 1.618 target for wave iii around 125k. This is obviously all very hypothetical and will need to be re-evaluated once the bottom is found, if it hasn't been found already.
This is my main macro count. I have an alt count where the correction could span a few more years (this being only wave C of A).
Trade safe.
$THETA - 2D Elliott Wave UpdateSomeone asked me for a $THETA chart yesterday and I found the chart very interesting in that there is a decent case for this correction being done, but also a nice strong support not too far off (approx -20-25% down)...
I drew the support line blue and its just below the red price line. If we don't make a new low, we could bounce here at any moment, but I prefer to keep all options open. Its never a good thing to not see other options.
Safe trades to all.

$HBAR Log chart Elliott Wave Analysis. Floki here with the first of many Elliott Wave Analysis crypto updates.
Starting with HBAR, a coin very close to my heart, which I will qualify as Blue Chip going forward. The RL use cases it brings to the table are undeniable.
But on the technical side, is the correction done? I'd say the odds of it being done are at about 70%. There is still room (30% chance) to go lower with a final 5th wave of Ⓒ. That would make this whole move up and down a Macro i & ii. And we all know what comes next right ? The infamous wave iii on macro scale.
My bias was way off in my last analysis on January. But the market has shown us its hand as of now.
Trade safe y'all.

$FTT (Log)- Correction unlikely done here. But looks promising. This is one of my bluechip coins and has been for sometime. I miss the first move up and I don't intend to let that happen again.
Some big CT accounts are calling for sub 10$ prices. While I can understand the confluence, I still see a support well above that level. With the extended 3rd wave, I do see a good reason to bounce around the 19$ range. I see the waves clearly on this coin and I'll be tempted to short into my bias at some point in the near future. I see us finishing waves ii/Ⓨ/(C)/5 with the current 5 wave impulsive or diagonal structure. WXY is clear as day from the top of ⑤.
Safe trades to all of you. Don't forget your SL.

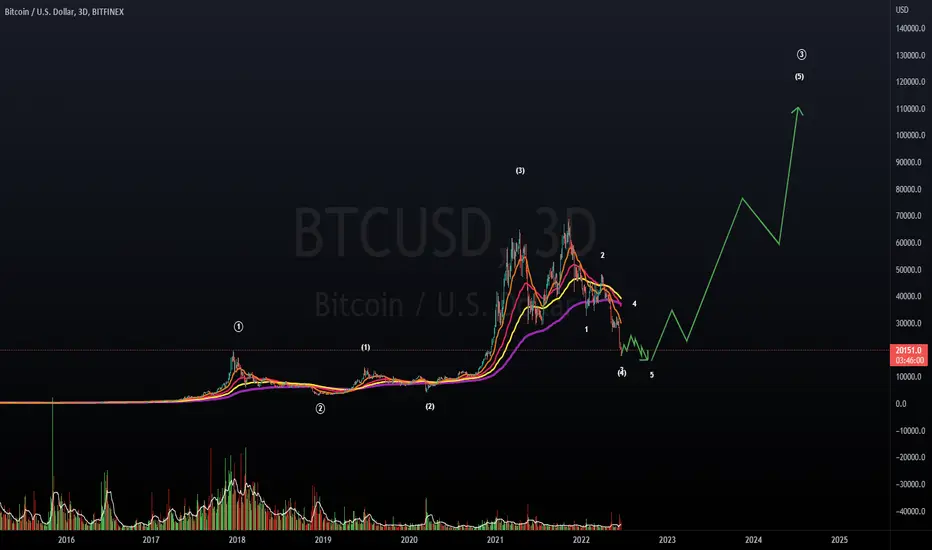
$BTC - #Bitcoin. My current take. If we go back to my analysis in August of 2021, you could see I had anticipated the flat. Although it went higher than anticipated, I count this as a success.
I had a bit of trouble looking into the 2017 bull run for the sub wave count, but it works. Subwaves matter, but we have established as a community that the 2017 run was wave 1 and we are currently in wave 3.
As for the current structure, if i'm wrong and the top isn't a flat, we may be in for a much longer bear market... as this could be only A playing out.
For now let's assume C is coming to an end within the next few weeks so we can look to greener pastures and a new bull run.
Safe trades to all. Stay safe out there.
$QNT - (Log chart) Getting down there soon. This is a follow up from my last (failed) idea on $QNT: It did not run independently this time. It failed to regain its EMA support and fell like the rest. But I do anticipate this coin will have one of the strongest runs in the next part of this cycle:
I see a WXY correction almost finishing and we can see there is some decent convergence support on the right side of the chart.
Let me know what you think.
Trade safe.

$MATIC - Very juicy opportunities await. This is an update from this Idea back in March. As you can see, the waves played out beautifully. Its now time to zoom in, count the waves and pinpoint where it will end its run.
So I have us going up for wave 4 of C (almost done mind you). And then the way down to finish off wave 5 like the majority of the crypto space. I have my eyes on two zones identified by the magnets. We will be able to zoom in some more as the waves come in and we get closer to bottom time.
Trade safe.

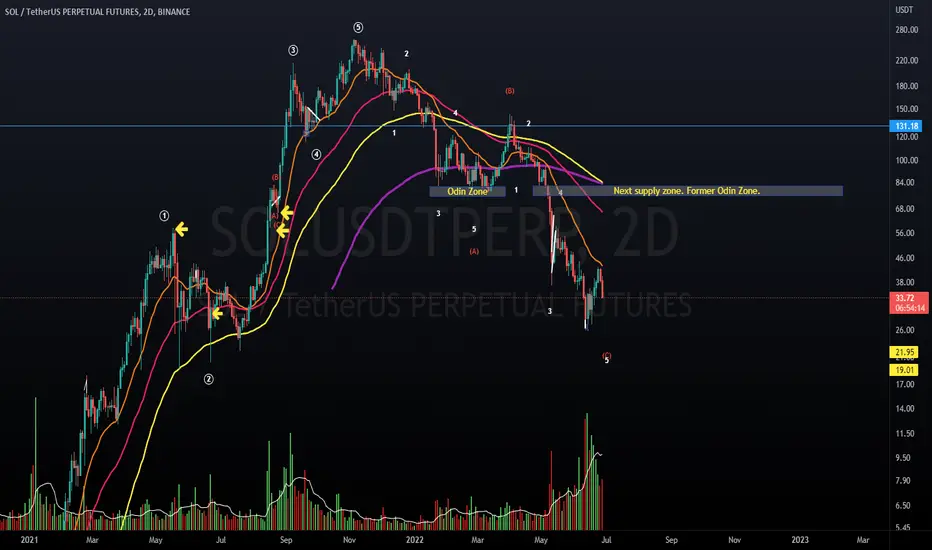
$SOL - Update on a previous Analysis. Bottom almost in.
If you click play, you'll see I have a wave analysis. I've updated the waves in this one. You can see my new targets are a bit lower, but I'm still expecting the move down to be over in the coming weeks.
We are in the final wave 5 of C in a lovely zigzag correction.
I hope this chart soothes crypto soul as it did mine. I'm wishing this Eth killer the best of luck.
Safe trades to all!